

Abstract
Gastrointestinal polyps are treated as the precursors of cancer development. So, possibility of cancers can be reduced at a great extent by early detection and removal of polyps. The most used diagnostic modality for gastrointestinal polyps is video endoscopy. But, as an operator dependant procedure, several human factors can lead to miss detection of polyps. In this peper, an improved computer aided polyp detection method has been proposed. Proposed improved method can reduce polyp miss detection rate and assists doctors in finding the most important regions to pay attention. Color wavelet features and convolutional neural network features are extracted from endoscopic images, which are used for training a support vector machine. Then a target endoscopic image will be given to the classifier as input in order to find whether it contains any polyp or not. If polyp is found, it will be marked automatically. Experiment shows that, color wavelet features and convolutional neural network features together construct a highly representative of endoscopic polyp images. Evaluations on standard public databases show that, proposed system outperforms state-of-the-art methods, gaining accuracy of 98.34%, sensitivity of 98.67% and specificity of 98.23%. In this paper, the strength of color wavelet features and power of convolutional neural network features are combined. Fusion of these two methodology and use of support vector machine results in an improved method for gastrointestinal polyp detection. An analysis of ROC reveals that, proposed method can be used for polyp detection purposes with greater accuracy than state-of-the-art methods.
Keywords: Endoscopic image, Video endoscopy, Convolutional neural network (CNN), Color wavelet features, Support vector machine (SVM), Improved method
Introduction
Cancer is the most leading cause of death in the whole world. Again, the most commonly occuring cancer is gastrointestinal cancer, which originates from gastrointestinal polyps. Actually, gastrointestinal polyps are the abnormal growth of tissue on gastric and colonic mucosa. This growth is a slow process and in majority of the cases, before reaching a large size, they do not produce symptoms. However, cancer is preventable and curable, if polyps could be detected earlier.
Video endoscopy is the most used diagnostic modality for gastrointestinal polyps. As an operator dependant procedure, it’s not possible for a medical person to examine it with sufficient attentiveness during such long and back-to-back endoscopy. However, accuracy of the diagnosis depends on doctor’s experience. So, while the examination, some polyps may remain undetected. This miss detection of polyps can lead to malignant tumors in future. So, computer aided polyp detection methods are of great value for reducing polyp miss detection rate.
A large number of methods have been proposed and applied for computer aided polyp detection system. Covariances of the second-order statistical measures over the wavelet frame transformation (CWC) of different color bands have been used as the image features in [1] for colonoscopy tumor detection with 97% specificity and 90% sensitivity. In their consecuitive work [2], an intelligent system of SVM and color-texture analysis methodologies was developed having accuracy 94%. Adaptive neuro fuzzy based approach for polyp detection in video Capsule Endoscopy (VCE) was proposed by Kodogiannis et al. [3]. Using texture spectrum from different color channels, they obtained 97% sensitivity over 140 images. Combination of Color and shape features were used to discriminate polyp from normal regions in [5]. About 94.20% accuracy was gained when they used multilayer perceptron (MLP) as the classifier. Alexandre et al. [4] showed the comparison of texture based and color and position based methods performed in database of 4620 images and obtained area under the curve (AUC) value of 94.87% for the texture histogram of RGB + XY. Another computer aided lesion detection system based on convolutional neural network (CNN) is utilized for more features of endoscopy images in [7]. They also showed comparison between CNN features and combination of color histogram features and LBP features in the experiment. Features learned by CNN outperformed the other method. Tajbakhsh et al. [8] presented a new method integrating global geometric constraints of polyp and local patterns of intesity variation across polyp boundaries. A deep convolutional neural network based classification problem was studied for classifying digestive organs in wireless capsule endoscopy in [6]. In the work [9], CNN features have been used to improve the accuracy of colonic polyp classification with sensitivity of 95.16% and specificity of 74.19%. A unique 3-way image presentation and convolutional neural network based polyp detection method have been proposed by Tajbakhsh et al. [10]. Jia et al. [11] used 10,000 WCE images for automatic bleeding detection strategy. They also used convolutional neural network (CNN) for this purpose. Ribeiro et al. [12] sugested that, if CNN is trained from scratch, learned features are more relavant for automated polyp detection system. CNN derived features show greater invariance to viewing angles and image quality factors when compared to the eigen model [13].
In this paper, an improved method, based on the fusion scheme of wavelet color texture analysis and convolutional neural network features has been proposed as a support to gastrointestinal polyp detection.
The rest of the paper is organised as follows: proposed system architechture used in this study is described in Sect. 2. In Sect. 3, experimental results are analyzed. Finally, the conclusions of this study is presented in Sect. 4.
Proposed improved method
The main problem in medical image processing research is lackings of enough dataset. So, a large number ofvendoscopic video and images are collected. Color wavelet features are good representative of color texture of an image. Again, in convolutional neural network (CNN), features are better suited for recognition tasks, because they combine all the primitive features into a richer image representation. CNN and Color wavelet features are extracted from every region of an endoscopic image using sliding window technique. These features are used for training a classifier. Then a target endoscopic image is given to the classifier as input to find whether it contains any polyp or not. If polyp is found, it will be marked automatically. Figure 1 illustrates the proposed method.
Fig. 1.

Proposed improved method
Data collection
Though feature selection is an important factor for computer aided (CAD) medical image analysis, but data availibility is another important issue for this purpose. The performance of any CAD depends on data set. How ever, the strength of this proposed system is that, it utilizes more than 100 standard videos from different sources including own dataset. Most of the data have been collected from department of Electronics, University of Alcala (http://www.depeca.uah.es/colonoscopy_dataset/) [14]. Another important source of data set is Endoscopic Vision Challenge (https://polyp.grand-challenge.org/databases/) [15]. Also the proposed system is assesed against standard dataset. From the endoscopy videos, more than 14,000 images are collected using sliding window method in matlab for training classifier, amomg which, one-third images are polyp and rest are non polyp. There are different categories of polyps such as: Lumen, Diverticula, Adenoma, Hyperplastic and Serrated polyp (Table 1).
Table 1.
Demographic information of dataset
| Name | Figure | % among total data (%) |
|---|---|---|
| Normal tissue |
|
66 |
| Lumen |
|
5 |
| Diverticula |
|
4 |
| Adenoma |
|
10 |
| Hyperplastic |
|
10 |
| Serrated |
|
5 |
Wavelet color texture feature extraction
The size of polyps varies in different patients. So, multiresolutional analysis such as wavelet performs better for textural analysis. But [1] suggests that, grayscale textural features are not sigficant representative for Video endoscopy images. So, propoosed system extracts color textural features from wavelet decomposed images.
Every RGB image has three color channels: red, green and blue. So, input image, I (slided window) is decomposed into three color channels I C where C = r, g, b.
A 3-level and 2-dimensional discrete wavelet transformation is applied on each I c, generating a low resolution image and three details image where CL = 1, 2, 3…9 for 3-level decomposition.
As textural information is localized in the middle wavelet detailed channels original image, only the detail images for CL = 4, 5, 6 are taken into account (Fig. 2). So, finally total nine images {} are considered for further processes, where CL = 4, 5, 6 and C = r, g, b.
Fig. 2.
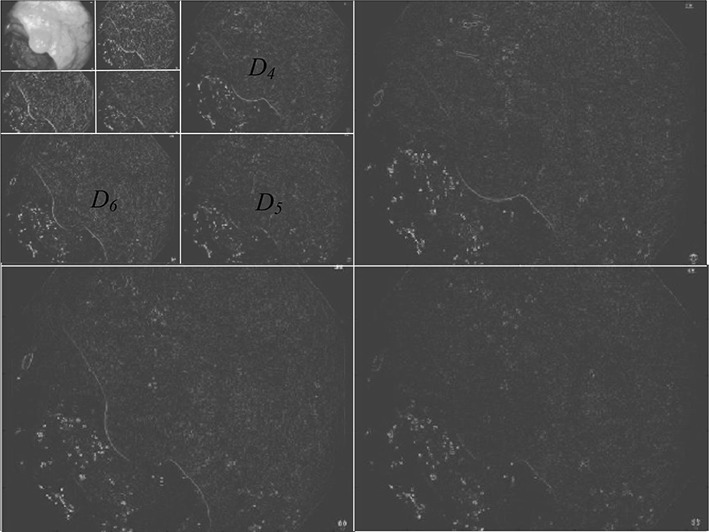
Three level wavelet decomposition of red channel
For finding information about spatial relationships of pixels in an image another statistical method named co-occurance matrix is calculated over above nine images. These matrics are calculated in four different directions 0°, 45°, 90° and 135° generating 36 matrics.
In the paper [18, 19] various statistical features were proposed among which four statistical measures are considered in this proposed system: Correlation, Energy, Homogeinity and Entropy. Finally, four statistical measures for 36 matrices results in total 144 color wavelet features.
Convolutional neural network (CNN) feature extraction
A simple Convolutional Neural Network (CNN) is a sequence of layers where every layer of a CNN transforms one volume of activations to another through a differentiable function. CNNs apply consecuitive filters to the raw pixel data of an image to extract and learn different features that can be used for classification. The architecture of a typical CNN is composed of multiple layers where each layer performs a specific function of transforming its input into a useful representation. The CNN proposed by this work is inspired by [14, 16, 17]. It contains following layers, parameters and configuration (Fig. 3):
Input Layer slided window image from video frame of size 227*227*3.
Two combination of convolutional and pooling layers first convolutional layer consisting of 96 filters of size 11 × 11 has padding 0 and stride set to 4.The second convolutional layer consisting of 256 filters of size 5 × 5 with padding 2 and stride 1. Both layers are followed by a ReLU rectifier function. After each convolutional layer there is a max-pooling layer consisting of windows with size 3 × 3 and stride set to 2.
Three convolutional layer and a pooling layer The Third fourth and fifth convolutional layers are followed by ReLU function contains 384, 384,256 filters respectively. After this three convolutional layer, there is a max pooling layer with size 3 × 3 and stride set to 2.
Fully connected layer and the output layer Total three fully connected layer first and second fully connected layer has 4096 neurons each and the third fully connected layer also called output layer has two neorons (polyp and non Polyp). This output layer can be activated by a softmax regression function.
Fig. 3.
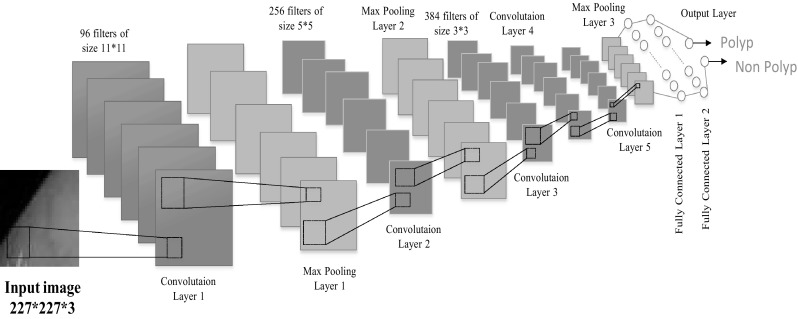
An illustration of proposed CNN feature extraction segment
Each layer of a CNN produces a response, or activation, to an input image. However, there are only a few layers within a CNN that are suitable for image feature extraction. The layers at the beginning of the network capture basic image features, such as edges and blobs. These “primitive” features are then processed by deeper network layers, which combine the early features to form higher level image features. These higher level features are better suited for recognition tasks because they combine all the primitive features into a richer image representation. In this system, features have been extracted from fully connected layer 2.
Training SVM
Many classifier have been used for computer aided medical system including Linear discriminant analysis (LDA) [1, 20], neural networks [5, 21], Adaptive neuro fuzzy Inference System [3], Support Vector Machine (SVM) [5, 22]. In this proposed system, SVM has been used for better performance in the case of noisy and sparse data. SVM performance is less affected by feature–to-sample ratio. Many applications have gained better result using SVM for medical image analysis [23, 24].
A Support Vector Machine (SVM) is a binary classifier that tries to find the best hyperplane between data points of two classes. The hyperplane broadens the margin between two classes. The support vectors are the points closest to the hyperplane. An illustration of SVM is given in Fig. 4 where Blue represents class 1data points and Red represents class 2 data points.
Fig. 4.

Linear support vector machine
Proposed system launches a multiclass support vector machine using a fast linear solver. For all the polyp and non polyp images, color wavelet and CNN features are extracted. Each image generates 144 color wavelet features and 4096 CNN features which are fused together to form the input feature vector for training SVM classifier.
After the SVM has been trained, it can can be used for further polyp and non polyp classification tasks. So, using the extracted features of an image, classifier gives the decision whether the window is polyp or non polyp. If the window is detected as polyp it goes to the output segment.
Output
The output of clsssification segment is processed in this part to mark possible polyp region. As the size of polyps varies in size, different portion of a polyp region may be marked as possible polyp like Fig. 5a. In this situation score values of each marker region given by SVM is assesed. After the regions with higher scores are found their position are averaged to find the final marker like Fig. 5b.
Fig. 5.
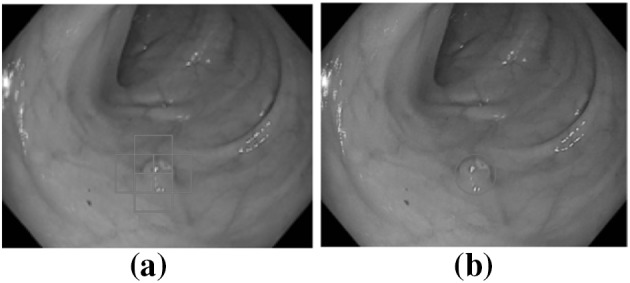
Output a Severals portions are marked to be possible polyp, b after processing
Results and discussion
In conventional validation (e.g. partitioning the data set into two sets of 70% for training and 30% for test), there is not enough data available to partition it into separate training and test sets without losing significant modelling or testing capability. In these cases, a fair way to properly estimate model prediction performance is to use cross-validation as a powerful general technique. Cross-validation is a technique to evaluate predictive models by partitioning the original sample into a training set to train the model, and a test set to evaluate it.
In k-fold cross-validation, the original sample is randomly partitioned into k equal size subsamples. Of the k subsamples, a single subsample is retained as the validation data for testing the model, and the remaining k − 1 subsamples are used as training data. The cross-validation process is then repeated k times (the folds), with each of the k subsamples used exactly once as the validation data. The k results from the folds can then be averaged (or otherwise combined) to produce a single estimation.
For evaluating proposed system, tenfold cross-validation is applied. Extracting features from training dataset, support Vector machine is trained with those features. Then features from test dataset is extracted and passed through the trained classifier.
For medical data classification, sensitivity (true positive rate) and specificity (true negative rate) are more reliable to accuracy (rate of successful detection). For this system, following measures are calculate:
From the Fig. 6 and information above, it is observed that proposed fusion model color wavelet features and convolutional neural network features gives much satisfactory outcome when choosing SVM as the classifier.
Fig. 6.

Confusion matrix of proposed system
Comparison with other methods using dataset used in this study
A comparison among different polyp detection methods using same dataset used in this study is shown in Table 2. Proposed method gains better result than other methods with higher accuracy.
Table 2.
Comparison among different polyp detection methods
| Paper | Used methodology | Result | ||
|---|---|---|---|---|
| Accuracy (%) | Sensitivity (%) | Specificity (%) | ||
| Kodogiannis et al. [3] | Texture + ANFIS | 98 | ||
| Zhu et al. [7] | CNN + SVM | 85 | 83 | 82.54 |
| Zou et al. [6] | DCNN | 96 | ||
| Karkanis et al. [1] | CWC + LDA | 97.5 | 92 | |
| Iakovidis et al. [2] | KL + Wavelet + SVM | 95 | ||
| Proposed system | Color Wavelet + CNN + SVM | 98.34 | 98.67 | 98.23 |
Conclusion
Computer aided endoscopic polyp detection is of great interest now a days as a support to the medical persons. Selection of proper features is more important than selection of classifier in automated polyp detection methods. In this paper, the strength of color wavelet features and power of convolutional neural network features are combined. Fusion of these two methodology and use of support vector machine results in an improved method for gastrointestinal polyp detection. Evaluations on standard public databases show that, proposed system outperforms state-of-the-art methods, gaining accuracy of 98.34%, sensitivity of 98.67% and specificity of 98.23%. An analysis of ROC reveals that, proposed method can be used for polyp detection with greater accuracy than state-of-the-art methods. In future, fusion of CW and CNN features will be used for ultra sound image analysis.
Conflict of interest
The authors declare that, there is no conflict of interest regarding this paper.
Ethical standard
All procedures performed in this study involving human participants were in accordance with the ethical standards of the institutional and/or national research committee and with the 1964 Helsinki declaration and its later amendments or comparable ethical standards.
References
- 1.Karkanis SA, et al. Computer-aided tumor detection in endoscopic video using color wavelet features. IEEE Trans Inf Technol Biomed. 2003;7(3):141–152. doi: 10.1109/TITB.2003.813794. [DOI] [PubMed] [Google Scholar]
- 2.Iakovidis DK, Maroulis DE, Karkanis SA. An intelligent system for automatic detection of gastrointestinal adenomas in video endoscopy. Comput Biol Med. 2006;36(10):1084–1103. doi: 10.1016/j.compbiomed.2005.09.008. [DOI] [PubMed] [Google Scholar]
- 3.Kodogiannis V, Boulougoura M. An adaptive neurofuzzy approach for the diagnosis in wireless capsule endoscopy imaging. Int J Inf Technol. 2007;13(1):46–56. [Google Scholar]
- 4.Alexandre LA, Nobre N, Casteleiro J. Color and position versus texture features for endoscopic polyp detection. In: International conference on biomedical engineering and informatics, 2008. BMEI 2008. Vol. 2. IEEE; 2008.
- 5.Li B, et al. Intestinal polyp recognition in capsule endoscopy images using color and shape features. In: 2009 IEEE international conference on robotics and biomimetics (ROBIO). IEEE; 2009.
- 6.Zou Y, et al. Classifying digestive organs in wireless capsule endoscopy images based on deep convolutional neural network. In: 2015 IEEE international conference on digital signal processing (DSP). IEEE; 2015.
- 7.Zhu R, Zhang R, Xue D. Lesion detection of endoscopy images based on convolutional neural network features. In: 2015 8th international congress on image and signal processing (CISP). IEEE; 2015.
- 8.Tajbakhsh N, Gurudu SR, Liang J. Automatic polyp detection using global geometric constraints and local intensity variation patterns. In: International conference on medical image computing and computer-assisted intervention. Springer; 2014. [DOI] [PubMed]
- 9.Ribeiro E, Uhl A, Häfner M. Colonic polyp classification with convolutional neural networks. In: 2016 IEEE 29th international symposium on computer-based medical systems (CBMS). IEEE; 2016.
- 10.Tajbakhsh N, Gurudu SR, Liang J. Automatic polyp detection in colonoscopy videos using an ensemble of convolutional neural networks. In: 2015 IEEE 12th international symposium on biomedical imaging (ISBI). IEEE; 2015.
- 11.Jia X, Meng MQH. A deep convolutional neural network for bleeding detection in wireless capsule endoscopy images. In: 2016 IEEE 38th annual international conference of the engineering in medicine and biology society (EMBC). IEEE; 2016. [DOI] [PubMed]
- 12.Ribeiro E, et al. Exploring deep learning and transfer learning for colonic polyp classification. Comput Math Methods Med. 2016;2016:368. doi: 10.1155/2016/6584725. [DOI] [PMC free article] [PubMed] [Google Scholar]
- 13.Park SY, Sargent D. Colonoscopic polyp detection using convolutional neural networks. In: SPIE medical imaging. International Society for Optics and Photonics; 2016.
- 14.Mesejo P, et al. Computer-aided classification of gastrointestinal lesions in regular colonoscopy. IEEE Trans Med Imaging. 2016;35(9):2051–2063. doi: 10.1109/TMI.2016.2547947. [DOI] [PubMed] [Google Scholar]
- 15.Bernal J, et al. Comparative validation of polyp detection methods in video colonoscopy: results from the MICCAI 2015 endoscopic vision challenge. IEEE Trans Med Imaging. 2017;36:1231–1249. doi: 10.1109/TMI.2017.2664042. [DOI] [PubMed] [Google Scholar]
- 16.Krizhevsky A, Sutskever I, Hinton GE. Imagenet classification with deep convolutional neural networks. In: Advances in neural information processing systems; 2012. P. 1097–1105.
- 17.Donahue J, et al. DeCAF: a deep convolutional activation feature for generic visual recognition. In: Icml, Vol. 32; 2014.
- 18.Haralick RM. Statistical and structural approaches to texture. Proc IEEE. 1979;67(5):786–804. doi: 10.1109/PROC.1979.11328. [DOI] [Google Scholar]
- 19.Haralick RM, Shanmugam K. Textural features for image classification. IEEE Trans Syst Man Cybern. 1973;3(6):610–621. doi: 10.1109/TSMC.1973.4309314. [DOI] [Google Scholar]
- 20.West D, West V. Model selection for a medical diagnostic decision support system: a breast cancer detection case. Artif Intell Med. 2000;20(3):183–204. doi: 10.1016/S0933-3657(00)00063-4. [DOI] [PubMed] [Google Scholar]
- 21.Baxt WG. Application of artificial neural networks to clinical medicine. Lancet. 1995;346(8983):1135–1138. doi: 10.1016/S0140-6736(95)91804-3. [DOI] [PubMed] [Google Scholar]
- 22.El-Naqa I, et al. A support vector machine approach for detection of microcalcifications. IEEE Trans Med Imaging. 2002;21(12):1552–1563. doi: 10.1109/TMI.2002.806569. [DOI] [PubMed] [Google Scholar]
- 23.Goszczyński J. Texture classification using support vector machine. Pattern Recogn. 2003;36:2883–2893. doi: 10.1016/S0031-3203(03)00219-X. [DOI] [Google Scholar]
- 24.Gokturk SB, et al. A statistical 3-D pattern processing method for computer-aided detection of polyps in CT colonography. IEEE Trans Med Imaging. 2001;20(12):1251–1260. doi: 10.1109/42.974920. [DOI] [PubMed] [Google Scholar]