Abstract
Blood flow in micro capillaries of diameter approximately 15–500 μm is accompanied with a lower tube hematocrit level and lower apparent viscosity as the diameter decreases. These effects are termed the Fåhraeus and Fåhraeus–Lindqvist effects, respectively. Both effects are linked to axial accumulation of red blood cells. In the present investigation, we extend previous works using a shear-induced model for the migration of red blood cells and adopt a model for blood viscosity that accounts for the suspending medium viscosity and local hematocrit level. For fully developed hematocrit profiles (i.e., independent of axial location), the diffusion fluxes due to particle collision frequency and viscosity gradients are of equal magnitude and opposite directions. The ratio of the diffusion coefficients for the two fluxes affects both the Fåhraeus and Fåhraeus–Lindqvist effects and is found related to the capillary diameter and discharge hematocrit using a well-known data-fit correlation for apparent blood viscosity. The velocity and hematocrit profiles were determined numerically as functions of radial coordinate, tube diameter, and discharge hematocrit. The velocity profile determined numerically is consistent with the derived analytical expression and the results are in good agreement with published numerical results and experimental data for hematocrit ratio and hematocrit and velocity profiles.
Keywords: Red blood cells, Axial accumulation, Apparent blood viscosity, Microvessels, Cell depletion
Introduction
The reduction in the tube hematocrit (HT) in comparison with the discharge hematocrit (HD), in the approximate capillary diameter range 15–500 μm [1], is known as the Fåhraeus effect [2] and is attributed to high concentration of red blood cells (RBCs) in the core region of the area of flow. The drop in the apparent viscosity, observed by Martini [3] and Fåhraeus and Lindqvist [4], is called the Fåhraeus–Lindqvist effect. Most of the blood flow resistance in the vascular system occurs in micro vessels with diameters in the range of 10–300 μm [5]. The approximate range of blood vessel diameters is from 3 μm to 3 cm [6]. For a capillary diameter (D) below 7 μm and as low as 2.7 μm, both the apparent viscosity and HT increase sharply. The mechanisms for changes of the apparent viscosity with D are discussed in [7].
A recent review of blood viscosity models as a function of local hematocrit and/or shear rate can be found in Hund et al. [8]. The models include, among others, the Krieger–Dougherty model, the Quemada model, and a modified Krieger–Dougherty model by Hund et al.
Haynes [9] proposed a marginal zone theory in which RBCs concentrate in the core region, while the outer zone is a RBC-free layer. Haynes assumed the outer zone thickness to be uniform and independent of capillary diameter (D). Haynes’ approach using a two-zone concept was extended in [1, 10–12]. Fournier [1] used a published relation for viscosity as a function of hematocrit and assumed the viscosity to be uniform in the core region. Using published data for apparent viscosity yielded results showing an increase in the relative outer zone thickness with decreasing capillary diameter [1]. Sharan and Popel [10] considered the suspending medium viscosity to be different from the plasma viscosity and used Pries et al.’s data-fit correlations for both the hematocrit ratio HT/HD and the relative apparent viscosity of blood [6]. Chebbi [11] extended the marginal zone theory of Haynes [9] and the developments by Fournier [1] and Sharan and Popel [10] by considering viscous dissipation and microvascular network problems involving bifurcations while using the correlation of Pries et al. for HT/HD [6]. Sriram et al. [12] used the Quemada model to obtain the viscosity of the core region layer. A numerical solution was obtained using the data-fitted equations in Pries et al. [6] for calibration to obtain the cell-free layer thickness as a function of HD [12].
In a different development, Leighton and Acrivos [13] proposed mechanisms for particle diffusion in non-uniform shear flow involving a flux in the direction of decreasing frequency of interactions between particles, along with another flux in the direction of lower viscosity. Phillips et al. [14] extended the work of Leighton and Acrivos [13], amended the forms of the fluxes, and included them in a conservation equation for the particle concentration. Using the Krieger–Dougherty model for blood viscosity [15], Phillips et al. [14] obtained an analytical expression for the variation of the particle concentration as a function of radial position in capillary flow, in agreement with the computational works of Weert [16] and Mansour et al. [17]. Using the particle migration model of Phillips et al. [14] (also used in [16]) along with the Quemada model for blood viscosity [18], Mansour et al. [17] found the flux coefficients to depend on HT and dimensionless radial position. The effect of red blood cells’ elasticity [19] on RBC migration is addressed in [20–22], with the model of Mavrantzas and Beris [23, 24], proposed for polymer solutions, adopted for blood flow dynamics by including Fickian cell migration in addition to elastic-stress induced migration instead of shear-induced migration as in the Leighton and Acrivos model [13].
Governing equations
The hematocrit and velocity profiles satisfy the conservation of mass and momentum equations.
Hematocrit level profile
The hematocrit level H is defined as the RBC volume fraction. At steady state, the fully developed hematocrit profile in capillary flow is only a function of the radial coordinate r. The tube and discharge hematocrit levels HT and HD are cross-sectional averages defined as [25]:
| 1 |
| 2 |
For H and v functions of r only, the equations take the following form:
| 3 |
| 4 |
where R is the capillary tube inner radius.
The RBC conservation equation includes the accumulation term in addition to the advection and the diffusion terms.
| 5 |
At steady state, the above equation reduces in the fully developed region to:
| 6 |
where Jr is the total hematocrit flux in the radial direction. The Phillips et al. model [14] (extending the work of Leighton and Acrivos [13]) is adopted for the diffusional terms resulting from gradients in the hematocrit level, shear rate, and viscosity with
| 7 |
where
| 8 |
| 9 |
in which a is the red blood cells radius and σ denotes the shear rate:
| 10 |
Velocity profile
The two boundary conditions are the no-slip condition at the wall:
| 11 |
and the symmetry condition at the centerline:
| 12 |
Using the notations in Bird et al. [26], the momentum balance in the z-direction reduces to:
| 13 |
where dP/dz is the pressure gradient and the shear stress τ is given as a function of the shear rate σ by:
| 14 |
Both terms in Eq. (13) are constant as one term of the equation depends on r and the other term depends on z.
Integrating with respect to r while using:
| 15 |
gives
| 16 |
In dimensionless form, we have
| 17 |
where
| 18 |
Expressing vav as
| 19 |
in terms of the defined dimensionless variables yields
| 20 |
The Poiseuille equation defines the apparent viscosity as
| 21 |
This gives a simple relationship between Ω and μapp:
| 22 |
Integrating the RBC conservation equation, Eq. (6), yields
| 23 |
where C is an integration constant.
Jc and Jμ can be expressed in dimensionless form using Eqs. (8) and (9):
| 24 |
| 25 |
In addition, the fluxes are finite at the centerline:
| 26 |
Using Eqs. (23) and (26) shows that the integration constant C is zero. Substituting and from Eqs. (24) and (25), respectively into yields after simplification:
| 27 |
where ζ is defined as Kμ/Kc.
Using the chain rule, along with , Eq. (17), yields in dimensionless form:
| 28 |
Expressing Eq. (28) in dimensional form gives
| 29 |
Hematocrit and velocity profiles
To solve for the hematocrit and velocity profiles, a viscosity model is required. In the present work, the Krieger–Dougherty eq. [15] is adopted:
| 30 |
where n = 1.82 and Hm is the maximum hematocrit level.
The hematocrit and velocity changes are governed by Eqs. (17) and (28), subject to the two boundary conditions:
| 31 |
| 32 |
where Hw is the hematocrit level at the capillary wall.
Substituting for viscosity from the Krieger–Dougherty equation into the differential equations provides:
| 33 |
| 34 |
Integrating Eq. (33) provides r as a function of H, in agreement with Eq. (30) in Ref. [14] where the value of n = 1.82.
| 35 |
Substituting for and integrating Eq. (34) yields the following expression for the dimensionless velocity profile:
| 36 |
Using the dimensionless profiles, HT and HD can be calculated from:
| 37 |
| 38 |
Analytical Solution for the Velocity Profile
The following Taylor series expansion is used:
| 39 |
where
| 40 |
Substituting into Eq. (36) and integrating yields
where
| 41 |
Solution procedure
The data-fit relations obtained by Pries et al. [6] (based on many in vitro experimental values for the apparent viscosity) are used. The expression found for the relative viscosity is given by [6]:
| 42 |
where:
| 43 |
Substituting the former equation into Eq. (42) yields a relationship that takes the following form:
| 44 |
where F is a lengthy expression that can be readily determined from Eqs. (42) and (43).
For given values of the discharge hematocrit HD and the apparent viscosity, it is possible to find the capillary diameter D numerically by trial and error using the Regula–Falsi method.
Krieger–Dougherty model parameters
The model parameters for blood flow modeling are summarized in Hund et al. [8]. The value of n is close to 2 for blood, while it is theoretically 1.66 in the case of suspended solid spheres [8]. The value used in [14, 16, 17] is 1.82.
The maximum hematocrit fraction Hm is thought to be in the range 0.98–1 [8]. The value considered for Hm in [14] is 0.68 for solid spheres.
In the present model, we used n = 1.82. Changing n to 2 did not produce any significant changes in the results. The value of Hm = 0.67 was selected for the purpose of comparison with the published numerical results in [16, 17]. On the other hand, the value of Hm = 0.98 (in the range recommended in Hund et al. [8]) was selected for comparison with the numerical results of Sriram et al. [12] and the experimental data [28–31] reported in [12].
Numerical procedure for ζ selected
The value of Hw is required in order to integrate Eqs. (33) and (34), while using the boundary conditions, Eqs. (31) and (32).
(i) For given values of the discharge hematocrit HD and D, trial and error using the secant method can be used to satisfy:
| 45 |
(ii) If HT is provided, Hw is determined by trial and error to satisfy Eq. (37).
In both the cases (i) and (ii), the reduced apparent viscosity can be found as:
| 46 |
Once Hw is found, the hematocrit ratio HT/HD can be found from the numerical integration results.
Numerical procedure for the determination of ζ as a function of D and HD
For a fixed value of ζ, Hw, HT, HD, HT/HD and μapp/μp are determined as discussed in Section 5.1. The proper value of D is determined so as to satisfy both Eqs. (45) and (46):
| 47 |
Using different values of ζ for a given value of HD provides the relation between ζ and capillary diameter D.
Results
Comparison with the results of Weert [16] and Mansour et al. [17]
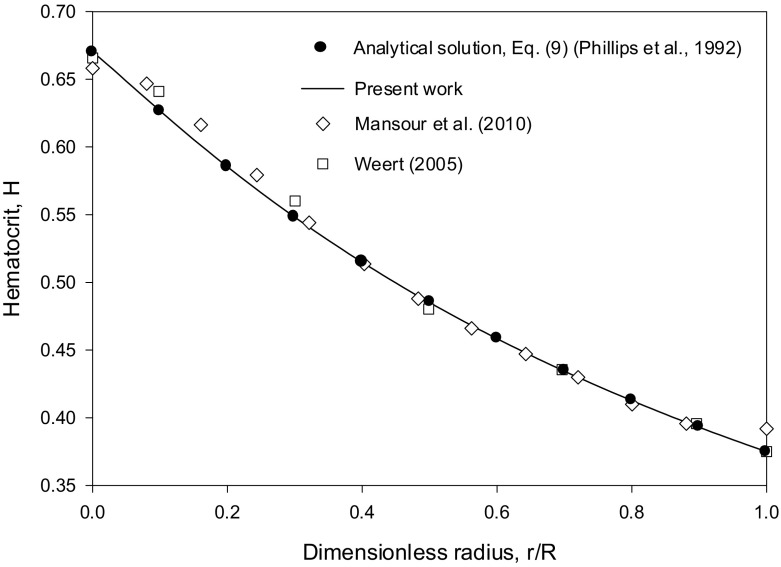
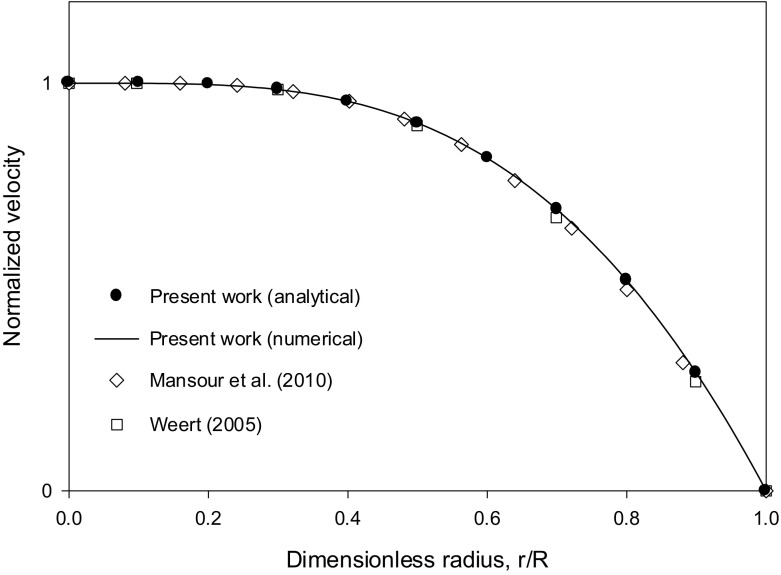
Both numerical results were obtained in the case of blood flow with HT = 0.45 using the ratio ζ = Kμ/Kc = 0.62/0.41 = 1.512, along with the Krieger–Dougherty viscosity model for blood with n = 1.82. The values of Hm used in [16, 17] are close as seen in Fig. 1 (about 0.66–0.67). The value Hm = 0.67 was selected in the present work. The simulations in [17] were run using ANSYS Fluent CFD software. Weert [16] used a Galerkin finite element simulation code. The profiles obtained for the hematocrit and the normalized velocity to the centerline value are shown in Figs. 1 and 2, respectively. The present numerical results obtained by the Runge–Kutta integration of Eqs. (33) and (34), are in excellent agreement with the analytical solution (Eq. (30) in [14] for the hematocrit profile equivalent to the generalized Eq. (35) in the present work with n = 1.82) and the derived analytical expression, Eq. (41) for the velocity profile. Both profiles are in good agreement with the numerical solutions in [16, 17] as seen from Figs. 1 and 2. The derived analytical expression, Eq. (41), is an infinite series. Keeping only the first terms in the infinite series expansion (up to k = 10 in Eq. (41)) was found sufficient (Figs. 1 and 2).
Fig. 1.
Comparison of the Runge–Kutta numerical integration results for the hematocrit profile (using Eqs. (33) and (34)), the analytical solution, Eq. (30) in [14] (generalized Eq. (35) in the present work with n = 1.82) and the numerical solutions in [16, 17] for the case HT = 0.45, using Kμ = 0.62, Kc = 0.41 (ζ = 1.512) and Hm = 0.67
Fig. 2.
Comparison of the Runge–Kutta numerical integration results for the normalized velocity profile (using Eqs. (33) and (34)), the analytical solution, Eq. (41) and the numerical solutions in [16, 17] for the case HT = 0.45, using Kμ = 0.62, Kc = 0.41 (ζ = 1.512) and Hm = 0.67
Comparison with Sriram et al.’s numerical results [12] and reported experimental data [27–31]
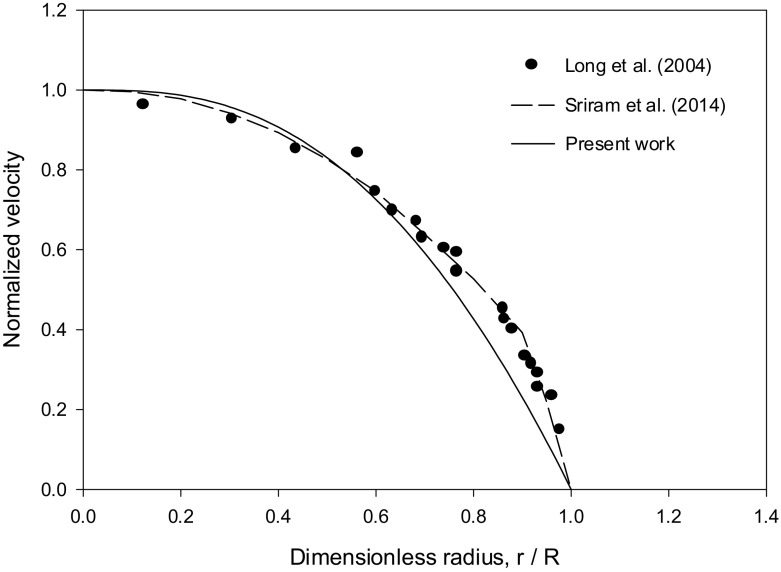
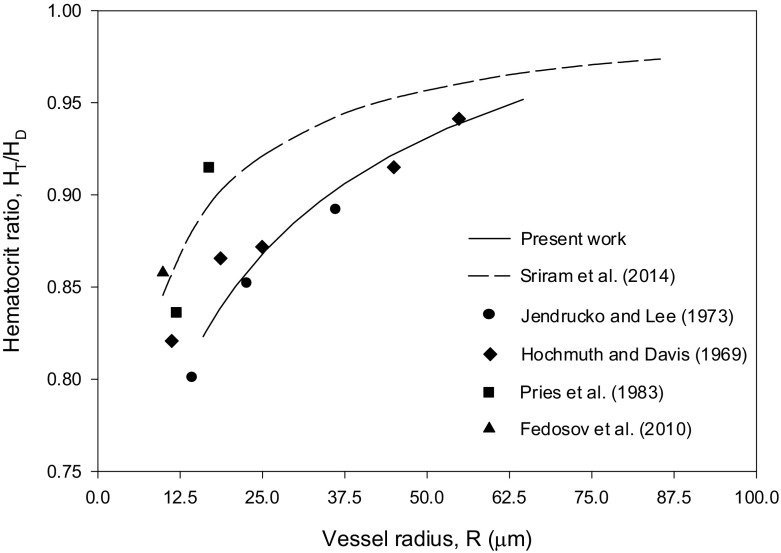
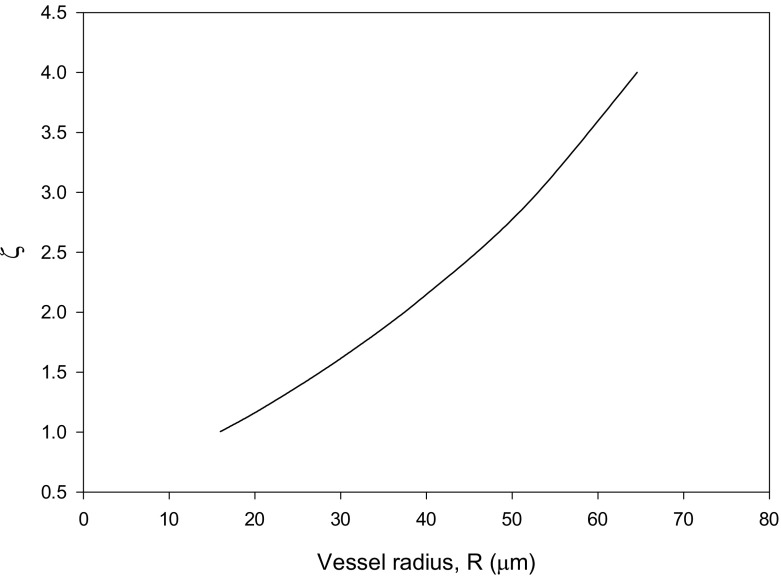
Sriram et al. [12] compared their results for the velocity profile with the experimental data of Long et al. [27] for HD = 0.335, pressure gradient = 3732 dyn/cm3 and R = 27.1 μm. The Krieger–Dougherty parameters used in the present work are n = 1.82 and Hm = 0.98. The velocity and hematocrit ratio profiles, shown in Figs. 3 (HD = 0.335) and 4 (HD = 0.405), are in favorable agreement with the experimental data in [28–31]. The values obtained for ζ show higher values at larger values of R as can be seen from Fig. 5.
Fig. 3.
Comparison of the normalized velocity profile results with the experimental data in [27] and the numerical results in [12] for the case HD = 0.335, pressure gradient = 3732 dyn/cm3 and R = 27.1 μm
Fig. 4.
Comparison of the hematocrit ratio results with the numerical results in [12] and the reported experimental data [27–31] for the case HD = 0.405
Fig. 5.
Results for ζ = Kμ/Kc versus vessel radius R for the case HD = 0.405
Conclusions
The shear-induced model for the migration of red blood cells of Phillips et al. [14], extending the model of Leighton and Acrivos [13], was used along with the Krieger–Dougherty model for blood viscosity [15] to solve for fully developed velocity and hematocrit profiles. The diffusion coefficients ratio for the viscosity gradient and particle collision frequency fluxes can be determined as a function of capillary diameter and discharge hematocrit using the data-fit correlation for apparent blood viscosity of Pries et al. [6]. The analytical expressions for the velocity and hematocrit profiles are consistent with the numerically determined values. In addition, the numerical results are in favorable agreement with published numerical results and experimental data for hematocrit and velocity profiles and hematocrit ratio. The present simulations do not detect the change in the slope of the velocity profile near the wall as seen from experimental data. This is apparently due to the fact that the model of Phillips et al. [14] does not capture the free RBC zone when using the Krieger–Dougherty model for blood viscosity. This point could be addressed in further investigations.
Compliance with ethical standards
Conflict of interest
The author declares that he has no conflicts of interest.
References
- 1.Fournier RL. Basic Transport Phenomena in Biomedical Engineering. Boca Raton: CRC Press; 2012. [Google Scholar]
- 2.Fåhraeus R. The suspension stability of blood. Physiol. Rev. 1929;9:241–274. doi: 10.1152/physrev.1929.9.2.241. [DOI] [Google Scholar]
- 3.Martini P, Pierach A, Scheryer E. Die Strömung des Blutes in engen Gefäβen. Eine Abweichung vom Poiseuille’schen Gesetz. Deutsches Archiv für klinische Medizin. 1930;169:212–222. [Google Scholar]
- 4.Fåhraeus R, Lindqvist T. The viscosity of the blood in narrow capillary tubes. Am. J. Phys. 1931;96:562–568. [Google Scholar]
- 5.Secomb TW, Pries AR. Blood viscosity in microvessels: experiment and theory. Comptes Rendus Physique. 2013;14:470–478. doi: 10.1016/j.crhy.2013.04.002. [DOI] [PMC free article] [PubMed] [Google Scholar]
- 6.Pries AR, Neuhaus D, Gaehtgens P. Blood viscosity in tube flow: dependence on diameter and hematocrit. Am. J. Phys. Heart Circ. Phys. 1992;263:H1770–H1778. doi: 10.1152/ajpheart.1992.263.6.H1770. [DOI] [PubMed] [Google Scholar]
- 7.Toksvang LN, Berg RMG. Using a classic paper by Robin Fåhraeus and Torsten Lindqvist to teach basic hemorheology. Adv. Physiol. Educ. 2013;37:129–133. doi: 10.1152/advan.00009.2013. [DOI] [PubMed] [Google Scholar]
- 8.Hund Samuel, Kameneva Marina, Antaki James. A Quasi-Mechanistic Mathematical Representation for Blood Viscosity. Fluids. 2017;2(1):10. doi: 10.3390/fluids2010010. [DOI] [Google Scholar]
- 9.Haynes RF. Physical basis of the dependence of blood viscosity on tube radius. Am. J. Physiol. 1960;198:1193–1200. doi: 10.1152/ajplegacy.1960.198.6.1193. [DOI] [PubMed] [Google Scholar]
- 10.Sharan M, Popel AS. A two-phase model for flow of blood in narrow tubes with increased effective viscosity near the wall. Biorheology. 2001;38:415–428. [PubMed] [Google Scholar]
- 11.Chebbi R. Dynamics of blood flow: modeling of the Fåhræus–Lindqvist effect. J. Biol. Phys. 2015;41(3):313–326. doi: 10.1007/s10867-015-9376-1. [DOI] [PMC free article] [PubMed] [Google Scholar]
- 12.Sriram K, Intaglietta M, Tartakovsky DM. Non-Newtonian flow of blood in arterioles: consequences for wall shear stress measurements. Microcirculation. 2014;21(7):628–639. doi: 10.1111/micc.12141. [DOI] [PMC free article] [PubMed] [Google Scholar]
- 13.Leighton DT, Acrivos A. The shear-induced migration of particles in concentrated suspension. J. Fluid Mech. 1987;181:415–439. doi: 10.1017/S0022112087002155. [DOI] [Google Scholar]
- 14.Phillips RJ, Armstrong RC, Brown RA. A constitutive equation for concentrated suspensions that accounts for shear-induced particle migration. Phys. Fluids. 1992;4:30–40. doi: 10.1063/1.858498. [DOI] [Google Scholar]
- 15.Krieger IM, Dougherty TJ. A mechanism to non-Newtonian flow in suspensions of rigid spheres. Trans. Soc. Rheol. 1959;3:137–152. doi: 10.1122/1.548848. [DOI] [Google Scholar]
- 16.Weert, K.V.: Numerical and Experimental Analysis of Shear-Induced Migration in Suspension Flow. A thesis for the degree of Master, Eindhoven University (2005).
- 17.Mansour MH, Bressloff NW, Shearman CP. Red blood cell migration in microvessels. Biorheology. 2010;47:73–93. doi: 10.3233/BIR-2010-0560. [DOI] [PubMed] [Google Scholar]
- 18.Quemada D. Rheology of concentrated disperse systems: a model for non-Newtonian shear viscosity in steady flows. Rheol. Acta. 1978;17:632–642. doi: 10.1007/BF01522036. [DOI] [Google Scholar]
- 19.Thurston GB. Viscoelasticity of human blood. Biophys. J. 1972;12(9):1205–1217. doi: 10.1016/S0006-3495(72)86156-3. [DOI] [PMC free article] [PubMed] [Google Scholar]
- 20.Moyers-Gonzalez MA, Owens RG. Mathematical modelling of the cell-depleted peripheral layer in the steady flow of blood in a tube. Biorheology. 2010;47(1):39–71. doi: 10.3233/BIR-2010-0558. [DOI] [PubMed] [Google Scholar]
- 21.Moyers-Gonzalez M, Owens RG, Fang J. A non-homogeneous constitutive model for human blood. Part 1. Model derivation and steady flow. J. Fluid Mech. 2008;617:327–354. doi: 10.1017/S002211200800428X. [DOI] [Google Scholar]
- 22.Dimakopoulos Y, Kelesidis G, Tsouka S, Georgiou GC, Tsamopoulos J. Hemodynamics in stenotic vessels of small diameter under steady state conditions: effect of viscoelasticity and migration of red blood cells. Biorheology. 2015;52(3):183–210. doi: 10.3233/BIR-14033. [DOI] [PubMed] [Google Scholar]
- 23.Mavrantzas VG, Beris AN. Modelling the rheology and the flow-induced concentration changes in polymer solutions. Phys. Rev. Lett. 1992;69:273–276. doi: 10.1103/PhysRevLett.69.273. [DOI] [PubMed] [Google Scholar]
- 24.Tsouka S, Dimakopoulos Y, Mavrantzas V, Tsamopoulos J. Stress-gradient induced migration of polymers in corrugated channels. J. Rheol. 2014;58(4):911–947. doi: 10.1122/1.4880245. [DOI] [Google Scholar]
- 25.Roselli RJ, Diller R. Biotransport: Principles and Applications. New York: Springer; 2011. [Google Scholar]
- 26.Bird RB, Stewart WE, Lightfoot EN. Transport Phenomena. New York: John Wiley; 2007. [Google Scholar]
- 27.Long DS, Smith ML, Pries AR, Ley K, Damiano ER. Microviscometry reveals reduced blood viscosity and altered shear rate and shear stress profiles in microvessels after hemodilution. Proc. Natl. Acad. Sci. U. S. A. 2004;101:10060–10065. doi: 10.1073/pnas.0402937101. [DOI] [PMC free article] [PubMed] [Google Scholar]
- 28.Fedosov DA, Caswell B, Popel AS, Karniadakis GE. Blood flow and cell-free layer in microvessels. Microcirculation. 2010;17(8):615–628. doi: 10.1111/j.1549-8719.2010.00056.x. [DOI] [PMC free article] [PubMed] [Google Scholar]
- 29.Hochmuth RM, Davis DO. Changes in hematocrit for blood flow in narrow tubes. Bibl. Anat. 1969;10:59–65. [PubMed] [Google Scholar]
- 30.Jendrucko RJ, Lee JS. The measurement of hematocrit of blood flowing in glass capillaries by microphotometry. Microvasc. Res. 1973;6(3):316–331. doi: 10.1016/0026-2862(73)90080-0. [DOI] [PubMed] [Google Scholar]
- 31.Pries AR, Kanzow G, Gaehtgens P. Microphotometric determination of hematocrit in small vessels. Am. J. Physiol. Heart Circ. Physiol. 1983;245(1):H167–H177. doi: 10.1152/ajpheart.1983.245.1.H167. [DOI] [PubMed] [Google Scholar]


