Abstract
When nanoparticles are introduced into a physiological environment, proteins and lipids immediately cover their surface, forming a protein “corona”. It is well recognized that the corona structure influences the biological response of the body. Two deterministic models for corona formation of the human blood serum proteins around a single nanoparticle are presented and studied numerically in this paper. One of them is based on a coupled system of PDEs and involves diffusion of proteins toward the nanoparticle surface. The other one is described by ODEs and is a limit version of the first model as the protein diffusivity tends to infinity. The protein diffusivity influence on the temporal corona structure is studied in detail. Results are presented using figures and discussion.
Keywords: Nanoparticle, Protein binding, Protein corona, Nanotoxicity
Introduction
Nano-sized materials are widely used in a variety of biomedical applications ranging from cellular imaging to drug and vaccine delivery [1, 2]. Upon intravenous injection, numerous blood plasma proteins and lipids immediately begin competitive adsorption on the surface of nanoparticles. It is well documented that the most abundant and highly mobile but weakly adsorbing proteins adsorb on the particle surface in the initial stage. However, over time, by series of adsorption and displacement steps they will be replaced by strongly adsorbing proteins [3–6]. Competitive protein adsorption from blood plasma (or another multicomponent solution) onto the surface of nanoparticles depends on different factors such as protein concentrations, their chemical structure and charge, the temperature, and the pH [7, 8]. The adsorbed proteins and lipids form a so-called protein “corona”, whose composition depends on physico-chemical characteristics of the nanoparticles (shape, size, curvature, surface charge, hydrophobicity, hydrophilicity) [9–12] and proteins and varies over time. The protein corona alters these physico-chemical characteristics of nanoparticles and thereby forms a new biological identity that determines the physiological cellular response, including kinetics, transport, accumulation, circulation lifetime, cellular uptake, toxicity, and biodistribution of nanoparticles throughout the body [1, 13]. Thus, a deep understanding of the protein corona formation process is key in studying the biological effects of nanoparticles [4]. Numerous papers and reviews are devoted to the experimental and theoretical study of possible driving forces in the corona formation process and their modeling. The eventual goal of these studies is to predict the composition of proteins in the corona, depending on their composition in the given multicomponent solution [14]. We will mention reviews [1, 14] and some recent papers devoted to experimental study and computer simulations. Two mathematically simple corona formation models described by systems of ordinary differential equations (ODE) with experimentally measured kinetic rate constants have been proposed in [15, 16]. Recent studies revealed that protein adsorption on the surface of nanoparticles is mostly driven by global electrostatic and local hydrophobic–hydrophilic interactions (see [8] and literature therein). Models [15, 16] are based on the mass action law and the Langmuir approach, respectively, and neglect the electrostatic protein–protein interaction, hydrophobic–hydrophilic effects of the surface, and volume changes during adsorption [8].
In [17], the diffusion-controlled protein binding to negatively charged colloidal particles is modeled by employing a two-step Langmuir approach where the protein diffusion region is divided into two subregions: (i) a layer between the nanoparticle, and a sphere of an overall hydrodynamic radius and (ii) an external bulk diffusion subregion. However, the protein diffusion equations are not incorporated into this model. The protein adsorption rate constant is modeled as a function of the protein bulk diffusivity in the external subregion and its internal diffusivity. The latter is an unknown parameter.
A model accounting for the deformation of semipermanently adsorbed proteins has been proposed in [18]. Authors of [7, 8] demonstrated that in the case of adsorption equilibrium, the electrostatic cooperativity and hydrophobic effects and volume changes can be introduced into standard Langmuir adsorption models using the Guoy–Chapman–Stern theory [19–21] for charged molecules binding to charged surfaces. This approach and that used in [15–17] are based on the continuum description. To describe the electrostatic protein–protein and protein–nanoparticle interaction directly, computer simulations based on the Langevin equation [22, 23] and a coarse-grained approach [7, 8, 24, 25] have been developed. The conformational changes of fibrinogen adsorption from “lying down” to “standing up” have also been included into model [24] describing the ternary protein mixture interaction with a hydrophobic surface. However, the coarse-grained approach allows us to perform simulations for binary and ternary protein solutions up to 10 s. In paper [25], a model based on the mass action law with kinetic coefficients depending on each protein surface coverage and concentration of nanoparticles and proteins has been proposed for large time scales.
In [15–17], the protein corona formation around a set of copolymer nanoparticles and its dynamics have been studied assuming that protein molecules and nanoparticles at every moment are distributed homogeneously in the space. This means that protein molecules diffuse to nanoparticles at an infinite rate. In models [15, 16], the protein molecules have been modeled as rigid spheres with the adsorption sites number dependent on the protein kind. However, these two models do not allow us to determine the fraction of the surface of the given nanoparticle covered by molecules of the specific protein, i.e., they do not allow to determine the corona structure of the given nanoparticle directly. The approach used in these studies also does not allow one to study the diffusion of the corona–nanoparticle complexes.
In the present paper, neglecting the hydrophobicity–hydrophilicity of the nanoparticle surface and volume changes and surface diffusion of the adsorbed protein molecules, we present and study a model of the protein corona formation around a single nanoparticle using the continuum approach. To do this, we extend the model [16] by incorporating protein diffusion equations and study the diffusion influence on concentrations of the adsorbed proteins onto the surface of a single copolymer nanoparticle. The model is described by a coupled system of partial and ordinary differential equations and directly accounts for the bulk diffusion of the protein molecules from a given region toward the nanoparticle. The protein–protein interaction has been included into equations indirectly (via the protein concentration-dependent diffusion rate). We account for the electrostatic protein interaction with the nanoparticle surface by experimentally measured adsorption rate constants that are given in [15]. To compare our results determined by the model for a single nanoparticle with those given in [15, 16] for a mixture of nanoparticles and some kinds of proteins and to obtain results for very large (practically infinite) diffusivity, we derive and solve the other model mathematical equations, which are analogous to those proposed in [16]. This second model, as well those given in [15, 16], are described by ODEs. It is derived from the first one by using an averaging procedure and corresponds to the first model with the infinite diffusion rate.
The plan of this paper is as follows. In Section 2, we describe the models. In Section 3, we discuss numerical results, and concluding remarks are found in Section 4.
The models
In this section, we present two models for the corona formation of proteins Pi, i = 1, … , n, around a single nanoparticle. One of them is described by a coupled system of partial and ordinary differential equations (below referred to as the PDE model) while the other one is composed of ODEs (referred to as the ODE model).
We first study the PDE model. For simplicity, we model protein Pi molecules as rigid spheres of radius ri, i = 1, … , m, and assume that molecules of all proteins Pi are delivered in the domain lying between the spherical nanoparticle of radius rc and the outer concentric sphere of radius re. In what follows, we study the case of spherical symmetry. We denote pi(t, r) and ui(t, r) concentrations of free and bound to the nanoparticle molecules of protein Pi, i = 1, … , m, respectively, at time t and position r. Following [15], we define the number of adsorption sites for protein Pi molecules on the nanoparticle surface by . Then, is the density of the adsorption sites for protein Pi molecules. We use Fick’s law with concentration-dependent diffusivity for the diffusion description of protein Pi, i = 1, … , m, molecules toward the nanoparticle surface and the law of mass to obtain the PDE model:
| 1 |
Here, , pi0(r) is the initial concentration, ki and k−i are the adsorption and desorption rate constants, κia(p1, p2, p3), κi = const, is the protein diffusivity, is the concentration of the occupied adsorption sites for Pi molecules, i = 1, … , m, is a surface coverage. Model (1) possesses m mass conservation laws:
| 2 |
Next, we integrate differential equations of system (1) over the 3D domain and use the boundary conditions and definition of the average function yielding the following ODE model:
| 3 |
where the prime denotes the derivative with respect to time and:
with i = 1, … , m. This model also possesses m mass conservation laws:
| 4 |
which enable us to reduce system (3) to the equations for ui:
| 5 |
where i = 1, … , m. System (5) is formally analogous to (23) proposed in [16] and differs from them by the multiplier ηi. The essential difference is that the ui in (5) is the surface density of the adsorbed protein molecules while (23) in [16] describe the evolution of the bulk concentrations of the adsorbed protein particles. Note that systems (3) and (5) do not depend on the protein diffusivity.
In the steady-state case, from system (1) it follows that pi and ui are some constants. Let and . In the case where pi0 = const, from (2) and (1)5 we find:
| 6 |
where i = 1, … , m and x∗ ∈ (0, 1) is a unique positive root of the equation:
| 7 |
The same result follows from (5). We observe that and do not depend on the protein diffusivity κi.
Using the dimensionless variables , , , , , , , , , , , , , , , where i = 1, … , m and τ = 1 s, rc measured in nm, p∗ = 10− 5 M with M = 6.022 ⋅ 1020 cm− 3 are the characteristic dimensional units, we rewrite (1) in the form:
| 8 |
with i = 1, … , m and the overbar on the quantities is omitted for simplicity.
Similarly, we derive the dimensionless form of system (3) with renamed by pi:
| 9 |
where ηi = 3(1 + ri)2/ ((re − ri)3 − (1 + ri)3), i = 1, … , m. The dimensionless equations (4)–(7) are:
| 10 |
| 11 |
| 12 |
| 13 |
where i = 1, … , m.
Numerical results
We follow [15, 16] and perform calculations for high-density lipoprotein (HDL), human serum albumin (HSA), and fibrinogen (Fib). Let P1, P2, and P3 be the HDL, HSA, and Fib. Our selection of parameters for simulations was motivated by values available in the literature. We use the experimentally measured adsorption and desorption rate constants, radii of proteins and nanoparticles, and initial concentrations of proteins given in Table 1 of [15]: rc = 35 nm, r1 = 5 nm, r2 = 4 nm, r3 = 8.3 nm, p10 = 1.5 ⋅ 10− 5 M, p20 = 6 ⋅ 10− 4 M, p30 = 8.8 ⋅ 10− 6 M, k1 = 3 ⋅ 104 M− 1s− 1, k2 = 2.4 ⋅ 103 M− 1s− 1, k3 = 2 ⋅ 103 M− 1s− 1, k− 1 = 3 ⋅ 10− 5 s− 1, k− 2 = k− 3 = 2 ⋅ 10− 5 s− 1. For diffusivity of all proteins, we use model values from a broad range to allow illustration of various regimes possible in the body.
Equation (8) was solved by using a conservative difference scheme [26] that preserves the discrete analogue of mass conservation laws (2). The validation of our simulations was also performed by comparing our results with those given in [15, 16]. To solve (10) or (13), we apply MATLAB solver ode45 [27, 28]. To find we first determine x∗ from (12) and then by (11) calculate , i = 1, 2, 3. Numerical results are presented in Figs. 1, 2, 3, 4, 5, and 6 in nondimensional form.
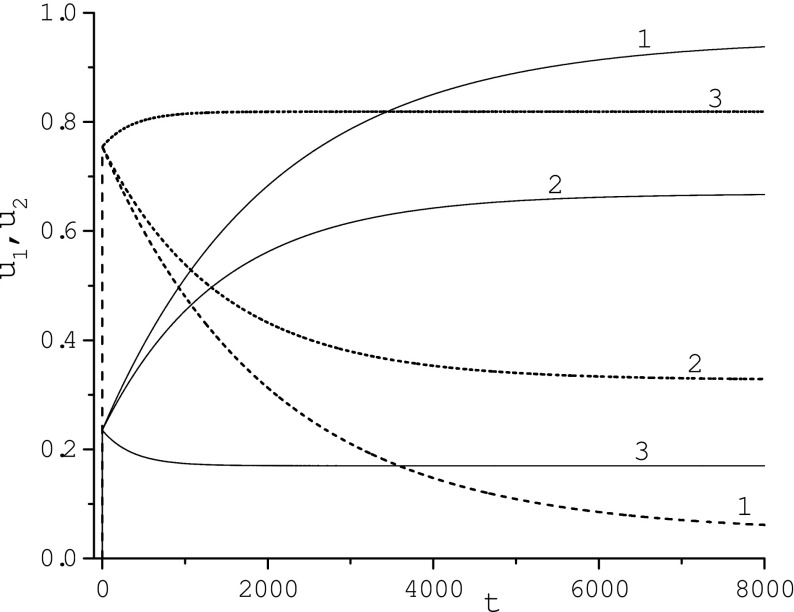
Fig. 1.
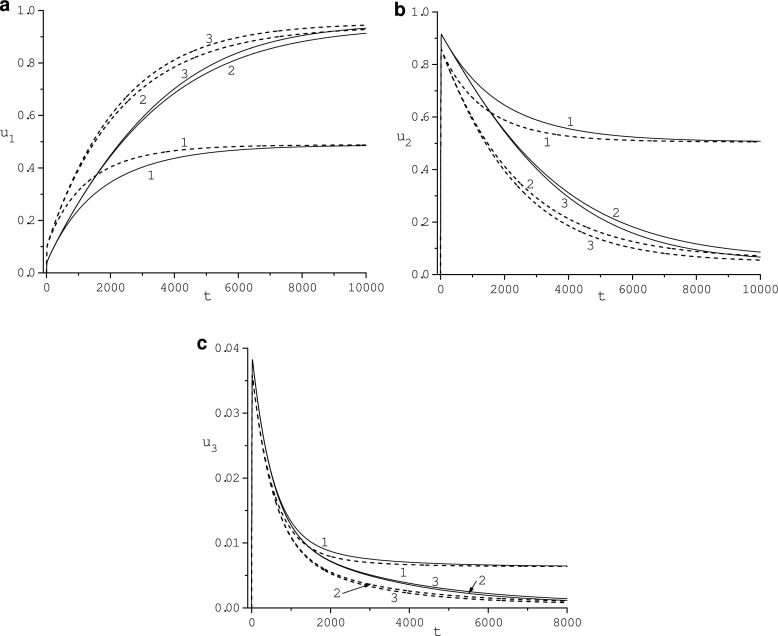
Effect of the outer sphere radius re: 4 (1), 8 (2), 16 (3), on the adsorbed protein concentrations ui, i = 1, 2, 3, for κ1 = κ2 = κ3 = 1 (solid line) and κ1 = 5, κ2 = κ3 = 1 (dashed line)
Fig. 2.
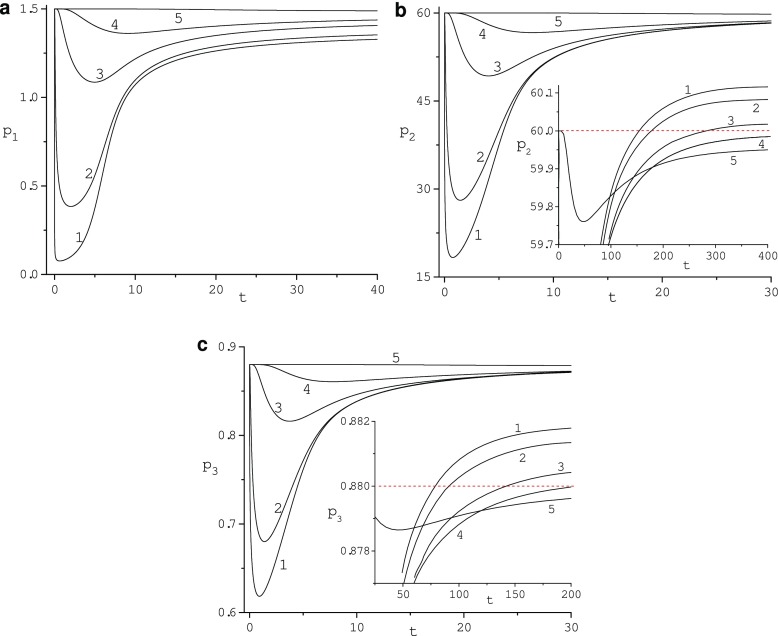
Evolution of the adsorption region size for diffusivity κ = 10 and re = 16. Values of radius r: 1 (1), 1.2 (2), 2 (3), 3 (4), 7 (5)
Fig. 3.
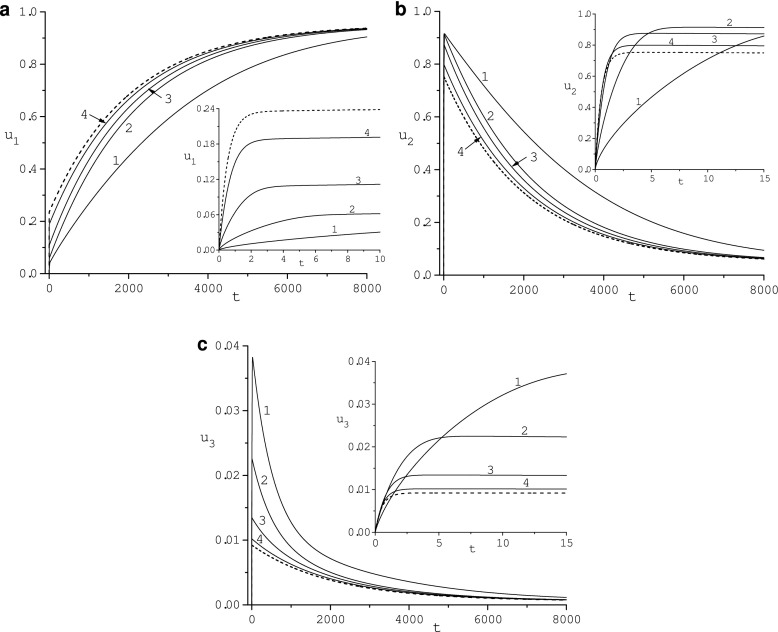
Dependence of the adsorbed protein concentrations ui, i = 1, 2, 3, on diffusivity κ: 1 (1), 10 (2), 100 (3), 1000 (4) for re = 16. Dashed lines correspond to ui, i = 1, 2, 3, determined by the ODE model (13)
Fig. 4.
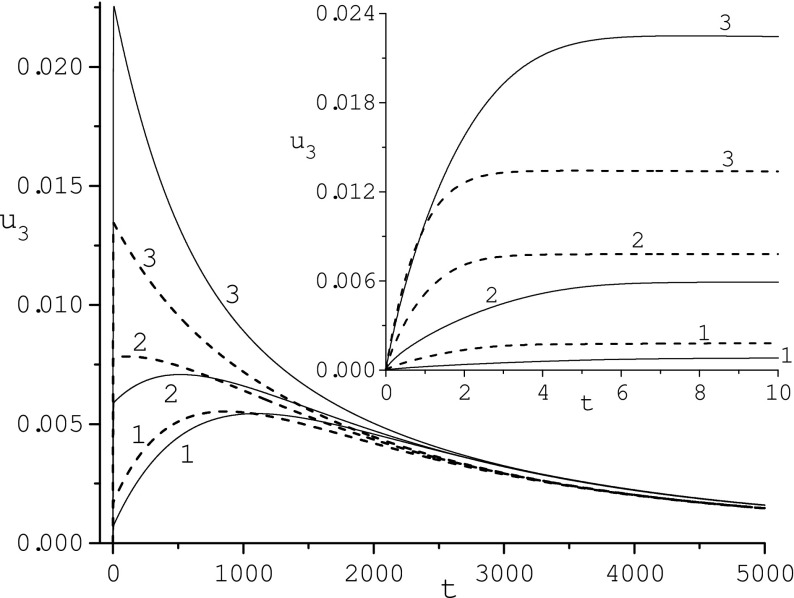
Influence of radius r3: 0.01954 (1), 0.06453 (2), 0.2371 (3), on the adsorbed protein concentration u3 for κ = 10 (solid line) and κ = 100 (dashed line)
Fig. 5.
Time profiles of the adsorbed protein concentrations u1 (solid line) and u2 (dashed line) determined by the ODE model (13) for k− 1: 3 ⋅ 10− 5 (1), 3 ⋅ 10− 4 (2), 3 ⋅ 10− 3 (3)
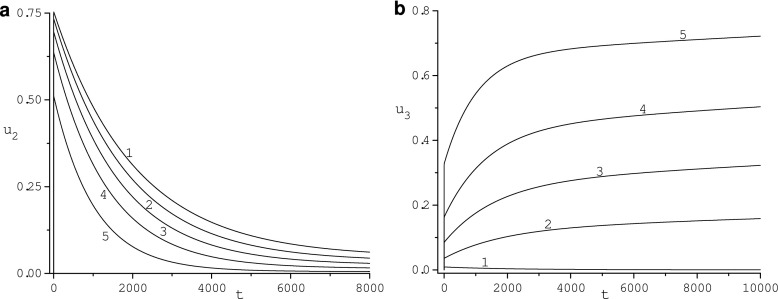
Fig. 6.
Influence of the fibrinogen adsorption rate constants k3, k− 3 and its initial concentration p30 on the adsorbed HSA and fibrinogen concentrations u2 and u3, respectively, determined at re = 16 by the ODE model (13) for k3 = 0.02, p30 = 0.88, k− 3 = 2 ⋅ 10− 3 (1); k3 = 0.08, p30 = 0.88 (2), k3 = 0.2, p30 = 0.88 (3), k3 = 0.08, p30 = 4.6 (4), k3 = 0.2, p30 = 4.6 (5) with k− 3 = 2 ⋅ 10− 6
In Fig. 1, the influence of the volume size, (4π/3) ((re − ri)3 − (rc − ri)3), on the behavior of concentrations u1 (Fig. 1a), u2 (Fig. 1b), u3 (Fig. 1c) of adsorbed protein Pi, i = 1, 2, 3, molecules is illustrated for re = 4,8,16 and κ := κ1 = κ2 = κ3 = 1 (solid lines) and κ1 = 5, κ2 = κ3 = 1 (dashed line). We observe a very significant influence of the variation of radius re ∈ [4, 16]: HDL concentration, u1, grows as re increases while concentrations of HSA and Fib, u2 and u3, decrease. All curves saturate at re = 16. The thickness of the diffusion layer corresponding to this value of the re is about 5–8 hydrodynamic diameters of the fibrinogen molecule. Diffusivity κ1 also strongly influences the behavior of concentrations of adsorbed protein molecules: u1 grows while both u2 and u3 decrease as κ1 increases. Function u1(t) monotonically increases over time to the asymptotic value determined by (11). Concentrations u2(t) and u3(t) grow rapidly, reach maximum values, and then slowly decrease toward appropriate steady-state values , i = 1, 2, dependent on re and ri but independent of diffusivity κi, i = 1, 2, 3. Values maxu2 = 0.915 and maxu3 = 0.0382 achieved at t = 25 and t = 21, respectively, for κi = 1, i = 1, 2, 3, do not depend on re. Values maxu2 = 0.858 and maxu3 = 0.0358 achieved at t = 21 and t = 19, respectively, for κ1 = 5, κ2 = κ3 = 1 are also independent of re. Concentrations u1(t), u2(t) and u3(t) for t ∈ [0, 600] practically do not depend on re but for large t the influence of re is perceptible. Asymptotic values of ui, i = 1, 2, 3, are diffusivity-independent but depend on re: , , .
In Fig. 2, the evolution of the adsorption region size is illustrated for diffusivity κ = 10. The depth of this region is about 6 radii of the nanoparticle. For κ = 1 its depth is about 4 of these radii. For κ = 10 concentrations p1, p2 and p3 achieve minimum values 0.076, 18.33, and 0.618 at the nanoparticle surface (r = 1) and t = 0.65, t = 0.765, t = 0.915, respectively. For κ = 1, minimum values of these concentrations are 0.016, 4.829, 0.279 at t = 2.74, t = 2.82, t = 3.4, respectively. For κ = 1 and large time (t ≥ 476.9 for p2 and t ≥ 147.5 for p3), concentrations p2 and p3 exceed their initial values. Maximum values of p2 and p3 are 60.75 and 0.902 at t = 2000 and t = 401.36. For κ = 10 concentrations p2 and p3 exceed their initial values at t ≥ 154.3 s and t ≥ 80.54. Maximum values of p2 and p3 are 60.115 and 0.882 at t = 440.35 and t = 225.28, respectively. Our simulations show that concentrations determined by the ODE model do not exhibit this excess and minp2(t) = 59.95, minp3(t) = 0.8798 while the HDL concentration monotonically decreases to the steady-state value. Thus, the phenomenon of the increase of protein concentrations for large time going toward the nanoparticle surface is caused by the diffusion of proteins and controlled by values of their diffusivity.
In Fig. 3, the dependence of the HDL, HSA, and Fib concentrations, u1 (Fig. 3a), u2 (Fig. 3b), u3 (Fig. 3c), on diffusivity κ is illustrated. Concentration u1(t) increases as κ grows. Concentration u1(t) converges as κ grows from below to u1(t) determined by the ODE model. For large κ and small time, u1(t) grows rapidly. Concentrations u2(t) and u3(t) decrease as κ increases and converge from above to a respective concentration determined by the ODE model. Functions u2(t) and u3(t) rapidly grow as time increases, reach maximum values, and then slowly decrease to the respective steady-state value , i = 1, 2, independently of the diffusivity. The maximum values of u2(t) and u3(t) depend on the diffusivity κ and decrease with κ increasing. The time position of the maximum value of u2(t) and u3(t) decreases with κ growing.
Fibrinogen is an elongated protein molecule that might bind to the surface of the nanoparticle with its short end thereby increasing the density of adsorption sites for P3 [15]. Following [15], we studied the effect of radius r3 variation on the evolution of concentrations ui(t), i = 1, 2, 3. The behavior of u3(t) is illustrated in Fig. 4 for r3 = 0.01954, 0.06453, 0.2371 and two diffusivity values (κ = 10 and 100). These values of r3 correspond to N3(0.06453)/N3(0.2371) = 10 and N3(0.01954)/N3(0.2371) = 100. We can see that u3(t) grows with r3 increasing. The time location of max u3(t) decreases as r3 grows. In this figure, we also compare the effect of diffusivity κ at different values of r3. For r3 = 0.2371, the u3(t) determined for κ = 10 is larger than that corresponding to κ = 100. For r3 = 0.06453 and 0.01954, its evolution is mixed. For small time, the u3(t) determined for κ = 10 is smaller than concentration u3(t) corresponding to κ = 100 but for large time their behavior is opposite. Our calculations also reveal (not shown) that variation of r3 practically does not influence the evolution of concentrations u1(t) and u2(t). This is not surprising, because values of u3(t) are small in comparison with those of u1(t) and u2(t).
In Fig. 5, the influence of the variation of the desorption rate constants k− 1 on the corona structure determined by the ODE model is illustrated. u1(t) decreases as k− 1 grows while u2(t) and u3(t) increase. For sufficiently large k− 1 concentration u1(t) becomes the nonmonotonic function of time (reaches a maximum value and then decreases to a steady-state value). Concentration u2(t) increases and becomes the monotone function of time. Our calculations reveal (not shown) that the behavior of u3(t) is similar to that of u2(t). Calculations also show that for sufficiently small k− 2 concentrations u1(t) and u2(t) become nonmonotone and monotone time functions, respectively. Functions u1(t) and u2(t) are slightly sensitive to variation of k− 3 ∈ [2 ⋅ 10− 5, 2 ⋅ 10− 3] while u3(t) grows as k− 3 decreases and for sufficiently small k− 3 becomes the monotone time function.
Figure 6 illustrates the influence of the fibrinogen adsorption rate constants k3 and k− 3 and its initial concentration p30 on the corona temporal composition. Concentration of the adsorbed HSA, u2(t), decreases as the adsorption rate constant of fibrinogen, k3, or its initial concentration, p30, grows if other parameters are taken from Table 1 of [15]. Variation of the same parameters illustrates the monotonic increase of the fibrinogen concentration, u3(t). Simulations reveal (not shown) that the HDL concentration, u1(t), corresponding to parameters of third, fourth, and fifth curves of Fig. 6 grows, reaches maximum at t = 8546, 5883, 4560, respectively, and then slowly decreases to the corresponding steady-state value. At the initial stage, u2(t) is larger than u3(t) but over time, the adsorbed fibrinogen becomes prevailing. These results clearly demonstrate the Vroman effect.
Discussion
Despite various experiments, there is no general model for the description of competitive (or cooperative) protein adsorption onto particles and surfaces. The models based on the kinetic equations are useful for a qualitative description of the experimental data by fitting the rate constants [24]. The Langmuir approach with permanent adsorption/desorption rate constants or rates dependent on each protein surface coverage and concentration of nanoparticles describes only a single (monomolecular) layer of adsorbed molecules and does not include directly the mutual interaction of the adsorbed molecules and their interaction with molecules composing the multiple layers. To study the driving forces of competitive protein adsorption from a ternary mixture composed of HSA, fibrinogen (Fib), and immunoglobulin G (IgG) on a hydrophobic surface the molecular dynamics simulations were used in [24]. Simulations performed for concentrations 4.25 g dl− 1, 0.325 g dl− 1 and 1.25 g dl− 1 of HSA, fibrinogen, and immunoglobulin G, respectively, show that the Fib concentration monotonically increases over time and exceeds the HSA and IgG concentrations. Authors of [24] stressed that the monotonic growth of the fibrinogen concentration contradicts the experimental data according to which this function reaches a maximum and then slowly decreases to a steady-state value.
The competitive adsorption of proteins from a ternary mixture composed of HSA, IgG, and Fib at different plasma polymer surfaces representing a different surface charge and hydrophobicity was investigated in [29]. On PP-DACH, representing a positively charged hydrophilic surface, the Fib dominance was observed. On the negatively charged hydrophilic PP-AA surface, the initial corona was built up by HSA, but over time the Fib prevails over HSA and HDL. At the hydrophobic PP-HMDSO surface in the early stage, the dominating protein was HSA but for large time the IgG prevailed. Investigation [15] of the competitive adsorption of proteins from a mixture composed of HSA, HDL, and Fib (with geometric and kinetic data given in Table 1 of [15]) at 50:50, NIPAM/BAM copolymer nanoparticles reveal that at the initial stage the HSA was prevailing but over time the HDL wins against HSA. The influence of the Fib radius, r3, on the early corona composition studied in [15] shows that a decrease of the Fib size increases the Fib concentration, u3, in the corona. For r3 = 0.2371 and 0.06453, the HDL concentration, u1, is larger than that of Fib but for r3 = 0.01954 the Fib wins against the HDL in the early corona. Model [16] and the ODE model (13) with the same data as in [15] show that u1 is larger than u3 for all time. The different influence of the fibrinogen radius, r3, on the behavior of concentration u3(t) determined by [15] and models [16] and (13) lies in the difference of the models.
Results of [15] show that the temporal corona composition of a given nanoparticle strongly depends on the adsorption/desorption rate constants of each protein and initial protein concentrations. Simulations of [15] also reveal that using the same experimentally measured equilibrium affinity but different combinations of association and dissociation rate constants determines completely different corona composition in which HDL prevails over the HSA and Fib even in the early stage. Therefore, results based on the experimentally measured equilibrium affinity should be critically considered. Works [29] and [15] illustrate the Vroman effect very well and show that the corona structure (temporal and steady-state) essentially depends on the physico-chemical characteristics (shape, size, surface charge, hydrophobicity, hydrophilicity) of nanoparticles. Our results determined by the ODE model are fully consistent with those given in [16].
Conclusions
In this paper, two phenomenological models for protein–nanoparticle corona formation are proposed and studied numerically in the case of spherical symmetry. One of them (system (1)) is based on a coupled system of partial and ordinary differential equations. This model accounts for the particle–particle interaction indirectly (via protein concentration-dependent diffusion rates). The protein molecules interaction with the nanoparticle surface is also included indirectly (via experimentally measured adsorption/desorption rate constants given in Table 1 of paper [15]). The nanoparticle and protein molecules are modeled as rigid spheres. Protein conformational and volume changes during adsorption and hydrophobic/hydrophilic surface effects are neglected. The other model (system (3)), derived from the first one by using an averaging procedure, is analogous to that proposed in [16] and is used for comparison of our results with those given in [16]. The influence of the protein diffusivity and fibrinogen adsorption/desorption rate constants and its initial concentration on the temporal corona structure is studied. To conclude the paper, we summarize the main results:
-
(i)
the corona structure (transient and steady-state) depends on the size of the domain where proteins are located, but there exists a limit domain size (, d is about 15 radii of a nanoparticle) such that a practically does not affect the corona structure for all κ. For kinetic parameters and initial protein concentrations taken from Table 1 of [15] concentrations of HSA, u2(t) and Fib, u3(t), rapidly grow as time increases, achieve maximum values, and then slowly decrease to the steady-state values depending on . The maximum values do not depend on the domain size. The HDL concentration, u1(t), monotonically grows as time increases and tends to an asymptotic value dependent on .
-
(ii)
the transient corona structure depends on the diffusivity of all proteins. For the same parameters as in (i), it tends, as diffusivity increases, to the structure of the corona determined by the ODE model. Diffusivity reduces the maximum values of the HSA and Fib concentrations, u2(t) and u3(t) but does not affect the steady-state concentrations of all proteins that can be determined by formula (6) after solving simple equation (7).
Despite some shortcomings, we believe that the PDE model and modeling results can be useful in studying the layer of protein covering the surface of nanoparticles.
Acknowledgements
We are grateful to Drs. M. Galagudza and A. Myasnikov who drew our attention to the nanoparticle–protein corona formation problem and anonymous reviewers whose valuable suggestions helped to improve this paper.
Compliance with Ethical Standards
Competing interests
The authors declare that they have no competing interests.
References
- 1.Rahman M, Laurent S, Tawil N, Mahmoudi M. Protein–Nanoparticle Interaction, vol. 15. Berlin: Springer; 2013. [Google Scholar]
- 2.Fleisher CC, Payne CK. Nanoparticle–cell interactions: molecular structure of the protein corona and cellular outcomes. Acc. Hem. Res. 2014;47:2651–2659. doi: 10.1021/ar500190q. [DOI] [PMC free article] [PubMed] [Google Scholar]
- 3.Vroman L, Adams AL, Fisher GC, Munoz PC. Interaction of high molecular weight kininogen, factor XII, and fibrinogen in plasma at interfaces. Blood. 1980;55:156–159. [PubMed] [Google Scholar]
- 4.Cedervall T, Lynch I, Lindman S, Berggard T, Thulin E, Nilson H, Dawson KA, Linse S. Understanding the nanoparticle–protein corona using methods to quantify exchange rates and affinities of proteins for nanoparticles. Proc. Natl. Acad. Sci. USA. 2007;104:2050–2055. doi: 10.1073/pnas.0608582104. [DOI] [PMC free article] [PubMed] [Google Scholar]
- 5.Jung SY, Lim SM, Albertorio F, Kim G, Gurau MC, Yang RD, Holden MA, Cremer PS. The Vroman effect: a molecular level description of fibrinogen displacement. J. Am. Chem. Soc. 2003;125:12782–12786. doi: 10.1021/ja037263o. [DOI] [PubMed] [Google Scholar]
- 6.Noh H, Vogler EA. Volumetric interpretation of protein adsorption: competition from mixtures and the Vroman effect. Biomaterials. 2007;28:405–422. doi: 10.1016/j.biomaterials.2006.09.006. [DOI] [PMC free article] [PubMed] [Google Scholar]
- 7.Oberle M, Yigit C, Angioletti-Uberti S, Dzubiella J, Ballauff M. Competitive protein adsorption to soft polymeric layers: binary mixtures and comparison to theory. J. Phys. Chem. B. 2015;119:3250–3258. doi: 10.1021/jp5119986. [DOI] [PubMed] [Google Scholar]
- 8.Yigit C, Welsh N, Ballauff M, Dzubiella J. Protein sorption to charge microgels: characterizing binding isotherms and driving forces. Langmuir. 2012;28:14373–14385. doi: 10.1021/la303292z. [DOI] [PubMed] [Google Scholar]
- 9.Lundqvist M, Stigler J, Elia G, Lynch I, Cedervall T, Dawson KA. Nanoparticle size and surface properties determine the protein corona with possible implications for biological impacts. Proc. Natl. Acad. Sci. USA. 2008;105:14265–14270. doi: 10.1073/pnas.0805135105. [DOI] [PMC free article] [PubMed] [Google Scholar]
- 10.Lynch I, Dawson KA. Protein–nanoparticle interactions. Nano Today. 2008;3:40–47. doi: 10.1016/S1748-0132(08)70014-8. [DOI] [Google Scholar]
- 11.Lundqvict M, Stigler J, Cedervall T, Berggard T, Flanagan MB, Lynch I, Elia G, Dawson K. The evolution of the protein corona around nanoparticles: a test study. ACS Nano. 2011;5:7503–7509. doi: 10.1021/nn202458g. [DOI] [PubMed] [Google Scholar]
- 12.Mahmoudi M, Lynch I, Ejtehadi MR, Monopoli MP, Bombelli FB, Laurent S. Protein–nanoparticle interactions: opportunities and challenges. Chem. Rev. 2011;111:5610–5637. doi: 10.1021/cr100440g. [DOI] [PubMed] [Google Scholar]
- 13.Aggarwal P, Hall JB, McLeland CB, Dobrovolskaia MA, McNeil SE. Nanoparticle interaction with plasma proteins as it relates to particle biodistribution, biocompatibility and therapeutic efficacy. Adv. Drug. Deliver. Rev. 2009;61:428–437. doi: 10.1016/j.addr.2009.03.009. [DOI] [PMC free article] [PubMed] [Google Scholar]
- 14.Welsch N, Lu Y, Dzubiella J, Ballauff M. Adsorption of proteins to functional polymeric nanoparticles. Polymer. 2013;54:2835–2849. doi: 10.1016/j.polymer.2013.03.027. [DOI] [Google Scholar]
- 15.Dell’Orco D, Lundqvist M, Oslakovic C, Cedervall T, Linse S. Modelling the time evolution of the nanoparticle–protein corona in a body fluid. PLoS ONE. 2010;5:1–8. doi: 10.1371/journal.pone.0010949. [DOI] [PMC free article] [PubMed] [Google Scholar]
- 16.Sahneh FD, Scoglio C, Riviere J. Dynamics of nanoparticle–protein corona complex formation: analytical results from population balance equations. PLoS ONE. 2013;8:1–10. doi: 10.1371/journal.pone.0064690. [DOI] [PMC free article] [PubMed] [Google Scholar]
- 17.Welsch N, Dzubiella J, Graeber A, Ballauff M. Protein binding to soft polymer layers: a quantitative study by fluorescence spectroscopy. Soft Matter. 2012;8:12043–12052. doi: 10.1039/c2sm26798e. [DOI] [Google Scholar]
- 18.LeDuck CA, Vroman L, Leonard EF. A mathematical model for the Vroman effect. Ind. Eng. Chem. Res. 1995;34:3488–3495. doi: 10.1021/ie00037a037. [DOI] [Google Scholar]
- 19.Aveyard R, Haydon R. Introduction to the Principles of Surface Chemistry. Cambridge: Cambridge University Press; 1973. [Google Scholar]
- 20.Seelig J. Thermodynamics of lipid–peptide interactions. Biochem. Biophys. Acta. 2004;1666:40–50. doi: 10.1016/j.bbamem.2004.08.004. [DOI] [PubMed] [Google Scholar]
- 21.McLaughlin S. The electrostatic properties of membranes. Annu. Rev. Biophys. Chem. 1989;18:113–136. doi: 10.1146/annurev.bb.18.060189.000553. [DOI] [PubMed] [Google Scholar]
- 22.Ygit C, Heyda J, Ballauff M, Dzubiella J. Like-charged protein–polyelectrolyte complexation driven by charge patches. J. Chem. Phys. 2015;143:064905. doi: 10.1063/1.4928078. [DOI] [PubMed] [Google Scholar]
- 23.Yu S, Xu X, Yigit C, van der Giet M, Zidek W, Jankowski J, Dzubiella J, Ballauff M. Interaction of human serum albumin with short polyelectrolytes: a study by calorimetry and computer simulations. Soft Matter. 2015;11:4630–4639. doi: 10.1039/C5SM00687B. [DOI] [PubMed] [Google Scholar]
- 24.Vilaseca P, Dawson KA, Franzese G. Understanding and modulating the competitive surface-adsorption of proteins through coarse-grained molecular dynamics simulations. Soft Matter. 2013;9:6978–6985. doi: 10.1039/c3sm50220a. [DOI] [Google Scholar]
- 25.Vilanova O, Mittag JJ, Kelly PM, Milani S, Dawson KA, Radler JO, Franzese G. Understanding the kinetics of protein–nanoparticle corona formation. ACS Nano. 2016;10:10842–10850. doi: 10.1021/acsnano.6b04858. [DOI] [PMC free article] [PubMed] [Google Scholar]
- 26.Samarskii AA. The Theory of Difference Schemes. New York: Marcel Dekker; 2001. [Google Scholar]
- 27.Press WH, Teukolsky SA, Vetterling WT, Flannery BP. Numerical Recipes: The Art of Scientific Computing. 3. Cambridge: Cambridge University Press; 2007. [Google Scholar]
- 28.Shampine LF, Gladwell I, Thompson S, Beardah C. Solving ODEs with MATLAB. Cambridge: Cambridge University Press; 2003. [Google Scholar]
- 29.Lassen B, Malmsten M. Competitive protein adsorption at plasma polymer surfaces. J. Colloid Interface Sci. 1997;186:9–16. doi: 10.1006/jcis.1996.4529. [DOI] [PubMed] [Google Scholar]


