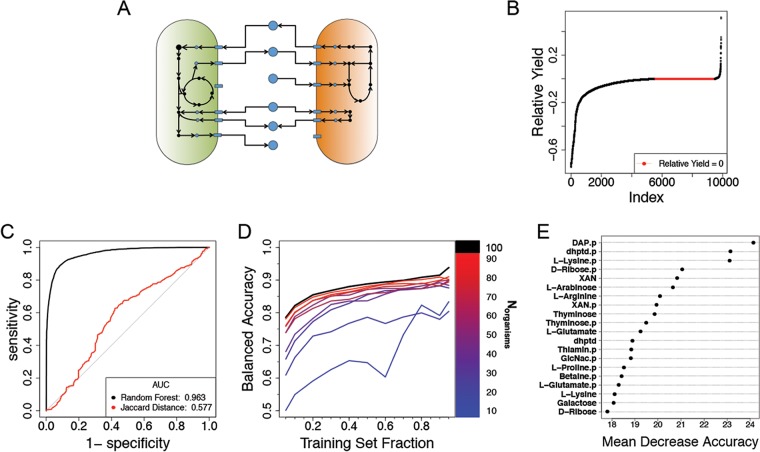
FIG 2.
Classification of pairwise interactions for an in silico model of a community of human gut microbes. (A) Organisms are represented in silico as large networks of metabolic reactions that take up metabolites (blue circles) from the environment (arrows leading to model) and release by-products (arrows leading to metabolite). Organisms may interact with one another during the simulation when both organisms compete for the uptake of a metabolite or through cross feeding, where one model consumes a by-product of the other. (B) Relative yields from all experiments are plotted in ascending order. There were 5,563 samples with a negative relative yield. Neutral interactions, a relative yield of zero, occurred 3,917 times, and positive relative yield occurred 420 times. Samples were classified as negative or nonnegative. (C) For all 9,900 in silico observations, the ROC curve of a random forest classifier was determined by using 388 exchange reactions as predictors and compared to the ROC curve obtained from using the Jaccard distance as a simple threshold to predict negative versus nonnegative relative yields. Values for the ROC curve were obtained by evaluating the class voting ratios on out-of-bag samples (see Materials and Methods). ROC curves for classifiers trained on subsets of the data can be seen in Fig. S3 in the supplemental material. (D) Learning curves for subcommunities of the full in silico community. These learning curves are the median learning curves evaluated with 10-fold cross-validation on test sets at each point (see Materials and Methods) for 5 subcommunities selected at random for each value of Norganisms. (E) A representation of the 20 most influential predictors as determined by mean decrease in accuracy. Labels on the y axis indicate the feature names. A “p” suffix in the label indicates that the predictor is a feature of the interaction partner; DAP, meso-2,6-diaminopimelate; dhptd, 4,5-dihydroxy-2,3-pentanedione; XAN, xanthine; GlcNac, N-acetylglucosamine. The results of an alternative representation scheme using phylogenies are presented in Fig. S5.

