Fig. 9.

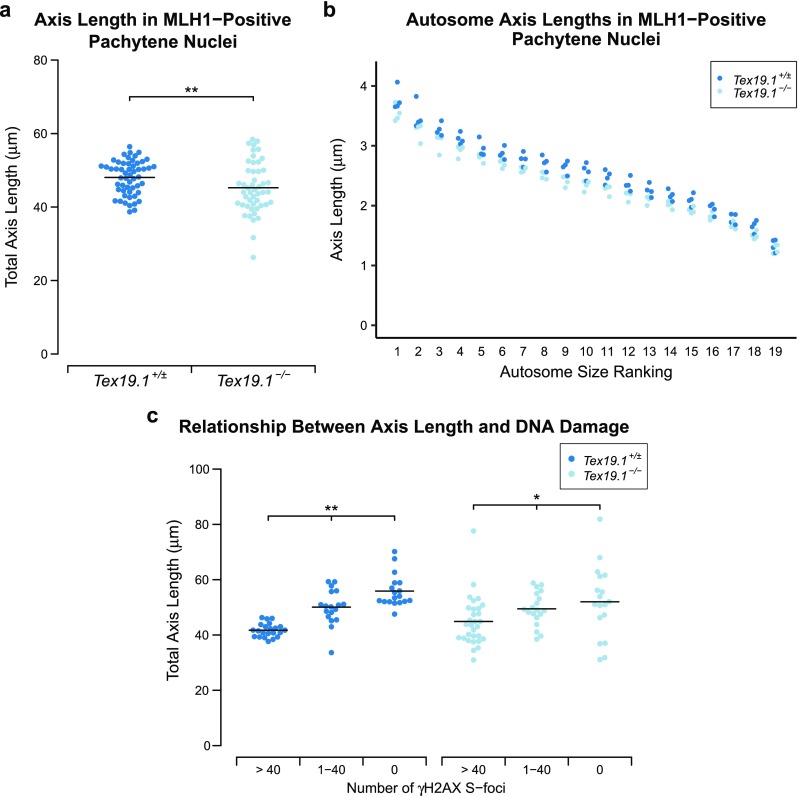
Axis elongation during pachytene is perturbed in autosomally synapsed pachytene Tex19.1−/− spermatocytes. a Quantification of chromosome axis length in MLH1-positive autosomally synapsed Tex19.1+/± and Tex19.1−/− pachytene spermatocytes. Axis length was measured from SYCP3 immunostaining of chromosome spreads. The total length of all 19 autosomes for individual nuclei is shown, and the mean values for each genotype (48.0 ± 4.6 and 45.2 ± 7.0 μm) are indicated with a horizontal line. A total of 54 and 49 nuclei from four Tex19.1+/± and Tex19.1−/− animals, respectively, were scored; ** indicates p < 0.01 (Mann-Whitney U test). b Axis lengths (μm) of individual size-ranked autosomes from MLH1-positive autosomally synapsed Tex19.1+/± and Tex19.1−/− pachytene spermatocytes shown in a. c Plot showing the relationship between γH2AX S-foci and axis elongation in autosomally synapsed Tex19.1+/± and Tex19.1−/− pachytene spermatocytes. Total axis lengths for individual nuclei belonging to the indicated categories of γH2AX S-foci are plotted. In contrast to a, these nuclei were not selected for being MLH1-positive. Means for each group are indicated by horizontal lines (41.7 ± 2.5, 50.1 ± 6.3, 55.9 ± 5.9, 44.9 ± 8.9, 49.5 ± 6.0 and 52.0 ± 12.9 μm from left to right, n = 22, 18, 18, 30, 19 and 18, respectively). Statistically significant differences between groups were determined by Mann-Whitney U test; ** indicates p < 0.01, * indicates p < 0.05. None of the comparisons between the Tex19.1+/± and Tex19.1−/− groups are significantly different. Nuclei were derived from three control animals and four Tex19.1−/− animals
