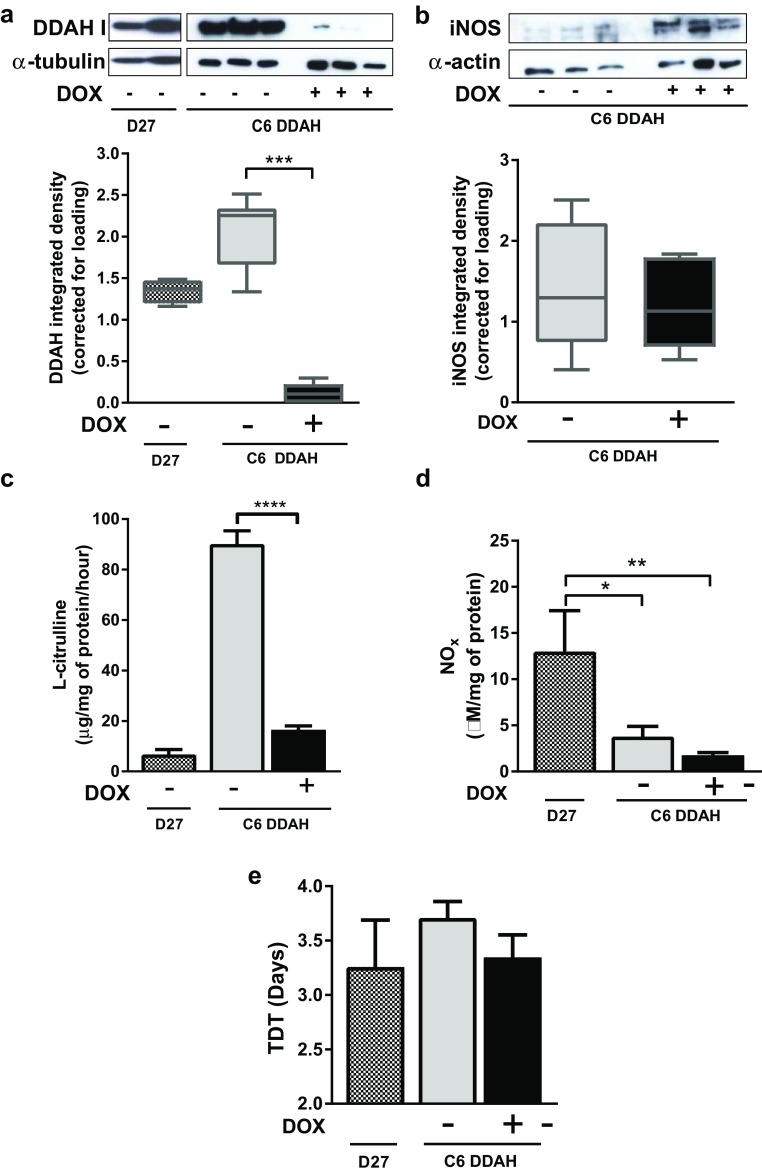
Fig. 2.
In vivo characterization of C6 DDAH tumour xenografts compared with D27 tumour xenografts. C6 DDAH cells were pre-treated with 2 µg/ml DOX in the medium for 5 days (group A). Mice with C6 DDAH tumours were given 0.2 mg/ml DOX in 5% (w/v) sucrose or 5% (w/v) sucrose alone (n = 6 per group) in the drinking water ad libitum. Mice with D27 (C6 constitutively DDAH overexpressing) tumours were given drinking water alone (n = 4). a, b Example western blots of tumour homogenates and mean box plot distributions of the integrated densities of the individual bands for DDAH I (a) and iNOS (b) corrected using α-tubulin and α-actin respectively. c l-citrulline production and (d) NOx production by tumours, determined from homogenates. e TDTs in days. Results are the mean + 1 SEM of measurements made from all tumours in each group (*P < 0.05, **P < 0.01, ***P < 0.001, ****P < 0.0001, One-Way ANOVA with Bonferroni’s multiple comparison post-test)

