

Abstract
Purpose
To evaluate whether patients with neurofibromatosis type 1 (NF1)—a multisystem neurodevelopmental disorder with myriad imaging manifestations, including focal transient myelin vacuolization within the deep gray nuclei, brainstem, and cerebellum—exhibit differences in cortical and subcortical structures, particularly in subcortical regions where these abnormalities manifest.
Materials and Methods
In this retrospective study, by using clinically obtained three-dimensional T1-weighted MR images and established image analysis methods, 10 intracranial volume–corrected subcortical and 34 cortical regions of interest (ROIs) were quantitatively assessed in 32 patients with NF1 and 245 age- and sex-matched healthy control subjects. By using linear models, ROI cortical thicknesses and volumes were compared between patients with NF1 and control subjects, as a function of age. With hierarchic cluster analysis and partial correlations, differences in the pattern of association between cortical and subcortical ROI volumes in patients with NF1 and control subjects were also evaluated.
Results
Patients with NF1 exhibited larger subcortical volumes and thicker cortices of select regions, particularly the hippocampi, amygdalae, cerebellar white matter, ventral diencephalon, thalami, and occipital cortices. For the thalami and pallida and 22 cortical ROIs in patients with NF1, a significant inverse association between volume and age was found, suggesting that volumes decrease with increasing age. Moreover, compared with those in control subjects, ROIs in patients with NF1 exhibited a distinct pattern of clustering and partial correlations.
Discussion
Neurofibromatosis type 1 is characterized by larger subcortical volumes and thicker cortices of select structures. Most apparent within the hippocampi, amygdalae, cerebellar white matter, ventral diencephalon, thalami and occipital cortices, these neurofibromatosis type 1–associated volumetric changes may, in part, be age dependent.
© RSNA, 2018
Introduction
Neurofibromatosis type 1 (NF1) is a neurocutaneous disorder that occurs in one in 2500 live births (50% inherited and 50% sporadic); it is caused by mutation of the NF1 gene on chromosome 17, resulting in an abnormal neurofibromin protein product (1). Because neurofibromin is an inhibitory protein in the AKT/P13K/mTOR signaling pathway, a critical growth pathway (2), neurofibromatosis is a multisystem disorder with myriad pathologic and clinical manifestations, ranging from nonhamartomatous myelin vacuolization and benign hamartomatous overgrowth to neoplasia and neurocognitive impairment (3). Other AKT/P13K/mTOR associated disorders, including hemimegalencephaly and tuberous sclerosis, are also characterized by cerebral overgrowth and hamartomas (4).
Focal T2 hyperintense brain lesions are a characteristic of NF1 and are predominantly located in the deep gray nuclei, brainstem, and cerebellar white matter. Attributed to myelin vacuolization (5), these lesions appear during the 1st decade of life and resolve by the end of the 2nd decade (6). Prior MRI-based studies have found volumetric differences between patients with NF1 and control subjects in several regions, including the hippocampus, thalamus, and visual cortex (7,8). Building on this work and using established morphometric MRI methods (9,10) we examined volumetric differences between patients with NF1 and age-matched control subjects across 34 cortical and 10 subcortical regions as a function of age. We additionally assessed whether the pattern of cortical thickness and subcortical brain volumes in patients with NF1 differed from that in control subjects.
Materials and Methods
With institutional review board approval, we (M.J.B., a radiology resident with 4 years of experience) performed a retrospective review of our clinical radiology database to search for MRI studies in patients with a diagnosis of NF1 who were younger than 22 years of age and who were imaged with GE MRI units (Fig 1). We excluded patients who had undergone prior neurosurgical intervention and studies with excessive motion or other artifacts. We evaluated 32 patients with a clinical diagnosis of NF1 (from UCSF) and 245 age-and sex-matched healthy control subjects from the Pediatric Imaging, Neurocognition, and Genetics (PING) database (11,12) (Table). For each patient with NF1, we (M.J.B.) reviewed associated medical records, including pediatric neurology assessments. Fourteen (44%) patients with NF1 had a clinical diagnosis of cognitive delay. One (3%) patient with NF1 had clinically diagnosed autism (Table). More detailed clinical information regarding neurocognitive status was not available for most of our cohort. Characteristic NF1 myelin vacuolization in the cerebellum or deep gray nuclei was present in six (18%) patients with NF1 on T2-weighted fluid-attenuated inversion recovery MR images and was minimal in extent. None of the PING control subjects exhibited cognitive delay or autism (12).
Figure 1:

Flowchart of the process of selection of patients with neurofibromatosis type 1 (NF1). PACS = picture archiving and communication system.
Demographic Data

*Data are numbers of patients or subjects, with percentages in parentheses.
We (M.J.B. and R.M.N., a research assistant with 2 years of experience) processed all subjects’ three-dimensional T1-weighted MRI studies using the Freesurfer software package, version 6.0 (Freesurfer Methods: https://surfer.nmr.mgh.harvard.edu/fswiki/FreeSurferMethodsCitation) (9) (Fig 2). The segmented volumes were visually assessed for accuracy (by M.J.B. and R.S.D., an attending neuroradiologist with 12 years of experience) using previously published methods (13). We (M.J.B., R.S.D., and A.J.B., an attending pediatric neuroradiologist with 34 years of experience) focused our volumetric analyses on 10 subcortical regions of interest (ROIs) (10) on the basis of the well-documented spatial distribution of characteristic myelin vacuolization in NF1—namely, cerebellar white matter, cerebellar cortex, thalamus, caudate, putamen, pallidum, hippocampus, amygdala, accumbens, and ventral diencephalon (a group of several anatomic structures including the hypothalamus and medial and lateral geniculate nuclei) and 34 cortical ROIs (13,14). None of the patients with NF1 had brain tumors involving these ROIs. We corrected for intracranial volume (ICV) and averaged ROIs between the right and left hemispheres. To facilitate comparison across regions, we expressed each ROI volume as a z-score.
Figure 2:
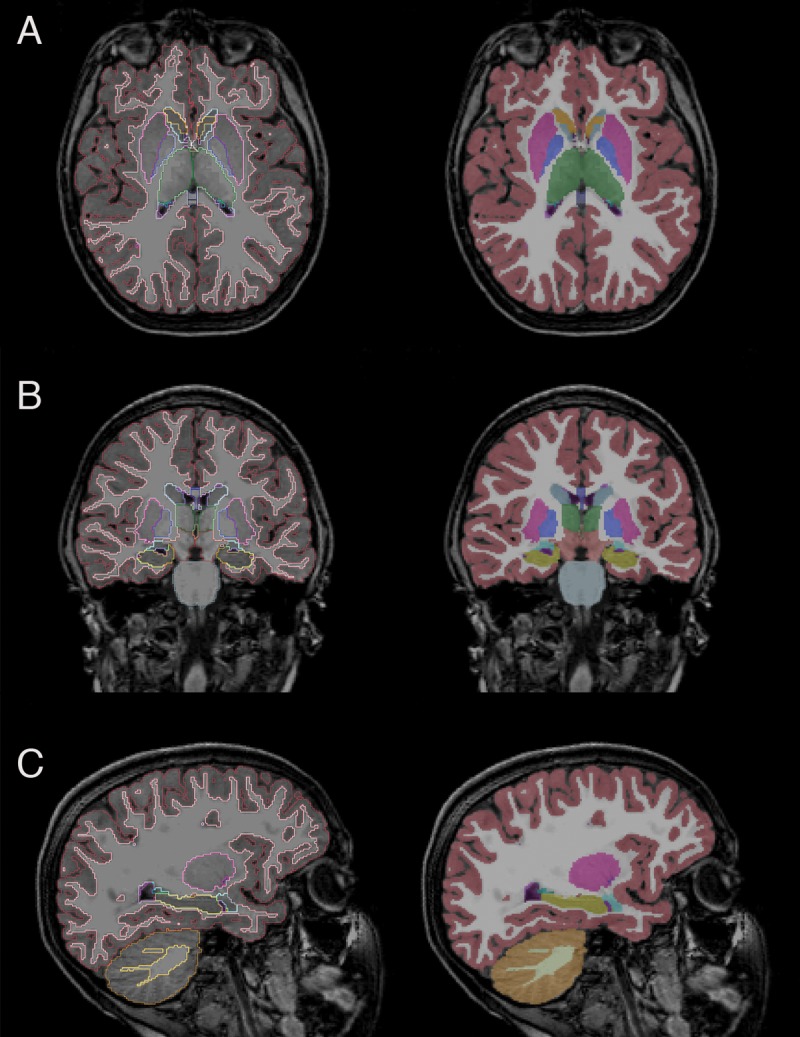
Representative, A, axial, B, coronal, and, C, sagittal images in the control cohort with overlaid subcortical segmentations. Green = thalamus, yellow = hippocampus, pink = putamen, aqua = caudate, light blue = amygdala, blue = pallidum.
We used linear models to evaluate differences between patients with NF1 and control subjects across the 10 subcortical and 34 cortical ROIs, including age and sex as covariates. To assess statistical significance for subcortical ROIs, we established an a priori Bonferroni-corrected P value of .005 (P = .05/10 ROIs) and a false-discovery rate (FDR)-corrected P value of .05 for cortical ROIs. We then evaluated these differences as a function of age by testing an age-by-diagnosis interaction using linear models with Bonferroni/FDR-corrected P values, while controlling for sex. Next, we evaluated differences in the clustering of subcortical and cortical ROIs between our NF1 and control cohorts. To determine the optimum number of clusters, we used a k-means algorithm (15) and an elbow plot (16) to group the individual ROI data into clusters on the basis of data similarity. We limited the maximum number of possible clusters (ie, k) in the data to 15 and plotted the graph of decreasing total within-clusters sums of squares as a function of increasing k. The location of the elbow in the plot is indicative of the appropriate number of clusters (k) in the data. We then ran hierarchic clustering conditioned on k clusters to visualize differences in subcortical and cortical ROI clustering patterns in patients with NF1 compared with control subjects. Finally, we used partial correlations to evaluate the association patterns between all subcortical ROI volumes and between cortical and subcortical ROI volumes, while controlling for age and sex in both patients and control subjects, visualizing the resulting correlation coefficients as a heat map. All analyses were performed in R 3.4.2.
Results
Subcortical Analysis
There were no differences in mean age or sex between patients with NF1 and control subjects (Table). According to our linear model, compared with control subjects, patients with NF1 have significantly larger ICV-corrected volumes of the pallida (β = 0.56, standard error [of the mean] = 0.18, P = 2.46 × 10⁻³), thalami (β = 1.44, standard error = 0.17, P = 3.38 × 10⁻¹⁶), hippocampi (β = 1.44, standard error = 0.16, P = 7.84 × 10⁻¹⁶), amygdalae (β = 1.02, standard error = 0.18, P = 1.96 × 10⁻⁸), ventral diencephalon (β = 1.65, standard error = 0.15, P = 9.06 × 10⁻²³), accumbens (β = 0.82, standard error = 0.16, P = 8.78 × 10⁻⁷), and cerebellar white matter (β = 1.43, standard error = 0.16, P = 4.51 × 10⁻¹⁷) (Table E1 [online]). The average normalized (z-scored) ICVs for each ROI in patients and control subjects, which also show these volumetric differences (Fig 3, A–J), are given in the Table. Testing for differences in volumes as a function of age and diagnosis, we found significant age-by-diagnosis interactions at a Bonferroni-corrected P value of .005 for the pallida (β = –0.17, standard error = 0.03, P = 6.62 × 10⁻⁸) and thalami (β = –0.11, standard error = 0.03, P = 1.37 × 10⁻⁴), but not for other regions (Fig 4, A–J; Table E1 [online]). Simple main-effects analyses revealed that older age was associated with smaller pallida volumes in patients with NF1 (β = –0.15, standard error = 0.03, P = 1.39 × 10⁻⁷) but not in control subjects (β = 0.02, standard error = 0.01, P = .12). For the thalami, older age was associated with smaller volumes in patients with NF1 (β = –0.08, standard error = 0.03, P = 2.30 × 10⁻³) but larger volumes in control subjects (β = 0.03, standard error = 0.01, P = 9.04 × 10⁻³).
Figure 3:

A–J, Boxplots show significantly larger volumes (*) of the, A, pallidum, B, thalamus, C, hippocampus, D, amygdala, E, ventral diencephalon, F, accumbens, and, G, cerebellar white matter (WM) but not of, H, the putamen, I, the cerebellar cortex (CTX), and, J, the caudate in patients with neurofibromatosis type 1 (NF1) relative to control subjects. Data on the y-axes are z-scores. K, Heat map of β values (in 23 cortical regions of interest with significant differences) from linear models comparing cortical thickness in patients with NF1 and control subjects painted on a pial surface rendering of the brain (from left to right: lateral, medial, dorsal, and ventral views).
Figure 4:

A–J, Scatterplots show differences in volumes (* = significant difference) of the, A, pallidum, B, thalamus, C, hippocampus, D, amygdala, E, ventral diencephalon, F, accumbens, G, cerebellar white matter (WM), H, putamen, I, cerebellar cortex (CTX), and, J, caudate as a function of age in patients with neurofibromatosis type 1 (NF1) relative to control subjects. Data on the y-axes are z-scores. K, L, Heat map of β values (in 22 cortical regions of interest with significant differences) from linear models evaluating age-by-diagnosis interactions in, K, patients with NF1 and, L, control subjects painted on a pial surface rendering of the brain (from left to right: lateral, medial, dorsal, and ventral views).
K-means analysis evaluated using the elbow method did not show a clear optimum number of clusters for patients with NF1 (Fig 5, A) and control subjects (Fig 5, B). Using an estimated cluster of five, hierarchic clustering analysis revealed different clustering patterns in patients with NF1 and control subjects. In patients with NF1, subcortical regions clustered as a function of magnitude of effects from the linear models; the five largest ROIs (Table) (ie, the hippocampus, amygdala, cerebellar white matter, ventral diencephalon, and thalamus) constituted a branch that was separate from the other regions (Fig 5, C). In control subjects, the subcortical regions clustered into known anatomic subdivisions such as the medial temporal lobe (hippocampus, amygdala) and cerebellum (cerebellar cortex and white matter) (Fig 5, D). Similarly, compared with control subjects, patients with NF1 exhibited a different pattern of partial correlations among the 10 ROIs (Fig 6, A and B), further illustrating the abnormal morphometry of select subcortical regions in NF1.
Figure 5:

A, B, Determination of the number of subcortical volume clusters in, A, patients with neurofibromatosis type 1 (NF1) and, B, control subjects by using a k-means algorithm. There are differences in patterns of subcortical volumes clustering between, C, patients with NF1 and, D, control subjects, showing clear clustering by known anatomic divisions in control subjects but not in patients with NF1. * = Regions with significant differences in size between patients and control subjects. E, F, Determination of the number of cortical thickness clusters in, E, patients with NF1 and, F, control subjects by using a k-means algorithm. G, H, Differences in patterns of cortical thickness clustering between, G, patients with NF1 and, H, control subjects. BSTS = banks of superior temporal sulcus, CACG = caudal anterior cingulate gyrus, CCtx = cerebellar cortex, CMFG = caudal middle frontal gyrus, CWM = cerebellar wh ite matter, DC = diencephalon, ICG = isthmus of cingulate gyrus, IPL = inferior parietal lobule, ITG = inferior temporal gyrus, LOC = lateral occipital cortex, LOFG = lateral orbitofrontal gyrus, MOFG = medial orbitofrontal gyrus, MTG = middle temporal gyrus, PCG = posterior cingulate gyrus, PHG = parahippocampal gyrus, RACG = rostral anterior cingulate gyrus, RMFG = rostral middle frontal gyrus, SFG = superior frontal gyrus, SMG = supramarginal gyrus, SPL = superior parietal lobule, STG = superior temporal gyrus, TTG = transverse temporal gyrus.
Figure 6:

A, B, Heat maps of partial correlation coefficients of all subcortical regions for, A, patients with neurofibromatosis type 1 (NF1) compared with, B, control subjects, controlling for age and sex, show associations between known anatomic divisions in control subjects but not in patients with NF1. C, D, Partial correlation coefficients of cortical and subcortical regions for, C, patients with NF1 compared with, D, control subjects. BSTS = banks of superior temporal sulcus, CACG = caudal anterior cingulate gyrus, CMFG = caudal middle frontal gyrus, DC = diencephalon, ICG = isthmus of cingulate gyrus, IPL = inferior parietal lobule, ITG = inferior temporal gyrus, LOC = lateral occipital cortex, LOFG = lateral orbitofrontal gyrus, MOFG = medial orbitofrontal gyrus, MTG = middle temporal gyrus, PCG = posterior cingulate gyrus, PHG = parahippocampal gyrus, RACG = rostral anterior cingulate gyrus, RMFG = rostral middle frontal gyrus, SFG = superior frontal gyrus, SMG = supramarginal gyrus, SPL = superior parietal lobule, STG = superior temporal gyrus, TTG = transverse temporal gyrus, WM = white matter.
Cortical Analysis
There were significant differences in cortical thickness between patients with NF1 and control subjects across 23 of the 34 cortical ROIs (Fig 3, K; Table E2 [online]). The pericalcarine cortex (β = 1.41, standard error = 0.14, P = 1.86 × 10⁻¹⁸), cuneus (β = 1.25, standard error = 0.13, P = 8.29 × 10⁻¹⁸), lingual gyrus (β = 0.85, standard error = 0.13, P = 8.80 × 10⁻¹⁰), and insula (β = 0.65, standard error = 0.14, P = 4.77 × 10⁻⁵) were all significantly thicker in patients with NF1 than in control subjects. The caudal middle frontal gyrus (β = –1.04, standard error = 0.16, P = 2.65 × 10⁻⁹), pars opercularis (β = –0.9, standard error = 0.16, P = 1.88 × 10⁻⁷), precentral gyrus (β = –0.81, standard error = 0.18, P = 4.77 × 10⁻⁵), and entorhinal cortex (β = –0.78, standard error = 0.18, P = 7.79 × 10⁻⁵) were all significantly thinner in patients with NF1 than in control subjects.
Testing for differences in cortical thickness as a function of age and diagnosis, we found significant age-by-diagnosis interactions at an FDR-corrected P value of .05 in 22 of the 34 cortical ROIs, including the superior parietal lobule (β = –0.14, standard error = 0.02, P = 9.82 × 10⁻⁷), postcentral gyrus (β = –0.12, standard error = 0.03, P = .000150), fusiform gyrus (β = –0.12, standard error = 0.03, P = .000200), and supramarginal gyrus (β = –0.1, standard error = 0.02, P = .000658) (Fig 4, K and L; Table E2 [online]). Simple main-effects analyses revealed that older age was associated with a thinner cortex in the superior parietal lobule to a greater degree in patients with NF1 (β = –0.24, standard error = 0.02, P = 2.72 × 10⁻²³) than in control subjects (β = –0.1, standard error = 0.01, P = 7.30 × 10⁻²²). For the postcentral gyrus, older age was also associated with a thinner cortex to a greater degree in patients with NF1 (β = –0.21, standard error = 0.02, P = 5.92 × 10⁻¹⁶) than in control subjects (β = –0.09, standard error = 0.01, P = 9.59 × 10⁻¹⁵).
K-means analysis performed by using the elbow method again did not show a clear optimum number of clusters for patients with NF1 (Fig 5, E) and control subjects (Fig 5, F). Using an estimated cluster of five, hierarchic clustering analysis revealed different clustering patterns in patients with NF1 and control subjects. In patients with NF1, cortical regions again clustered by strength of effect (largest β values for pericalcarine cortex, cuneus, and lingual gyrus) (Fig 5, G). In control subjects, the cortical regions again clustered largely by anatomic division (frontal, temporal, cingulum, etc) (Fig 5, H). Similarly, compared with control subjects, patients with NF1, according to visual inspection, had a different partial correlation pattern among the subcortical and cortical ROIs (Fig 6, C and D), with subjectively increased positive correlations between cortical thickness, cerebellar white matter, and amygdalae volumes and subjectively increased negative correlations between ventral diencephalon volume and cortical thickness in patients with NF1.
Discussion
We showed that patients with NF1 exhibit larger volumes of the hippocampi, amygdalae, cerebellar white matter, ventral diencephalon, and thalami, as well as thicker occipital and thinner frontal cortices. For the thalami and pallida, we found a statistical interaction with age suggesting that increased subcortical volumes may occur in younger (˂10 years of age) patients with NF1. The majority (65%) of cortical ROIs also showed significant age interactions in patients with NF1. Finally, patients with NF1 showed a different pattern of associations between cortical and subcortical structures compared with control subjects. Taken together, our findings support the hypothesis that NF1 is characterized by the abnormal morphology of select cortical and subcortical regions.
Consistent with clinical observations and expanding on prior morphometry studies (7,8), we found increased subcortical volumes of the accumbens, cerebellar white matter, and subcortical limbic system, including the pallida, thalami, amygdalae, and hippocampi—regions where the characteristic myelin vacuolization of NF1 is known to occur. We also found thicker occipital and thinner frontal cortices, again expanding on prior findings (7,17). Although the majority of patients with NF1 in our cohort did not have clinically apparent myelin vacuolization, they still had significantly increased ICV-corrected volumes in the regions characteristically associated with myelin vacuolization. This suggests that similar or related molecular mechanisms may contribute jointly to the regionally selective myelin vacuolization and volumetric increases seen with NF1. Alternatively, it is also possible that myelin vacuolization and volumetric increases represent the same biologic processes underlying NF1, manifesting differently on T1-weighted and T2-weighted MRI studies. We note that, even though our exclusion criteria (tumors, significant myelin vacuolization, history of prior resection) would limit the NF1 cohort to patients with a less severe clinical phenotype, our volumetric findings are unlikely to be restricted to those milder phenotypes because other groups with less restrictive inclusion criteria have shown similar findings (7,8). Further validation of anatomic segmentation in patients with NF1 with more severe myelin vacuolization will be necessary to ensure automated subcortical segmentation remains accurate.
We found a significant interaction between age and the volumes of the globus pallidi and thalami in patients with NF1, with volumes decreasing with age (Fig 4, A and B). In contrast, in healthy control subjects, volumes of the globus pallidi did not vary with age and volumes of the thalami increased with age. Interestingly, a similar age-related interaction was not observed in other subcortical structures, although several other ROIs showed a trend toward decreasing volumes with age (Fig 4, C–H), especially in patients with NF1. There were also significant interactions between age and cortical thickness in the majority of the cortical ROIs in patients with NF1, with relatively decreased cortical thicknesses in older patients, most notably in the parietal lobe (Fig 4, K). Considered together, these observations suggest that the NF1-associated increased subcortical volumes may also be time dependent; just as deep gray and hindbrain myelin vacuolization spontaneously resolve with age (6), it is conceivable that the volumetric increases we and others report may be a dynamic, transient process that later normalizes. The increased cortical thickness that decreases with age could reflect delayed dendritic pruning. Given the cross-sectional nature and relatively small size of our NF1 cohort, these age-related findings should be interpreted with caution and will need to be confirmed with longitudinal analyses. Nevertheless, these results suggest a future longitudinal imaging study of subcortical structures in NF1 may be fruitful.
Given the propensity of patients with NF1 to develop brain tumors, most commonly low-grade gliomas (18), and the overall increase of relative subcortical volumes in NF1, one may suggest that the increased volumes are precursors to a developing neoplasm. However, patients with NF1 also develop non-neoplastic imaging abnormalities (eg, the previously discussed characteristic myelin vacuolization) that spontaneously resolve. Because the volumes of the thalami and globus pallidi decrease with increasing age, it is unlikely that the high relative subcortical volumes we observed represent early neoplasia, the ICV-corrected volumes of which should continue to increase with age. Again, future longitudinal clinical and imaging analysis would be helpful to further clarify this.
Conceptually similar to other approaches for elucidating anatomic and functional brain “networks” (19–21), our cluster and partial correlation analyses showed different patterns among both cortical and subcortical structures in patients with NF1 and control subjects. In control subjects, the regions clustered according to known anatomic subdivisions such as the temporal lobe, parietal lobe, cingulum, basal ganglia, cerebellum, and medial temporal lobe. In patients with NF1, the five subcortical ROIs with largest volumes relative to those in control subjects—namely, the hippocampus, amygdala, cerebellar white matter, ventral diencephalon, and thalamus, formed a cluster distinct from other structures (Fig 5, C and D). The three cortical ROIs with the largest main effect in linear models (pericalcarine cortex, cuneus, and lingual gyrus) formed a distinct cluster in patients with NF1 (Fig 5, G and H). Similarly, patients with NF1 exhibited a pattern of morphologic correlation among subcortical and cortical structures that differed from that in control subjects (Fig 6). The altered correlations between the cerebellar, occipital, and parietal cortices in patients with NF1 could reflect sequela of the known impairment of visuospatial processing in NF1 (22), although this would need to be confirmed by correlation with detailed neuropsychiatric evaluation. Together, these findings suggest that as the anatomy of one brain region changes, similar morphologic changes occur in other, correlated brain regions; these regional correlations may reflect a shared influence occurring early during the pathogenesis of NF1 or an ongoing influence of the disease conferred across interconnected regions.
Results of prior studies (23–26) have suggested correlations between structural abnormalities and cognition in patients with NF1, both in adults and children. Standardized clinical metrics of health and cognition will be warranted in future prospective analyses of patients with NF1, with an approach similar to that of current and prior large-cohort prospective studies such as the Adolescent Brain Cognitive Development Study (ABCD) (27), PING, and the Autism Brain Imaging Data Exchange (ABIDE) (28). Our collective findings and prior work suggest a comprehensive approach for future prospective NF1 cohorts, similar to the ABCD study, with neuroimaging, biospecimen collection, and standardized metrics for the evaluation of mental health, physical health, and neurocognition.
This study was limited by its cross-sectional nature and relatively small NF1 cohort, with a resultant lack of longitudinal imaging analysis in patients with NF1. Our NF1 cohort was still significantly larger than those that have been previously reported (7,17) because of our aggregation and automated segmentation of preexisting clinical MRI studies, a technique that can applied to other relatively rare neurodevelopmental diseases. Our large control cohort, which greatly increased the number of significant differences we identified between patients and control subjects, also was the result of leveraging preexisting imaging data. Future longitudinal imaging studies could help confirm our observed trends by following subcortical volumes and cortical thickness in the same NF1 cohort over time, while clinical follow-up could record the number and location of any gliomas that subsequently developed. Detailed clinical information was unfortunately unavailable for most patients within our NF1 cohort; comprehensive neurocognitive assessments were particularly lacking. In a future longitudinal analysis, detailed neurocognitive assessments would facilitate evaluation of the relationship between brain morphometry and cognitive phenotype.
In conclusion, using clinically performed MRI studies, we showed that NF1 is characterized by robustly larger volumes of several subcortical structures, including the thalami, hippocampi, and ventral diencephalon, the same regions where characteristic NF1 myelin vacuolization occurs, and by generally thicker occipital and thinner frontal cortices. The larger thalami and pallida volumes in NF1 may be at least in part age dependent, as are most of the differences in cortical thickness. These results illustrate the feasibility of obtaining automatic quantitative measurements of anatomic structures from clinical MRI examinations and correlating those measurements with developmental and clinical parameters. Computational postprocessing integrated with clinical MRI may provide biomarkers for further longitudinal investigation of NF1 pathophysiology and for evaluating the clinical status of patients with NF1.
Summary
Neurofibromatosis type 1 (NF1) is characterized by robustly larger volumes of cortical and subcortical structures most apparent within the hippocampi, amygdalae, cerebellar white matter, occipital cortices, and thalami; these NF1-associated morphologic changes may in part be age dependent.
Implications for Patient Care
■ Automated quantitative measurements of anatomic structures can be reliably obtained from clinical MRI examinations.
■ Computational postprocessing integrated with clinical MRI may serve as a biomarker for neurofibromatosis type 1 brain morphometry.
SUPPLEMENTAL TABLES
Acknowledgments
PING Acknowledgment
Data used in the preparation of this article were obtained from the Pediatric Imaging, Neurocognition, and Genetics (PING) Study (PING Data Repository) and are shared through the National Institutes of Mental Health Data Archive. PING was a multisite, cross-sectional study of brain and cognitive development in the United States that recruited more than 1700 participants aged 3 to 20 years. The PING Study consortium consisted of 10 research sites where brain imaging, behavioral, and genetic assessments were performed. A more complete description of the study is available at PING Data Repository. The study was supported by award number RC2DA029475 from the National Institute on Drug Abuse, with additional support for data sharing provided by the Eunice Kennedy Shriver National Institute of Child Health and Human Development under award number R01HD061414. A list of participating sites and study investigators can be found at https://ping-dataportal.ucsd.edu/sharing/Authors10222012.pdf. PING investigators designed and implemented the study and/or provided data but did not necessarily participate in analysis or writing of this report. This publication is solely the responsibility of the authors and does not necessarily represent the views of the National Institutes of Health or the PING investigators.
M.J.B. supported by the National Institutes of Health (National Institute of Biomedical Imaging and Bioengineering) T32 Training Grant (T32EB001631). D.X. and C.P.H. supported by the Eunice Kennedy Shriver National Institute of Child Health and Human Development (R01HD072074). C.K. supported by the Frank A. Campini Foundation and Cannonball Kids’ Cancer Foundation. L.P.S. supported by the American Roentgen Ray Society–American Society of Neuroradiology Scholar Award. A.J.B. supported by National Institute of Neurologic Disorders and Stroke (P01NS082330 and R01HD072074). R.S.D. supported by the Radiological Society of North America, an American Society of Neuroradiology Foundation AD Imaging Award, and a National Alzheimer’s Coordinating Center Junior Investigator Award.
M.J.B. and C.H.T. contributed equally to this work.
Disclosures of Conflicts of Interest: M.J.B. disclosed no relevant relationships. C.H.T. disclosed no relevant relationships. R.M.N. disclosed no relevant relationships. Y.L. disclosed no relevant relationships. D.X. disclosed no relevant relationships. C.M.G. Activities related to the present article: disclosed no relevant relationships. Activities not related to the present article: has received royalties for books and chapters. Other relationships: disclosed no relevant relationships. O.A.G. disclosed no relevant relationships. W.P.D. Activities related to the present article: disclosed no relevant relationships. Activities not related to the present article: does occasional medical legal reviews for law firms. Other relationships: disclosed no relevant relationships. C.P.H. Activities related to the present article: disclosed no relevant relationships. Activities not related to the present article: has given medicolegal testimony for miscellaneous legal firms. Other relationships: disclosed no relevant relationships. S.M. disclosed no relevant relationships. C.K. disclosed no relevant relationships. A.M.D. Activities related to the present article: disclosed no relevant relationships. Activities not related to the present article: is a member of the advisory boards of Human Longevity and CorTechs Labs; has been appointed as Professor II at Oslo University Hospital; receives funding through research grants with GE Healthcare. Other relationships: disclosed no relevant relationships. T.L.J. disclosed no relevant relationships. L.P.S. disclosed no relevant relationships. A.J.B. disclosed no relevant relationships. R.S.D. disclosed no relevant relationships.
Abbreviations:
- FDR
- false-discovery rate
- ICV
- intracranial volume
- NF1
- neurofibromatosis type 1
- PING
- Pediatric Imaging, Neurocognition, and Genetics
- ROI
- region of interest
References
- 1.Cawthon RM, Weiss R, Xu GF, et al. A major segment of the neurofibromatosis type 1 gene: cDNA sequence, genomic structure, and point mutations. Cell 1990;62(1):193–201. [DOI] [PubMed] [Google Scholar]
- 2.Trovó-Marqui AB, Tajara EH. Neurofibromin: a general outlook. Clin Genet 2006; 70(1):1–13. [DOI] [PubMed] [Google Scholar]
- 3.Payne JM, Moharir MD, Webster R, North KN. Brain structure and function in neurofibromatosis type 1: current concepts and future directions. J Neurol Neurosurg Psychiatry 2010;81(3):304–309. [DOI] [PubMed] [Google Scholar]
- 4.Mirzaa GM, Campbell CD, Solovieff N, et al. Association of MTOR mutations with developmental brain disorders, including megalencephaly, focal cortical dysplasia, and pigmentary mosaicism. JAMA Neurol 2016;73(7):836–845. [DOI] [PMC free article] [PubMed] [Google Scholar]
- 5.DiPaolo DP, Zimmerman RA, Rorke LB, Zackai EH, Bilaniuk LT, Yachnis AT. Neurofibromatosis type 1: pathologic substrate of high-signal-intensity foci in the brain. Radiology 1995;195(3):721–724. [DOI] [PubMed] [Google Scholar]
- 6.Sevick RJ, Barkovich AJ, Edwards MS, Koch T, Berg B, Lempert T. Evolution of white matter lesions in neurofibromatosis type 1: MR findings. AJR Am J Roentgenol 1992;159(1):171–175. [DOI] [PubMed] [Google Scholar]
- 7.Violante IR, Ribeiro MJ, Silva ED, Castelo-Branco M. Gyrification, cortical and subcortical morphometry in neurofibromatosis type 1: an uneven profile of developmental abnormalities. J Neurodev Disord 2013;5(1):3. [DOI] [PMC free article] [PubMed] [Google Scholar]
- 8.Duarte JV, Ribeiro MJ, Violante IR, Cunha G, Silva E, Castelo-Branco M. Multivariate pattern analysis reveals subtle brain anomalies relevant to the cognitive phenotype in neurofibromatosis type 1. Hum Brain Mapp 2014;35(1):89–106. [DOI] [PMC free article] [PubMed] [Google Scholar]
- 9.Fischl B. FreeSurfer. Neuroimage 2012;62(2):774–781. [DOI] [PMC free article] [PubMed] [Google Scholar]
- 10.Fischl B, Salat DH, Busa E, et al. Whole brain segmentation: automated labeling of neuroanatomical structures in the human brain. Neuron 2002;33(3):341–355. [DOI] [PubMed] [Google Scholar]
- 11.Fjell AM, Walhovd KB, Brown TT, et al. Multimodal imaging of the self-regulating developing brain. Proc Natl Acad Sci U S A 2012;109(48):19620–19625. [DOI] [PMC free article] [PubMed] [Google Scholar]
- 12.Jernigan TL, Brown TT, Hagler DJ, Jr, et al. The Pediatric Imaging, Neurocognition, and Genetics (PING) data repository. Neuroimage 2016;124(Pt B):1149–1154. [DOI] [PMC free article] [PubMed] [Google Scholar]
- 13.Desikan RS, Ségonne F, Fischl B, et al. An automated labeling system for subdividing the human cerebral cortex on MRI scans into gyral based regions of interest. Neuroimage 2006;31(3):968–980. [DOI] [PubMed] [Google Scholar]
- 14.Schaer M, Cuadra MB, Tamarit L, Lazeyras F, Eliez S, Thiran JP. A surface-based approach to quantify local cortical gyrification. IEEE Trans Med Imaging 2008;27(2):161–170. [DOI] [PubMed] [Google Scholar]
- 15.MacQueen J. Some methods for classification and analysis of multivariate observations. Proceedings of the Fifth Berkeley Symposium on Mathematical Statistics and Probability. Berkeley, Calif: University of California Press, 1967; 281–297. [Google Scholar]
- 16.Thorndike RL. Who belongs in the family? Psychometrika 1953;18(4):267–276. [Google Scholar]
- 17.Huijbregts SC, Loitfelder M, Rombouts SA, et al. Cerebral volumetric abnormalities in Neurofibromatosis type 1: associations with parent ratings of social and attention problems, executive dysfunction, and autistic mannerisms. J Neurodev Disord 2015;7(1):32. [DOI] [PMC free article] [PubMed] [Google Scholar]
- 18.Rodriguez FJ, Perry A, Gutmann DH, et al. Gliomas in neurofibromatosis type 1: a clinicopathologic study of 100 patients. J Neuropathol Exp Neurol 2008;67(3):240–249. [DOI] [PMC free article] [PubMed] [Google Scholar]
- 19.He Y, Chen Z, Evans A. Structural insights into aberrant topological patterns of large-scale cortical networks in Alzheimer’s disease. J Neurosci 2008;28(18):4756–4766. [DOI] [PMC free article] [PubMed] [Google Scholar]
- 20.Seeley WW, Crawford RK, Zhou J, Miller BL, Greicius MD. Neurodegenerative diseases target large-scale human brain networks. Neuron 2009;62(1):42–52. [DOI] [PMC free article] [PubMed] [Google Scholar]
- 21.Lerch JP, Worsley K, Shaw WP, et al. Mapping anatomical correlations across cerebral cortex (MACACC) using cortical thickness from MRI. Neuroimage 2006;31(3):993–1003. [DOI] [PubMed] [Google Scholar]
- 22.Clements-Stephens AM, Rimrodt SL, Gaur P, Cutting LE. Visuospatial processing in children with neurofibromatosis type 1. Neuropsychologia 2008;46(2):690–697. [DOI] [PMC free article] [PubMed] [Google Scholar]
- 23.Greenwood RS, Tupler LA, Whitt JK, et al. Brain morphometry, T2-weighted hyperintensities, and IQ in children with neurofibromatosis type 1. Arch Neurol 2005;62(12):1904–1908. [DOI] [PubMed] [Google Scholar]
- 24.Pride NA, Korgaonkar MS, Barton B, Payne JM, Vucic S, North KN. The genetic and neuroanatomical basis of social dysfunction: lessons from neurofibromatosis type 1. Hum Brain Mapp 2014;35(5):2372–2382. [DOI] [PMC free article] [PubMed] [Google Scholar]
- 25.Cutting LE, Cooper KL, Koth CW, et al. Megalencephaly in NF1: predominantly white matter contribution and mitigation by ADHD. Neurology 2002;59(9):1388–1394. [DOI] [PubMed] [Google Scholar]
- 26.Bekiesinska-Figatowska M, Mierzewska H, Jurkiewicz E. Basal ganglia lesions in children and adults. Eur J Radiol 2013;82(5):837–849. [DOI] [PubMed] [Google Scholar]
- 27.Barch DM, Albaugh MD, Avenevoli S, et al. Demographic, physical and mental health assessments in the adolescent brain and cognitive development study: rationale and description. Dev Cogn Neurosci 2018;32:55–66. [DOI] [PMC free article] [PubMed] [Google Scholar]
- 28.Di Martino A, Yan CG, Li Q, et al. The autism brain imaging data exchange: towards a large-scale evaluation of the intrinsic brain architecture in autism. Mol Psychiatry 2014;19(6):659–667. [DOI] [PMC free article] [PubMed] [Google Scholar]
Associated Data
This section collects any data citations, data availability statements, or supplementary materials included in this article.