Abstract
Purpose
To determine whether quantitative MRI relaxation time mapping techniques can help to detect ischemic injury to the developing femoral head.
Materials and Methods
For this prospective animal study conducted from November 2015 to February 2018, 10 male 6-week-old piglets underwent an operation to induce complete right femoral head ischemia. Animals were humanely killed at 48 hours (n = 2) or 4 weeks (n = 8) after the operation, and the operated and contralateral-control femoral heads were harvested and frozen. Thawed specimens were imaged at 9.4-T MRI by using T1, T2, T1 in the rotating frame (T1ρ), adiabatic T1ρ, relaxation along a fictitious field (RAFF), and T2* mapping and evaluated with histologic analysis. Paired relaxation time differences between the operated and control femoral heads were measured in the secondary ossification center (SOC), epiphyseal cartilage, articular cartilage, and metaphysis and were analyzed by using a paired t test.
Results
In the SOC, T1ρ and RAFF had the greatest percent increases in the operated versus control femoral heads at both 48 hours (112% and 72%, respectively) and 4 weeks (74% and 70%, respectively). In the epiphyseal and articular cartilage, T2, T1ρ, and RAFF were similarly increased at both points (range, 24%–49%). At 4 weeks, T2, T1ρ, adiabatic T1ρ, and RAFF were increased in the SOC (P = .004, .018, < .001, and .001, respectively), epiphyseal cartilage (P = .009, .008, .011, and .007, respectively), and articular cartilage (P = .005, .016, .033, and .018, respectively). Histologic assessment identified necrosis in SOC and deep layer of the epiphyseal cartilage at both points.
Conclusion
T2, T1 in the rotating frame, adiabatic T1 in the rotating frame, and relaxation along a fictitious field maps are sensitive in helping to detect ischemic injury to the developing femoral head.
© RSNA, 2018
Introduction
Legg-Calvé-Perthes disease (LCPD) is a childhood ischemic hip disorder caused by disruption of blood flow to the growing femoral head, which can lead to severe femoral head deformity and osteoarthritis (1). The disruption of blood flow produces extensive cell necrosis in the marrow and trabecular bone of the secondary ossification center (SOC) and the deep layer of the subarticular epiphyseal cartilage (2). Gradual revascularization of the necrotic epiphysis is accompanied by bone resorption, making the femoral head susceptible to deformation (2). Approximately half of patients with LCPD clinically present when the femoral head deformity is mild, providing a therapeutic window to protect against further deformity (1,3,4). However, clinically standard radiography and conventional morphologic MRI have limited ability to measure the early-stage ischemic injury, which delays treatment decisions (5).
To improve care of patients with LCPD, imaging methods are needed to quantify the severity of ischemic injury to the femoral head. Contrast agent–enhanced perfusion MRI can be used to help measure the avascular SOC volume and determine whether revascularization has occurred (6–9). However, perfusion MRI does not directly measure SOC necrosis (10), nor does it measure cartilage injury. Furthermore, the long-term consequences of gadolinium deposition in the brain are a potential risk for children, particularly if contrast agents are used serially to monitor disease progression (11). Diffusion-weighted MRI is a complementary technique that can depict injury to the SOC and the surrounding cartilage (12–14), but it has relatively low spatial resolution and is sensitive to distortion and ghosting artifacts caused by magnetic susceptibility differences at air-to-tissue and bone-to-tissue interfaces and by motion (15).
To our knowledge, the role of relaxation time mapping techniques for assessment of bone and marrow ischemia has not been well established in the literature. Conversely, quantitative mapping of T1 in the rotating frame (T1ρ) is sensitive in depicting ischemic injury in stroke and myocardial infarction (16–19). Furthermore, quantitative mapping of T2, T1ρ, adiabatic T1ρ, and relaxation along a fictitious field (RAFF) are sensitive in helping to detect ischemia-induced epiphyseal cartilage necrosis (20–22). T1ρ has also been shown to depict early articular cartilage damage overlying necrotic bone in adult patients with collapsed femoral head avascular necrosis (23). Thus, T1ρ and other relaxation times may be useful to help detect early ischemic injury to the bone, marrow, and cartilage of the growing femoral head. T1ρ and the related rotating frame methods, adiabatic T1ρ and RAFF, are of interest because they are sensitive to molecular interactions that are not detectable by using laboratory frame approaches (24). Whereas conventional T1, T2, and T2* are sensitive to fast molecular interactions (on the order of megahertz, corresponding to the Larmor frequency), rotating frame methods use spin-lock radiofrequency pulses (ie, small magnetic fields) to probe slower molecular interactions (on the order of 10 Hz to 10 kHz) such as chemical exchange (24). Each rotating frame method probes a different range of slow molecular interactions (25), thus each may have a different sensitivity to tissue changes in response to ischemic injury.
The purpose of our study was to determine whether quantitative relaxation time mapping techniques can help to identify ischemic injury to the developing femoral head. Six relaxation times (T1, T2, T1ρ, adiabatic T1ρ, RAFF, and T2*) were evaluated in a piglet model of ischemic osteonecrosis of the femoral head. We hypothesized that the relaxation time measurements can help to detect ischemic injury to the SOC and the subarticular epiphyseal cartilage as early as 48 hours after induction of ischemia.
Materials and Methods
Animals
Our prospective animal study was conducted with an institutional animal care and use committee–approved protocol from November 2015 to February 2018. Ten 5-week-old male piglets were obtained from a commercial provider (Change of Pace, Aubrey, Tex). At 6 weeks old, the piglets underwent an operation on their right hips to induce ischemia of the entire femoral head by placing a tight ligature about the femoral neck and transecting the ligamentum teres femoris (26,27). Operations were performed by a board-certified pediatric orthopedic surgeon (H.K.W.K.) with 20 years of experience working with the model. The piglets were humanely killed at either 48 hours (n = 2) or 4 weeks (n = 8) following the operation. After they were killed, the right (operated) and left (contralateral control) femoral heads were surgically removed and immediately placed in a 220°C freezer for storage until imaging at a later time. We focused on the 4-week period because this corresponds radiographically and histologically to a typical avascular stage at which children present with LCPD before onset of the reparative process (3,27,28). However, it is also of interest to study whether early ischemic damage is detectable. Thus, we also collected data at an acute point (48 hours after the operation). Only male piglets were studied to reduce experimental variability and because LCPD is five times more common in boys than in girls (29).
MR Image Acquisition
The femoral head specimens were imaged individually by using a preclinical 31-cm-bore 9.4-T MRI system (Agilent Technologies, Santa Clara, Calif) equipped with a Varian console with VnmrJ software (Varian NMR Systems, Palo Alto, Calif). Imaging was performed by two MRI scientists (C.P.J. and L.W., with 12 and 10 years of experience, respectively). Immediately before imaging, the specimens were thawed at room temperature, secured with a holder to control positioning in the imager, and immersed in Fomblin (Specialty Fluids Company, Castaic, Calif) to reduce magnetic susceptibility–related artifacts. The specimens were placed in a Varian millipede radiofrequency coil (Varian NMR Systems), which was manually tuned and matched for each specimen. After the acquisition of scout images and manual second-order B0 shimming, images for quantitative relaxation time mapping were acquired. Each specimen was imaged for approximately 3 hours to provide high (0.16 × 0.16 mm2) in-plane spatial resolution. Imaging parameters are in Table 1. T1-weighted, T2-weighted, T1ρ-weighted, adiabatic T1ρ-weighted, and RAFF images for quantitative mapping were each acquired by using the same single-section two-dimensional fast-spin-echo sequence with different magnetization preparation blocks (Table 1). T2*-weighted images were acquired by using a two-dimensional multiecho gradient-echo sequence on the same plane as the two-dimensional fast-spin-echo images. T2* maps were not acquired for two of the 4-week postoperative femoral head pairs. Fat suppression was not applied in any imaging sequence. The imaging section used for quantitative mapping was oriented so that it bisected the femoral head while passing through the apex of the greater trochanter and 1.0 mm anterior to the insertion point of the ligamentum teres femoris. By using these anatomic landmarks, in combination with a holder to keep the femoral head in a fixed position, the imaging plane was co-registered for 9.4-T MRI and histologic analysis correlation.
Table 1:
Quantitative Relaxation Time Mapping Imaging Parameters
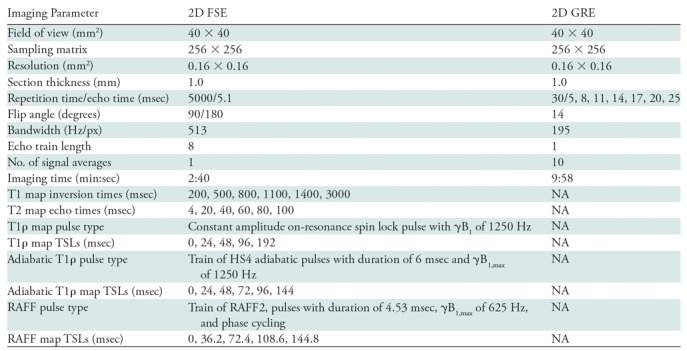
Note.—2D = two-dimensional, FSE = fast spin echo, GRE = gradient-recalled echo, NA = not applicable, RAFF = relaxation along a fictitious field, T1ρ = T1 in the rotating frame, TSL = spin-lock time.
Histologic Evaluation
Immediately after MRI, the femoral heads were bisected along the imaging plane with a high-speed bone saw (TechCut 5; Allied High Tech Products, Compton, Calif) and fixed in 10% neutral buffered formalin. Specimens were then decalcified by using 10% ethylenediaminetetraacetic acid and routinely processed into paraffin blocks for histologic sectioning. We stained 5-μm-thick serial slices with hematoxylin-eosin and they were qualitatively evaluated to assess the morphologic structure of the SOC and overlying cartilage. Histologic evaluation was performed by a board-certified orthopedic veterinary pathologist (C.S.C., with 30 years of experience) who was blinded to treatment.
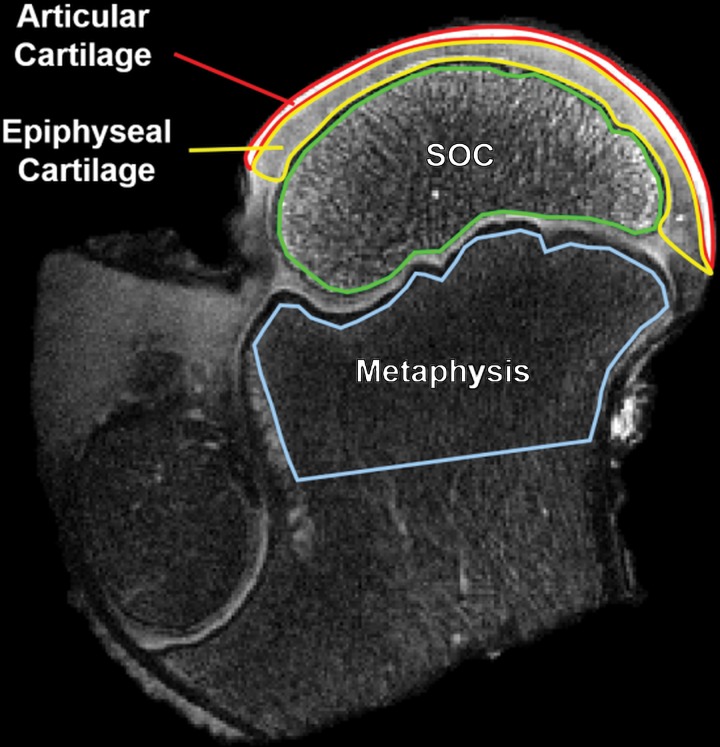
Data Analysis
MRI postprocessing was performed by using Matlab (version R2013b; MathWorks, Natick, Mass). Quantitative relaxation time maps were generated by using a monoexponential fitting algorithm. Three regions of interest (ROIs) were manually drawn in the epiphysis for all operated and control femoral head images to encompass the SOC, the subarticular epiphyseal cartilage (ie, growth cartilage) overlying the SOC, and the overlying articular cartilage (Fig 1). A fourth ROI was also drawn in the metaphysis as an internal control because its intraosseous blood supply was unaltered by the surgical procedure (unlike the separate blood supply of the epiphysis via penetrating extraosseous blood vessels) (30). The ROIs were defined by using T2-weighted images acquired as part of the T2 mapping sequence, which provided comparison between the epiphyseal cartilage and the overlying higher-intensity articular cartilage. Areas distorted by field inhomogeneity artifacts were excluded. The median relaxation time within each ROI was measured, and paired values for the operated and contralateral control femoral heads were compared. The median value was chosen because it is robust to outliers. For the 4-week postsurgical specimens, the paired values were statistically compared by using R statistical software (version 3.3.1; R Foundation for Statistical Computing, Vienna, Austria) with a parametric two-tailed paired t test. Two statistical significance thresholds were defined. We defined P values less than .002 as indicative of definitive significance with a type I error rate (a = .05) after conservative Bonferroni correction for 24 comparisons (six relaxation times × four ROIs). Given the likelihood of measurements being correlated across both relaxation times and ROIs, we defined findings with P value less than .05 (and thus a minimal type II error rate) as hypothesis generating. A nonparametric Wilcoxon signed rank test was also performed for comparison. Additionally, mean percent differences between the median relaxation time values for the paired operated and control femoral heads were calculated and compared for specimens with induced ischemia at postoperative 48 hours and 4 weeks.
Figure 1:
Region of interest (ROI) definitions for quantitative analysis of the relaxation time maps. A T2-weighted image of an operated femoral head 48 hours after induction of ischemia in a 6-week-old piglet is shown with the four ROIs outlined. In the growing femoral head, the vascularized subarticular epiphyseal cartilage is gradually replaced by the secondary ossification center (SOC) until the ossification front reaches the overlying articular cartilage. These three ROIs are potentially affected by the surgical induction of ischemia. The fourth ROI in the metaphysis was included in the analysis as an internal control as its blood supply is not altered by the surgical procedure.
Results
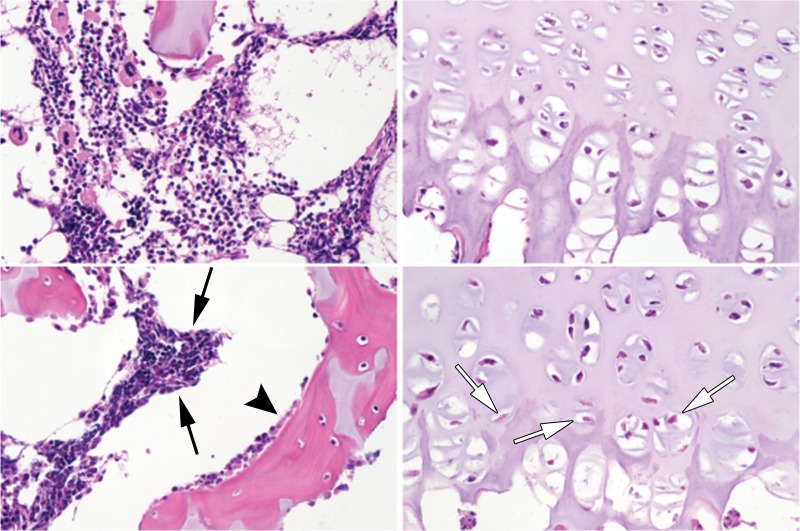
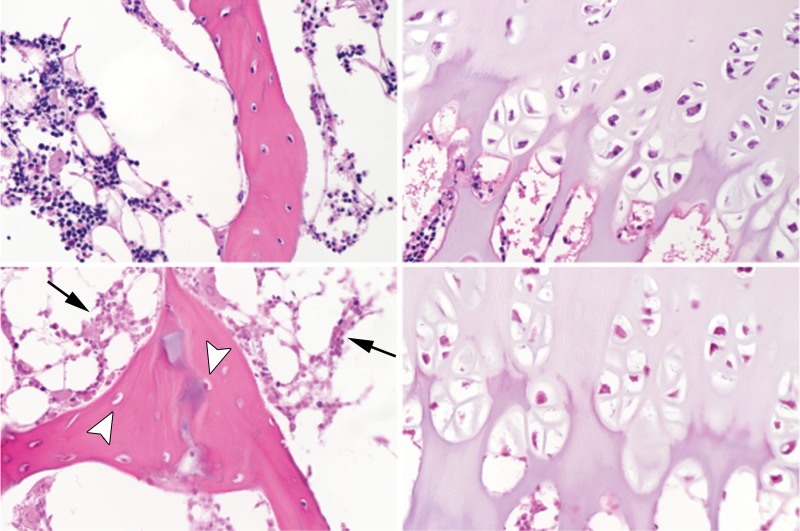
Histologic analysis revealed that the femoral heads with induced ischemia at 48 hours after operation showed subtle evidence of necrosis (Fig 2a). Cells in the bone marrow of the SOC had reduced clarity of cytoplasmic and nuclear details, exhibited clumping, and were admixed with fibrillar material. Diffusely eosinophilic chondrocytes were present in the deep layer of the epiphyseal cartilage, indicative of cartilage necrosis. Seven of the eight femoral heads removed 4 weeks after operation showed evidence of extensive necrosis in the SOC (pyknosis and increased eosinophilia of nuclei, and cell shrinkage) and chondronecrosis in the deep layer of the epiphyseal cartilage (Fig 2b). There was no evidence of osteonecrosis or chondronecrosis in the femoral head control specimens. The histologic appearance of the SOC and cartilage of the eighth specimen removed 4 weeks after operation was similar to the contralateral (control specimen) femoral head from the same animal, which indicated a failure of the operation to induce ischemic injury. Thus, this was designated as a sham control specimen and was excluded from the statistical analyses. Additionally, one of the femoral heads obtained at 4 weeks after operation was categorically different than the others; the femoral head showed advanced deformation so that the SOC contained only necrotic tissue debris that lacked definition of tissue or bone structure. Unlike the other femoral heads that had changes resembling early-stage LCPD, the severe collapse of this latter femoral head represented the late fragmentation stage of the disease that is identifiable on radiographs and for which the proposed MRI methodologic analysis is unnecessary. Thus, we also excluded this femoral head from the statistical analysis, leaving a group of six femoral head pairs at the 4-week point.
Figure 2a:
Representative photomicrographs of histologic slices of the secondary ossification center (left-hand side in a and b) and epiphyseal cartilage (right-hand side in a and b) from paired control and operated femoral heads stained with hematoxylin-eosin at 403 magnification. Images at the top of a and b are from control piglets and images at the bottom of a and b are from the piglets who underwent operation. (a) Images in a 6-week-old piglet 48 hours after the induction of ischemia. Hematopoietic cells in the bone marrow exhibited clumping and loss of distinctly identifiable cell margins in the operated femoral heads (black arrows). There was evidence of osteoblast necrosis (arrowhead). Many chondrocytes in the deep layer of the epiphyseal cartilage were eosinophilic and lacked distinct nuclei (white arrows). (b) Images in a second 6-week-old piglet 4 weeks after induction of ischemia. The bone marrow cells were diffusely necrotic, characterized by loss of nuclear staining and diffusely eosinophilic cytoplasm (arrows). There was also extensive evidence of osteocyte necrosis (loss of nuclear staining or the presence of empty osteocyte lacunae) in the trabecular bone (arrowheads). Diffuse chondronecrosis remained limited primarily to the deep layer of the epiphyseal cartilage.
Figure 2b:
Representative photomicrographs of histologic slices of the secondary ossification center (left-hand side in a and b) and epiphyseal cartilage (right-hand side in a and b) from paired control and operated femoral heads stained with hematoxylin-eosin at 403 magnification. Images at the top of a and b are from control piglets and images at the bottom of a and b are from the piglets who underwent operation. (a) Images in a 6-week-old piglet 48 hours after the induction of ischemia. Hematopoietic cells in the bone marrow exhibited clumping and loss of distinctly identifiable cell margins in the operated femoral heads (black arrows). There was evidence of osteoblast necrosis (arrowhead). Many chondrocytes in the deep layer of the epiphyseal cartilage were eosinophilic and lacked distinct nuclei (white arrows). (b) Images in a second 6-week-old piglet 4 weeks after induction of ischemia. The bone marrow cells were diffusely necrotic, characterized by loss of nuclear staining and diffusely eosinophilic cytoplasm (arrows). There was also extensive evidence of osteocyte necrosis (loss of nuclear staining or the presence of empty osteocyte lacunae) in the trabecular bone (arrowheads). Diffuse chondronecrosis remained limited primarily to the deep layer of the epiphyseal cartilage.
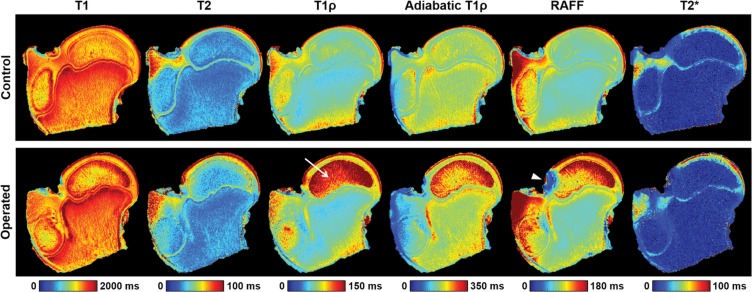
Despite the subtle appearance of histologic findings of tissue necrosis in the two femoral heads obtained at 48 hours after operation, relaxation times were increased in the SOC, epiphyseal cartilage, and articular cartilage for both specimens. Quantitative relaxation time maps for one of the operated femoral heads and its control specimen are shown in Figure 3, which demonstrate a pronounced increase in relaxation times, particularly T1ρ, in the SOC, epiphyseal cartilage, and articular cartilage. For comparison, conventional proton density– and T2-weighted images are shown in Figure E1 (online). Table 2 shows the average relaxation time percent increase in each of the four ROIs between the pairs of operated and control femoral heads. These values are also plotted in Figure E2 (online). T1ρ and RAFF relaxation times showed the greatest percent increase in the SOC 48 hours after induction of ischemia (112% and 72%, respectively). In the epiphyseal and articular cartilage, the greatest relaxation time increases were observed at T2 (increases of 24% and 32%, respectively), T1ρ (increases of 25% and 28%, respectively), adiabatic T1ρ (increases of 25% and 13%, respectively), and RAFF (increases of 25% and 28%, respectively). The internal control ROI in the metaphysis showed no notable changes in relaxation times between the operated and control femoral heads. Table 3 shows numerical data from the ROI analysis that reflect the percent increase findings.
Figure 3:
Quantitative relaxation time maps acquired for one pair of operated and contralateral control femoral heads 48 hours after the induction of ischemia in a 6-week-old piglet. The operated femoral head had increased relaxation times in the secondary ossification center, epiphyseal cartilage, and articular cartilage compared with the control specimen. T1 in the rotating frame (T1r) relaxation times were markedly increased in the secondary ossification center (arrow). The metaphysis had similar relaxation times in both specimens, as expected. The relaxation along a fictitious field (RAFF) map for the operated femoral head had a region of susceptibility artifact because of the presence of a nearby air bubble (arrowhead).
Table 2:
Average Increase in Relaxation Time
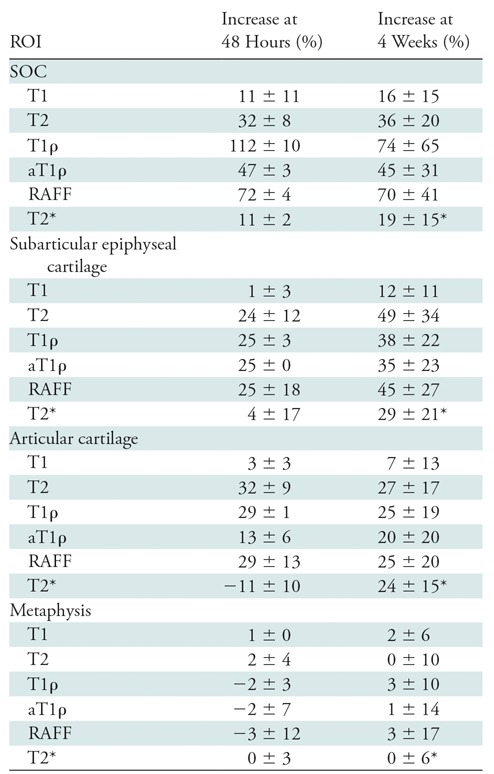
Note.—Data are between paired operated and contralateral control femoral heads at 48 hours (n = 2) and 4 weeks (n = 6) after the induction of ischemia. Data are means ± standard deviation. aT1ρ = adiabatic T1ρ, RAFF = relaxation along a fictitious field, ROI = region of interest, SOC = secondary ossification center, T1ρ = T1 in the rotating frame.
*At the 4-week point, four T2* maps were acquired (vs six).
Table 3:
Relaxation Time Differences between Paired Operated and Contralateral-Control Femoral Heads 48 Hours after Induction of Ischemia
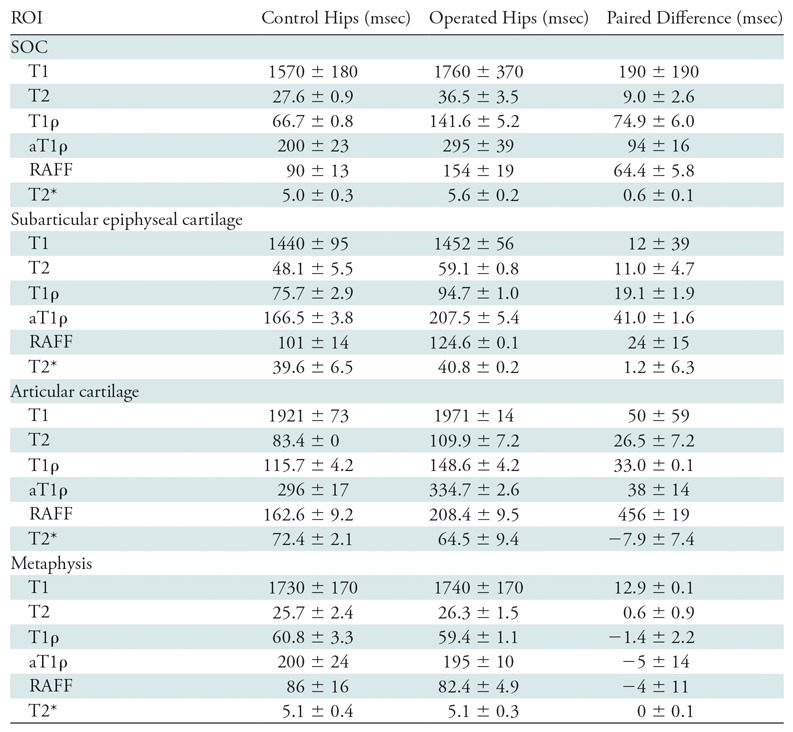
Note.—Data are means ± standard deviation. aT1ρ = adiabatic T1ρ, RAFF = relaxation along a fictitious field, ROI = region of interest, SOC = secondary ossification center, T1ρ = T1 in the rotating frame.
The six 4-week postoperative femoral heads that exhibited extensive osteonecrosis in the SOC and chondronecrosis in the deep layer of the epiphyseal cartilage showed increased relaxation times in the SOC, epiphyseal cartilage, and articular cartilage compared with their control specimens. The average relaxation time percent increase in each of the four ROIs between the pairs of operated and control femoral heads are shown in Table 2 and Figure E2 (online). In the SOC, T1ρ and RAFF showed the greatest percent increases (74% and 70%, respectively). In the epiphyseal and articular cartilage, T2 (49% and 28%), T1ρ (38% and 25%), and RAFF (45% and 25%) had the greatest percentage increase. However, the relaxation times exhibited by the sham-operated femoral head were similar to those of the control specimens; the percent increases in T1ρ were 1.8%, 4.9%, 11.6%, and 1.4% for the SOC, epiphyseal cartilage, articular cartilage, and metaphysis, respectively. Detailed quantitative analyses of the ROI data are shown in Table 4. T1, T2, T1ρ, adiabatic T1ρ, and RAFF were all increased in the SOC (P = .040, .004, .018, <.001, and .001, respectively) and epiphyseal cartilage (P = .034, .009, .008, .011, and .007, respectively) in the operated femoral heads compared with the paired control specimens. Furthermore, T2, T1ρ, adiabatic T1ρ, and RAFF were all increased in the articular cartilage (P = .005, .016, .033, and .018, respectively). T1 was not altered in the articular cartilage ROI (P = .24) and T2* was not altered in any of the ROIs (P = .09, .08, and .06 in the SOC, epiphyseal cartilage, and articular cartilage, respectively). None of the relaxation times was altered in the metaphysis (P = .49, .99, .46, .90, .72, and .89 for T1, T2, T1ρ, adiabatic T1ρ, RAFF, and T2*, respectively). The statistical findings were consistent with the nonparametric test.
Table 4:
Relaxation Time Differences between Paired Operated and Contralateral-Control Femoral Heads 4 Weeks after Induction of Ischemia
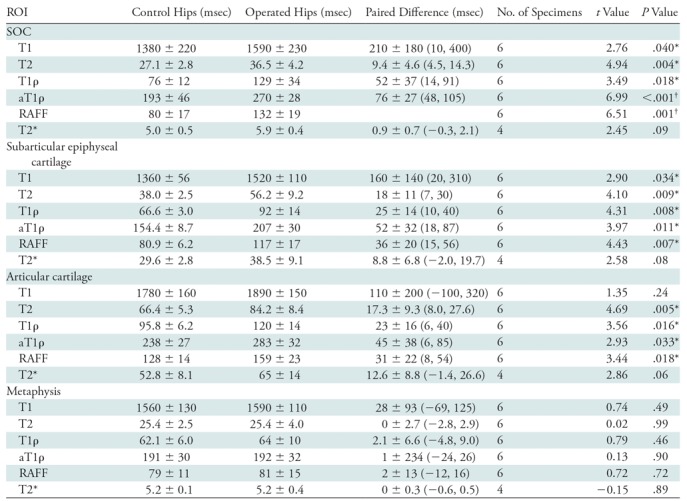
Note.—Data are means ± standard deviation unless otherwise noted; data in parentheses are 95% confidence intervals. aT1ρ = adiabatic T1ρ, RAFF = relaxation along a fictitious field, ROI = region of interest, SOC = secondary ossification center, T1ρ = T1 in the rotating frame.
*Hypothesis generating (P < .05).
†Definitively significant after Bonferroni correction (P < .002).
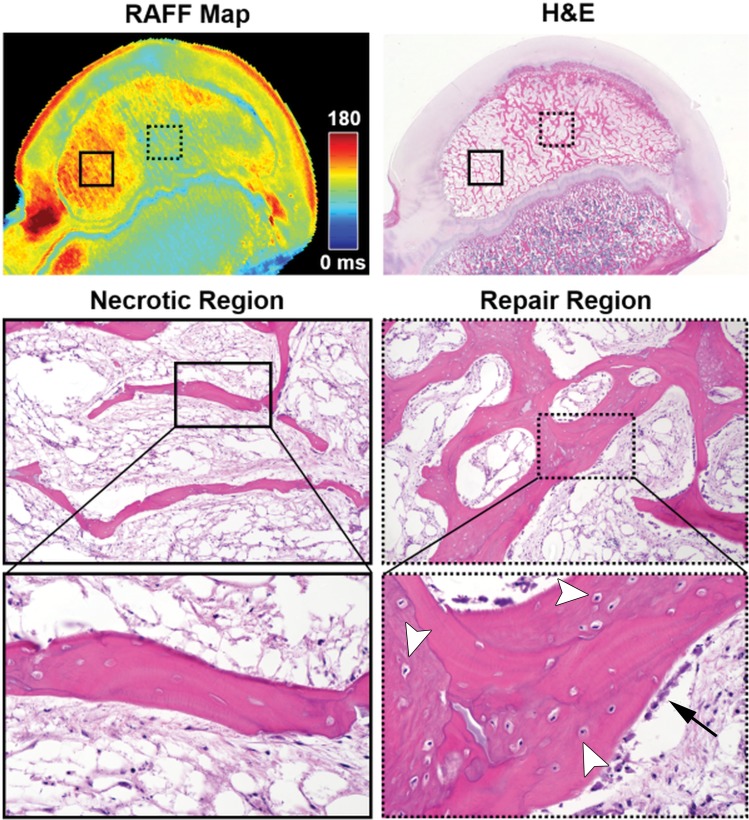
One of the 4-week postoperative specimens had increased relaxation times only in a well-circumscribed focal area of the SOC. Histologic assessment of this specimen confirmed that only this focal area of the SOC was necrotic, whereas the remaining SOC had undergone revascularization and new bone formation (Fig 4).
Figure 4:
Quantitative relaxation time mapping distinguished regions of secondary ossification center (SOC) necrosis and repair (validated at histologic analysis) in an operated femoral head 4 weeks after the induction of ischemia in a 6-week-old piglet. On a relaxation along a fictious field (RAFF) map in the operated femoral head, an area of increased relaxation time in the lateral aspect of the SOC (red; solid box) corresponded to a region of diffuse bone necrosis (empty osteocyte lacunae and lack of viable surface osteoblasts) and marrow necrosis observed at histologic analysis (visible on the necrotic region images). An adjacent area of normalized relaxation times in the more medial aspect of the SOC (green; dotted box on the RAFF map) corresponded to a region with areas of new bone. In the repair region, viable osteoblasts (arrow) can be seen on the surface of new or woven bone containing basophilic (viable) osteocytes within lacunae (arrowheads); these areas of new bone surround an area of preexisting, necrotic lamellar bone containing empty osteocyte lacunae. Photomicrographs of the histologic sections stained with hematoxylin-eosin (H&E) were taken at 0.53 (top), 103 (middle), and 403 (bottom) magnification.
Discussion
Quantitative MRI relaxation time mapping is a potential alternative approach to measure ischemic injury to the SOC and cartilage of the femoral head with high spatial resolution. Our findings support the hypothesis that quantitative relaxation time maps are sensitive in helping to detect ischemic injury to the developing femoral head. In particular, T1ρ and RAFF had the greatest percent increases in the SOC after injury at both 48 hours (112% and 72%, respectively) and 4 weeks (74% and 70%, respectively). T2, T1ρ, adiabatic T1ρ, and RAFF were also increased in the epiphyseal cartilage and articular cartilage at 48 hours and 4 weeks after the onset of ischemia. Our findings provide a basis that would support further investigations of MRI quantitative mapping techniques in children suspected of having or who have been diagnosed with LCPD.
The sharp increase in T1ρ and RAFF relaxation times in the SOC 48 hours after disruption of blood flow to the femoral head suggests that these methods are sensitive for detection of ischemic necrosis of the bone marrow. Per histologic analysis, the ischemic SOC had only mild changes in the marrow at 48 hours, which was consistent with a previous study (31). Our MRI findings were consistent with studies that showed that T1ρ is particularly sensitive in helping to detect ischemic injury to the brain and myocardium (16–19). In these studies, ischemia-induced increases in T1ρ were attributed to increased water uptake by affected cells and altered chemical exchange of labile protons between free water and macromolecules. Similar effects may be driving the relaxation time changes in the ischemic SOC. Our finding that T1 was relatively insensitive in helping to detect the SOC injury suggests that water content was not the dominant source of the relaxation time increases. The insensitivity of T2* was likely because it is dominated by the magnetic susceptibility of the trabecular bone, which was not expected to be affected acutely by ischemia. The higher sensitivity of the spin-lock-based techniques compared with T2 was likely driven by the contributions of slow motional processes such as chemical exchange. Furthermore, the differences between T1ρ, adiabatic T1ρ, and RAFF may relate to the precise motional frequencies that were probed by each. However, the biologic correlates of these slow motional frequencies in the SOC are unknown. Intracellular changes that occur as a result of ischemia, including water uptake, decreased pH level, and macromolecular changes (32), along with potential concomitant alterations to the interface between marrow and trabecular bone (33), may collectively contribute to the relaxation time increases. Our findings warrant further investigation of the acute effects of ischemia on SOC relaxation times to determine the primary biologic drivers of their sensitivities.
The sustained increase in SOC relaxation times 4 weeks after the onset of ischemia supports the hypothesis that quantitative mapping techniques can be used to determine the severity of ischemic injury to the SOC in early-stage LCPD and to help detect the early stages of repair. At the 4-week point, changes to the SOC were more variable as tissue repair changes in the SOC began to occur, including partial revascularization of the SOC, infiltration by fibrovascular tissue, clearance of necrotic marrow cells, bone resorption, and new bone formation (2). Our results suggest that relaxation times are increased only in the portion of the SOC that is necrotic and that the relaxation times are decreased as the necrotic tissue is replaced by viable repair tissue. The reduction of relaxation times in the partially-repaired femoral head may be attributed to the infiltration of dense fibrovascular tissue into the necrotic marrow space and the formation of new bone. Consistent with the 48-hour point, T1 and T2* were relatively insensitive to changes in the SOC, which suggests that similar mechanisms are driving the increase in relaxation times throughout the ischemic stage of the disease. Further study is needed at additional points to determine how relaxation times respond to the dynamics of ischemic osteonecrosis, deformation, and repair of the femoral head.
The increase in relaxation times throughout the epiphyseal and articular cartilage of the injured femoral heads at both 48 hours and 4 weeks after induction of ischemia suggests that the cartilage composition was altered. Consistent with previous reports (26,34,35), histologic changes to the cartilage were primarily noted in the deep layer of the epiphyseal cartilage. However, our global MRI findings suggest that there were changes to the cartilage matrix and/or intracellular composition that were undetected by the histologic analyses. It is well established that T2 and T1ρ can help to detect early degenerative changes in articular cartilage, such as increased water content, changes in collagen content and orientation, and loss of proteoglycans (36). It has also been shown (20–22) that T2, T1ρ, adiabatic T1ρ, and RAFF can help to detect focal cartilage lesions created by surgical induction of ischemia in epiphyseal cartilage. Our findings further support that T2, T1ρ, adiabatic T1ρ, and RAFF can help to detect early ischemic injury to the cartilage. Similar to the SOC, we found that T1 was relatively insensitive to ischemia-induced changes in the cartilage, which suggests that water content is not the dominant signal source. In terms of percent change, T2* was equivalent to the other transverse relaxation times at the 4-week point; therefore, the lack of statistical findings may be because of the greater sensitivity to deviations in the magnetic field on the part of the technique. Collectively, our findings may be clinically significant because early detection will provide a more comprehensive assessment of ischemic damage to the growing femoral head than is currently possible by using routine clinical imaging methods.
Our study had limitations. First, imaging was performed ex vivo and specimens underwent freezing. Whereas freezing is known to cause an increase in articular cartilage relaxation times (37), the effect of freezing on relaxation times in the epiphyseal cartilage and bone marrow is unknown. In vivo imaging investigations of the piglet model would enable study of the effects of ischemia on the relaxation times at normal physiologic conditions. Second, we used a cross-sectional study design and included a limited sample size, and therefore the findings may not represent the range of the entire population. Furthermore, the effects of ischemia were more variable at later points, which is a source of statistical uncertainty. Additional studies are needed to characterize the longitudinal progression and variability of the femoral head relaxation times. Third, because of limited sample size and the large number of comparisons performed, the statistical analysis was primarily useful for hypothesis generation rather than definitive findings. Future studies can be designed to focus on the most sensitive relaxation times and relevant ROIs. Fourth, a single two-dimensional section was acquired for quantitative mapping. Although this enabled high-spatial-resolution comparison with histologic analysis, it is of clinical interest to assess ischemic damage across the entire femoral head. Fifth, temperature was not controlled during the experiments, which could be a potential confound because of radiofrequency heating, particularly during the T1ρ sequence. However, the experiment consistently used the same imaging protocol, and therefore any temperature change would similarly affect all specimens. Sixth, we did not investigate the effect of lipid signals on the SOC relaxation times. It would be of interest to investigate how changes in lipid content with ischemia and aging affect the relaxation times. Finally, further study is needed to translate our findings to clinical 1.5-T and/or 3-T MR imagers, including optimization of pulse sequences to comply with radiofrequency power deposition limits and investigations at these lower field strengths because rotating frame methods can have greater sensitivity to certain slow molecular interactions at higher fields (38).
In conclusion, T2, T1ρ, adiabatic T1ρ, and RAFF maps are sensitive in helping to detect ischemic injury to the developing femoral head. Regarding practical applications, quantitative relaxation time mapping techniques are worth investigating for detection and quantification of the severity of ischemic injury to the femoral head in children with early-stage LCPD and related ischemic bone and joint disorders.
Summary
Quantitative MR mapping techniques are sensitive in helping to detect ischemic injury to the developing femoral head.
Implications for Patient Care
■ Quantitative MRI of the hip may help to improve early detection and evaluation of ischemic injury, including severity of damage to the developing femoral head, which could lead to better clinical management of Legg-Calvé-Perthes disease and related ischemic bone and joint disorders.
■ Quantitative relaxation time mapping provides a possible alternative to contrast-enhanced techniques for measuring the severity of bone and marrow necrosis in pediatric patients with Legg-Calvé-Perthes disease without intravenous administration of gadolinium contrast agents.
■ The sensitivity of T1 in the rotating frame to detect necrosis of the secondary ossification center and cartilage can potentially aid in the development and evaluation of therapies for Legg-Calvé-Perthes disease.
SUPPLEMENTAL FIGURES
Acknowledgments
Acknowledgments
We thank Lindsey Harper, DVM, Brandon Hilliard, BA, and Sery Johnson, BS, for their assistance with MRI and histologic data processing. We also thank Chan-Hee Jo, PhD, for her assistance with the statistical analysis.
Study supported by National Institute of Biomedical Imaging and Bioengineering (P41 EB015894). C.P.J. supported by National Institute of Arthritis and Musculoskeletal and Skin Diseases (K01 AR070894). Study supported by W. M. Keck Foundation. Study supported by Texas Scottish Rite Hospital for Children.
Disclosures of Conflicts of Interest: C.P.J. disclosed no relevant relationships. L.W. disclosed no relevant relationships. F.T. disclosed no relevant relationships. O.A. disclosed no relevant relationships. C.S.C. Activities related to the present article: disclosed no relevant relationships. Activities not related to the present article: disclosed money paid to author from Zoetis for a consultancy; disclosed money paid to author from Elsevier for royalties. Other relationships: disclosed no relevant relationships. H.K.W.K. Activities related to the present article: disclosed no relevant relationships. Activities not related to the present article: disclosed money to author’s institution from Medivir for a research grant to investigate the role of cathepsin K inhibitor on a piglet model of ischemic osteonecrosis of the femoral head. Other relationships: disclosed no relevant relationships. J.M.E. disclosed no relevant relationships.
Abbreviations
- LCPD
- Legg-Calvé-Perthes disease
- RAFF
- relaxation along a fictitious field
- ROI
- region of interest
- SOC
- secondary ossification center
- T1ρ
- T1 in the rotating frame
References
- 1.Kim HK. Pathophysiology and new strategies for the treatment of Legg-Calvé-Perthes disease. J Bone Joint Surg Am 2012;94(7):659–669. [DOI] [PubMed] [Google Scholar]
- 2.Kim HK, Herring JA. Pathophysiology, classifications, and natural history of Perthes disease. Orthop Clin North Am 2011;42(3):285–295, v. [DOI] [PubMed] [Google Scholar]
- 3.Joseph B, Nair NS, Narasimha Rao K, Mulpuri K, Varghese G. Optimal timing for containment surgery for Perthes disease. J Pediatr Orthop 2003;23(5):601–606. [DOI] [PubMed] [Google Scholar]
- 4.Herring JA, Kim HT, Browne R. Legg-Calvé-Perthes disease. Part II: Prospective multicenter study of the effect of treatment on outcome. J Bone Joint Surg Am 2004;86-A(10):2121–2134. [PubMed] [Google Scholar]
- 5.Dillman JR, Hernandez RJ. MRI of Legg-Calvé-Perthes disease. AJR Am J Roentgenol 2009;193(5):1394–1407. [DOI] [PubMed] [Google Scholar]
- 6.Sebag G, Ducou Le Pointe H, Klein I, et al. Dynamic gadolinium-enhanced subtraction MR imaging–a simple technique for the early diagnosis of Legg-Calvé-Perthes disease: preliminary results. Pediatr Radiol 1997;27(3):216–220. [DOI] [PubMed] [Google Scholar]
- 7.Lamer S, Dorgeret S, Khairouni A, et al. Femoral head vascularisation in Legg-Calvé-Perthes disease: comparison of dynamic gadolinium-enhanced subtraction MRI with bone scintigraphy. Pediatr Radiol 2002;32(8):580–585. [DOI] [PubMed] [Google Scholar]
- 8.Kim HK, Wiesman KD, Kulkarni V, et al. Perfusion MRI in early stage of Legg-Calvé-Perthes disease to predict lateral pillar involvement: a preliminary study. J Bone Joint Surg Am 2014;96(14):1152–1160. [DOI] [PubMed] [Google Scholar]
- 9.Kim HK, Burgess J, Thoveson A, Gudmundsson P, Dempsey M, Jo CH. Assessment of femoral head revascularization in Legg-Calvé-Perthes Disease using serial perfusion MRI. J Bone Joint Surg Am 2016;98(22):1897–1904. [DOI] [PubMed] [Google Scholar]
- 10.Menezes NM, Connolly SA, Shapiro F, et al. Early ischemia in growing piglet skeleton: MR diffusion and perfusion imaging. Radiology 2007;242(1):129–136. [DOI] [PubMed] [Google Scholar]
- 11.Soares BP, Lequin MH, Huisman TAGM. Safety of contrast material use in children. Magn Reson Imaging Clin N Am 2017;25(4):779–785. [DOI] [PubMed] [Google Scholar]
- 12.Yoo WJ, Kim YJ, Menezes NM, Cheon JE, Jaramillo D. Diffusion-weighted MRI reveals epiphyseal and metaphyseal abnormalities in Legg-Calvé-Perthes disease: a pilot study. Clin Orthop Relat Res 2011;469(10):2881–2888. [DOI] [PMC free article] [PubMed] [Google Scholar]
- 13.Baunin C, Sanmartin-Viron D, Accadbled F, et al. Prognosis value of early diffusion MRI in Legg Perthes Calvé disease. Orthop Traumatol Surg Res 2014;100(3):317–321. [DOI] [PubMed] [Google Scholar]
- 14.Yoo WJ, Choi IH, Cho TJ, et al. Risk factors for femoral head deformity in the early stage of Legg-Calvé-Perthes disease: MR contrast enhancement and diffusion indexes. Radiology 2016;279(2):562–570. [DOI] [PubMed] [Google Scholar]
- 15.MacKenzie JD, Gonzalez L, Hernandez A, Ruppert K, Jaramillo D. Diffusion-weighted and diffusion tensor imaging for pediatric musculoskeletal disorders. Pediatr Radiol 2007;37(8):781–788. [DOI] [PubMed] [Google Scholar]
- 16.Gröhn OH, Lukkarinen JA, Silvennoinen MJ, Pitkänen A, van Zijl PC, Kauppinen RA. Quantitative magnetic resonance imaging assessment of cerebral ischemia in rat using on-resonance T(1) in the rotating frame. Magn Reson Med 1999;42(2):268–276. [DOI] [PubMed] [Google Scholar]
- 17.Jokivarsi KT, Hiltunen Y, Gröhn H, Tuunanen P, Gröhn OH, Kauppinen RA. Estimation of the onset time of cerebral ischemia using T1rho and T2 MRI in rats. Stroke 2010;41(10):2335–2340. [DOI] [PubMed] [Google Scholar]
- 18.Witschey WR, Pilla JJ, Ferrari G, et al. Rotating frame spin lattice relaxation in a swine model of chronic, left ventricular myocardial infarction. Magn Reson Med 2010;64(5):1453–1460. [DOI] [PMC free article] [PubMed] [Google Scholar]
- 19.Witschey WR, Zsido GA, Koomalsingh K, et al. In vivo chronic myocardial infarction characterization by spin locked cardiovascular magnetic resonance. J Cardiovasc Magn Reson 2012;14(1):37. [DOI] [PMC free article] [PubMed] [Google Scholar]
- 20.Tóth F, Nissi MJ, Wang L, Ellermann JM, Carlson CS. Surgical induction, histological evaluation, and MRI identification of cartilage necrosis in the distal femur in goats to model early lesions of osteochondrosis. Osteoarthritis Cartilage 2015;23(2):300–307. [DOI] [PMC free article] [PubMed] [Google Scholar]
- 21.Wang L, Nissi MJ, Tóth F, et al. Multiparametric MRI of epiphyseal cartilage necrosis (osteochondrosis) with histological validation in a goat model. PLoS One 2015;10(10):e0140400. [DOI] [PMC free article] [PubMed] [Google Scholar]
- 22.Tóth F, David FH, LaFond E, Wang L, Ellermann JM, Carlson CS. In vivo visualization using MRI T2 mapping of induced osteochondrosis and osteochondritis dissecans lesions in goats undergoing controlled exercise. J Orthop Res 2017;35(4):868–875. [DOI] [PMC free article] [PubMed] [Google Scholar]
- 23.Sonoda K, Motomura G, Kawanami S, et al. Degeneration of articular cartilage in osteonecrosis of the femoral head begins at the necrotic region after collapse: a preliminary study using T1 rho MRI. Skeletal Radiol 2017;46(4):463–467. [DOI] [PubMed] [Google Scholar]
- 24.Gilani IA, Sepponen R. Quantitative rotating frame relaxometry methods in MRI. NMR Biomed 2016;29(6):841–861. [DOI] [PubMed] [Google Scholar]
- 25.Ellermann J, Ling W, Nissi MJ, et al. MRI rotating frame relaxation measurements for articular cartilage assessment. Magn Reson Imaging 2013;31(9):1537–1543. [DOI] [PMC free article] [PubMed] [Google Scholar]
- 26.Kim HK, Su PH, Qiu YS. Histopathologic changes in growth-plate cartilage following ischemic necrosis of the capital femoral epiphysis. An experimental investigation in immature pigs. J Bone Joint Surg Am 2001;83-A(5):688–697. [DOI] [PubMed] [Google Scholar]
- 27.Kim HK, Su PH. Development of flattening and apparent fragmentation following ischemic necrosis of the capital femoral epiphysis in a piglet model. J Bone Joint Surg Am 2002;84-A(8):1329–1334. [DOI] [PubMed] [Google Scholar]
- 28.Joseph B, Varghese G, Mulpuri K, Narasimha Rao K, Nair NS. Natural evolution of Perthes disease: a study of 610 children under 12 years of age at disease onset. J Pediatr Orthop 2003;23(5):590–600. [DOI] [PubMed] [Google Scholar]
- 29.Perry DC, Hall AJ. The epidemiology and etiology of Perthes disease. Orthop Clin North Am 2011;42(3):279–283, v. [DOI] [PubMed] [Google Scholar]
- 30.Kim HK, Stephenson N, Garces A, Aya-ay J, Bian H. Effects of disruption of epiphyseal vasculature on the proximal femoral growth plate. J Bone Joint Surg Am 2009;91(5):1149–1158. [DOI] [PubMed] [Google Scholar]
- 31.Kothapalli R, Aya-ay JP, Bian H, Garces A, Kim HK. Ischaemic injury to femoral head induces apoptotic and oncotic cell death. Pathology 2007;39(2):241–246. [DOI] [PubMed] [Google Scholar]
- 32.Kalogeris T, Baines CP, Krenz M, Korthuis RJ. Ischemia/reperfusion. Compr Physiol 2016;7(1):113–170. [DOI] [PMC free article] [PubMed] [Google Scholar]
- 33.Lammentausta E, Silvast TS, Närväinen J, Jurvelin JS, Nieminen MT, Gröhn OH. T2, Carr-Purcell T2 and T1rho of fat and water as surrogate markers of trabecular bone structure. Phys Med Biol 2008;53(3):543–555. [DOI] [PubMed] [Google Scholar]
- 34.Catterall A, Pringle J, Byers PD, et al. A review of the morphology of Perthes’ disease. J Bone Joint Surg Br 1982;64(3):269–275. [DOI] [PubMed] [Google Scholar]
- 35.Ponseti IV, Maynard JA, Weinstein SL, Ippolito EG, Pous JG. Legg-Calvé-Perthes disease. Histochemical and ultrastructural observations of the epiphyseal cartilage and physis. J Bone Joint Surg Am 1983;65(6):797–807. [PubMed] [Google Scholar]
- 36.Li X, Majumdar S. Quantitative MRI of articular cartilage and its clinical applications. J Magn Reson Imaging 2013;38(5):991–1008. [DOI] [PMC free article] [PubMed] [Google Scholar]
- 37.Fishbein KW, Canuto HC, Bajaj P, Camacho NP, Spencer RG. Optimal methods for the preservation of cartilage samples in MRI and correlative biochemical studies. Magn Reson Med 2007;57(5):866–873. [DOI] [PubMed] [Google Scholar]
- 38.Mäkelä HI, De Vita E, Gröhn OH, et al. B0 dependence of the on-resonance longitudinal relaxation time in the rotating frame (T1rho) in protein phantoms and rat brain in vivo. Magn Reson Med 2004;51(1):4–8. [DOI] [PubMed] [Google Scholar]
Associated Data
This section collects any data citations, data availability statements, or supplementary materials included in this article.


