

Abstract
Objective
We have shown that ABCA1 mediates unfolding of the apoA1 N-terminal helical hairpin during apoA1 lipidation. Others have shown that an acidic pH exposes the hydrophobic surface of apoA1. We postulated that the vacuolar ATPase (V-ATPase) proton pump facilitates apoA1 unfolding and promotes ABCA1 mediated cholesterol efflux.
Approach and Results
We found that V-ATPase inhibitors dose dependently decreased ABCA1 mediated cholesterol efflux to apoA1 in baby hamster kidney (BHK) cells and RAW264.7 cells; and similarly, siRNA knockdown of ATP6V0C inhibited ABCA1 mediated cholesterol efflux to apoA1 in RAW264.7 cells. Although ABCA1 expression did not alter total cellular levels of V-ATPase, ABCA1 increased the cell surface levels of the V0A1 and V1E1 subunits of V-ATPase. We generated a FITC/Alexa647 double-labeled fluorescent ratiometric apoA1 pH indicator whose FITC/Alexa647 emission ratio decreased as the pH drops. We found that ABCA1 induction in BHK cells led to acidification of the cell associated apoA1 pH indicator, compared to control cells without ABCA1 expression. The V-ATPase inhibitor bafilomycin A1, dose dependently inhibited the apoA1 pH shift in ABCA1 expressing cells, without affecting the levels of cell associated apoA1. However, we were not able to detect ABCA1 mediated extracellular proton release. We showed that acidic pH facilitated apoA1 unfolding, apoA1 solubilization of phosphatidycholine:phosphatidyserine liposomes, and increased lipid fluidity of these liposomes.
Conclusions
Our results support a model that ABCA1 recruits V-ATPase to the plasma membrane where V-ATPase mediates apoA1 acidification and membrane remodeling that promote apoA1 unfolding and ABCA1 mediated HDL biogenesis and lipid efflux.
Keywords: ABCA1, vacuolar ATPase, apoA1 acidification, apoA1 lipidation, Lipids and Cholesterol, Cell Biology/Structural Biology
High density lipoprotein (HDL) cholesterol levels are inversely correlated with coronary heart disease in epidemiological studies;1 however, whether high HDL directly lowers atherosclerotic disease in humans has been questioned by recent drug trials and a mendelian randomization study.2, 3 Nevertheless, raising HDL levels in mice via over expression of human apolipoprotein A1 (apoA1) has consistently reduced atherosclerosis in mouse models.4, 5 The anti-atherogenic property of HDL is partly attributed to its role in reverse cholesterol transport. This pathway starts with apoA1 interacting with cellular ATP cassette binding protein A1 (ABCA1) to assemble cellular free cholesterol and phospholipids to form nascent HDL (nHDL). We have shown that ABCA1 mediates the unfolding of apoA1’s N-terminal helical hairpin,6 and proposed a model for the mechanism of ABCA1 mediated nHDL assembly.7 ABCA1 mediates the outward translocation (floppase activity) of two phospholipid species, phosphatidylserine (PS) 8 and phosphatidylinositol (4,5) bisphosphate (PIP2), and these two floppase activities are independent of each other and mediated by different extracellular loops of the ABCA1 protein.9 The PIP2 floppase activity of ABCA1 is both necessary and sufficient to promote the cellular binding of apoA1.9 Once bound to ABCA1 expressing cells, ABCA1 then mediates the partial unfolding of the N-terminus of apoA1. The unfolded apoA1 is subject to spontaneous lipidation, which resolves in the release of nHDL from the cell.6
Vacuolar ATPase (V-ATPase) resides within many intracellular compartments, including the endosomal/lysosomal membrane where it pumps protons into the organelle to lower vesicle pH.10 V-ATPase has also been identified on the plasma membrane in osteoclasts, renal intercalated cells, and macrophages.11–14 V-ATPase is composed of a peripheral cytoplasmic domain (V1, eight subunits), which is responsible for ATP hydrolysis, and an integral membrane domain (V0, six subunits), which is involved in proton translocation across the membrane. Fukuda et al. demonstrated that lipid-free apoA1 undergoes a conformational change exposing its hydrophobic regions under acidic pH, leading to the acceleration of reconstituted HDL (rHDL) formation from egg phosphatidycholine (PC):PS liposomes.15 Others have shown that incubation of plasma HDL at acidic pH enhances its cholesterol efflux capacity due to HDL remodeling and the release of lipid-poor/lipid-free apoA1.16 Thus, we postulated that the acidifying ability of V-ATPase may play a role in the ABCA1 mediated apoA1 unfolding and lipidation.
In our current study, we showed that cholesterol efflux to apoA1 is blocked by V-ATPase inhibitors in ABCA1 stably transfected baby hamster kidney (BHK) and RAW264.7 cells, and also inhibited by siRNA knockdown of ATP6V0C in RAW264.7 cells. We demonstrated that ABCA1 does not alter total cellular levels of V-ATPase, but interestingly, ABCA1 increased the cell surface levels of the V0A1 and V1E1 subunits of V-ATPase. Using a fluorescent ratiometric apoA1 pH indicator by flow cytometry, we found that incubation of the apoA1 pH indicator with ABCA1 expressing cells at 37oC led to apoA1 acidification, and V-ATPase inhibitor dose-dependently eliminated the apoA1 acidification in the ABCA1 expressing cells. However, we didn’t detect extracellular acidification mediated by ABCA1 induction. We found that unfolding of apoA1 tertiary structure is facilitated at acidic pH, as is membrane fluidity in PC:PS liposomes. Therefore, our data supports a model that ABCA1 brings V-ATPase to the plasma membrane where the V-ATPase can promote membrane remodeling and cellular apoA1 acidification and unfolding, which are required for ABCA1 mediated nHDL biogenesis and cholesterol efflux.
Materials and Methods
The data that support the findings of this study are available from the corresponding author upon reasonable request.
Cholesterol efflux
Cholesterol efflux experiments were performed according to established procedures 17 with minor modification. On day 1, BHK cells were plated onto a 24-well plate at a density of 150,000 cells per well. On day 2, the cells were labeled with 3H cholesterol. On day 3, the cells were treated with 10 nM mifepristone for 16 hr to induce ABCA1 expression.18 On day 4, the cells were washed and chased for 4 hr in serum-free medium and the presence or absence of 5 μg/ml human apoA1. The radioactivity in the chase media was determined after brief centrifugation to pellet debris. Radioactivity in the cells was determined by extraction in hexane:isopropanol (3:2) with the solvent evaporated in a scintillation vial prior to counting. The percent cholesterol efflux was calculated as 100 × (medium dpm) / (medium dpm + cell dpm). ApoA1 efflux from RAW264.7 cells was performed as previously described using a 16 hr treatment with 0.3 mM 8Br-cAMP to induce ABCA1.17
siRNA transfection with nucleofector and TransIT-TKO
Detailed methods are found in the online-only Data Supplement.
Quantitative real time PCR
Detailed methods are found in the online-only Data Supplement.
Detection of lysosomal/endosomal acidification
BHK cells or RAW cells transfected with ATP6V0C or scramble siRNA, were incubated with fluorescein and tetramethylrhodamine (TMR) dual-labeled dextran (D1951, Thermo Fisher) for 16 hr, and chased in phenol red free medium for 1 hr, in the presence or absence of bafilomycin A1 (sc-201550A, Santa Cruz). Cellular fluorescein and TMR intensity were measured by flow cytometry. The fluorescein /TMR ratio of every cell was calculated in order to plot frequency histograms displaying the lysosomal/endosomal acidification range for ~10,000 cells for each condition.
Total and cell-surface V-ATPase detection and quantification
BHK cells were cell surface biotinylated, and cell surface proteins were pulled down using streptavidin beads. V-ATPase subunits were detected by western blot. Detailed methods are found in the online-only Data Supplement. All antibody sources and concentrations please see the Major Resources Table in the Supplemental Material.
Cellular V-ATPase localization
BHK cells were incubated in the absence or presence of 10 nM mifepristone to induce ABCA1 expression. For cellular V-ATPase localization, BHK cells were fixed with 4% paraformaldehyde, and permeabilized with 0.2% Trinton X-100. Cells were stained with 1 μg/ml rabbit polyclonal antibody raised against V-ATPase V0A1 antibody (sc-28801, Santa Cruz) at room temperature for 1 hr, and probed with 2 μg/ml Alexa568-conjugated goat anti-rabbit secondary antibody (A-11036, Thermo Fisher). All images were captured using an Olympus IX51 inverted epifluorescent microscope with a Q-Image EXi aqua camera and Olympus cellSens 1.7 software.
ApoA1 pH indicator
To make the apoA1 pH indicator, human plasma apoA1 was doubly-labeled on free amines with fluorescein isothiocyanate (FITC), whose fluorescence decreases in an acidic environment, and Alexa647. Human apoA1 was dissolved in 0.1 M sodium bicarbonate buffer and incubated with fluorescein-5-isothiocyanate (F143, Molecular probes, dissolved in DMSO) and Alexa647 carboxlic acid succinimidyl ester (A20006, Molecular Probes, dissolved in DMSO) for 1 hour at room temperature (6:3:1 dye:dye:protein mole ratio). The reaction was stopped by adding 0.1 ml of freshly prepared 1.5 M hydroxylamine, pH 8.5, and further incubation for 1 hour. The conjugate was purified by extensive dialysis. The fluorescence ratio of FITC (excitation at 460 nm and emission at 540 nm) to Alexa647 serves as an indicator of apoA1 pH. ApoA1 pH indicator was validated in sodium phosphate buffers at pH values ranging from 4.7 to 8.0. To measure cellular apoA1 acidification, cells were incubated with 1 μg/ml FITC/Alexa647 labeled apoA1 for 45 min at 37 oC in phenol red free medium. For experiments where V-ATPase inhibitors were used, the identical concentration used for the pretreatment was added during the 45 min incubation with the apoA1 pH indicator probe. Cells were scraped and used for flow cytometry. Fluorescent data from each cell was exported and the FITC/Alexa647 ratio was calculated in order to plot frequency histograms displaying the apoA1 acidification range for ~10,000 cells for each condition, with values normalized to the non-ABCA1 induced cells.
Measuring extracellular acidification using the Seahorse XF24 analyzer
Detailed methods are found in the online-only Data Supplement.
ApoA1 guanidine denaturation
ApoA1 was prepared at 50 μg/ml in increasing concentration of guanidine hydrochloride in sodium phosphate buffer (pH 5 and 7.5). The tryptophan fluorescence spectra of each sample was measured using a SpectraMax M2e plate reader with an excitation fixed at 290 nm and emission from 300 to 450 nm at 23oC. The wavelength of maximum fluorescence (WMF) was determined, which is dependent upon the apoA1 tryptophan environment, with a red shift observed as tryptophan goes from a hydrophobic to an aqueous environment.
Liposome clearance assay
Detailed methods are found in the in the online-only Data Supplement.
Surface plasmon resonance to assess apoA1 binding to LUVs
Egg PC:POPS (8:2 mole ratio) LUVs containing 0.1% phosphatidylethanolamine (PE)-Biotin in acetate buffer (pH 4.5) and phosphate buffer (pH 7.1) were prepared as described above. Surface plasmon resonance experiments were performed at 37oC on a Biacore 3000 using the streptavidin conjugated Sensor Chip SA (BR-1000–32). LUVs containing 0.1% biotinylated PE at a concentration of 30 μg/ml were bound to the streptavidin chip. Human apoA1 (25 μg/ml) at pH 7.1 or pH 4.5 was injected as indicated onto the sensor to probe the mass change on the sensor.
DPH fluorescence anistropy
Egg PC:POPS:diphenylhexatriene (DPH, Sigma) (8:2:0.2 mole ratio) LUVs were prepared as described above. DPH anisotropy was used to compare membrane fluidity as previously described.19 Polarized emission of the DPH-labeled LUVs and apoA1 lipid complexes was measured at pH 7.1 and pH 4.5 over various temperatures using Polaroid filters in a Perkin-Elmer LS50B. DPH fluorescence anisotropy, r, was measured with excitation at 357 nm and emission at 427 nm, using 10 nm bandwidths, and calculated using software built into the Perkin-Elmer LS50B spectrophotometer.
Statistics
Data are shown as mean ± SD. Comparisons of 2 groups were performed by a 2-tailed t test, and comparisons of 3 or more groups were performed by ANOVA with Tukey posttest. All statistics were performed using Prism V7.03 software (GraphPad).
Results
Inhibition of V-ATPase blocks ABCA1 mediated cholesterol efflux
Bafilomycin A1 and concanamycin A are highly specific V-ATPase inhibitors that raise lysosomal pH and inhibit lysosome function. In order to determine whether V-ATPase is required in the ABCA1 mediated cholesterol efflux to apoA1, we performed cholesterol efflux assay in the presence of bafilomycin A1 in BHK cells. Human ABCA1 expression in stably transfected BHK cells was induced by mifepristone, and as previously described.18 Cholesterol efflux to apoA1 was highly induced in these cells upon ABCA1 induction (Figure 1A). We observed that a 16 hr pretreatment with bafilomycin A1 at 5 to 15 nM concentrations greatly inhibited ABCA1 mediated cholesterol efflux to apoA1 (Figure 1A, P<0.0001 for different doses by ANOVA posttest, efflux inhibited by 63% at 15 nM), but we chose not to use this condition in our following experiments to avoid secondary effects in response to prolonged lysosomal inhibition, such as induction of TFEB and lysosome biogenesis.20 We found that a 1 hr pretreatment with 10 nM or 10 μM bafilomycin A1 dose dependently inhibited ABCA1 mediated cholesterol efflux to apoA1 by 28% and 88%, respectively (Figure 1B, P<0.001 for both doses by ANOVA posttest). We repeated cholesterol efflux assay in the presence of bafilomycin A1 in RAW264.7 cells, in which ABCA1 expression is inducible by 8-Br-cAMP.21 ABCA1 mediated cholesterol efflux to apoA1 was dose dependently inhibited by 5 to 15 nM bafilomycin A1 with 16 hr pretreatment (Figure IA in the online-only Data Supplement), and 10 nM to 10 μM bafilomycin A1 with 1 hr pretreatment (Figure IB in the online-only Data Supplement) in RAW cells. Another V-ATPase inhibitor, concanamycin A similarly inhibited cholesterol efflux to apoA1 in a dose dependent manner with 1 hr pretreatment in BHK cells (Figure IC in the online-only Data Supplement). To further confirm the role of V-ATPase in ABCA1 mediated cholesterol efflux, we performed siRNA knockdown of ATP6V0C, which is the bafilomycin A1 binding subunit of V-ATPase, in RAW264.7 cells (BHK cells lack commercially available siRNA). Using quantitative real time PCR analysis with β-actin mRNA expression as an internal standard, we showed that ATP6V0C mRNA expression was significantly reduced by 72% after Nucleofection with ATP6V0C siRNA (Figure 1C, P<0.0001), and ABCA1 mediated cholesterol efflux to apoA1 was inhibited by 44% (Figure 1D, P<0.0001 by ANOVA posttest). We replicated this inhibitory effect of ATP6V0C knockdown on cholesterol efflux with ATP6V0C siRNA tranfected by TransIT-TKO method (Figure ID and IE in the online-only Data Supplement). Therefore, both pharmacological inhibition and gene silencing of V-ATPase are able to inhibit ABCA1 mediated cholesterol efflux to apoA1. The mitochondrial F-ATPase inhibitors, IF1 and piceatannol did not inhibit ABCA1 mediated cholesterol efflux to apoA1 (Figure IIA and IIB in the online-only Data Supplement), further indicating the unique role of the lysosomal V-ATPase in ABCA1-mediated cholesterol efflux.
Figure 1. Inhibition of V-ATPase blocks ABCA1 mediated cholesterol efflux.

ABCA1 induced (black bars) and non-induced (open bars) BHK cells were pretreated with 5 nM to 15 nM bafilomycin A1 for 16 hr (A), or 10 nM or 10 μM bafilomycin A1 for 1 hr (B), and % [3H]cholesterol efflux was determined after a 4 hr chase +/− 5 μg/ml apoA1 (N=3; mean ± SD; groups with different letters above the bars show P≤0.005 by ANOVA posttest). RAW264.7 cells were transfected with scramble or ATP6V0C siRNA by Nucleofection and ATP6V0C mRNA levels were measured by qPCR analysis normalized to β-actin mRNA (C, N=3; mean ± SD; P<0.0001), or % [3H]cholesterol efflux was calculated after a 4 hr incubation +/− 5 μg/ml apoA1 (D, N=3; mean ± SD; groups with different letters above the bars show P<0.001 by ANOVA posttest). E. BHK cells were incubated with fluorescein and tetramethylrhodamine (TMR) dual-labeled dextran for 16 hr, and chased in the absence (circles) or presence of 10 nM (triangles) or 10 μM (squares) bafilomycin A1 for 4 hr. Fluorescein/TMR ratio was measured by flow cytometry to show endosomal/lysosomal acidification. Plot shows frequency histogram of Fluorescein/TMR ratio; representative of 3 independent experiments. F. RAW264.7 cells were transfected with scramble (circles) or ATP6V0C (triangles) siRNA by Nucleofection, or treated with 10 μM bafilomycin A1 (squares). The frequency histogram of Fluorescein/TMR ratio of endocytosed dual labeled dextran was plotted as in E; representative of 3 independent experiments.
We then measured the effect of a 1 hr treatment of 10 nM and 10 μM bafilomycin A1 on lysosomal/endosomal pH after the uptake of a commercially available fluorescein and tetramethylrhodamine (TMR) dual-labeled dextran. As pH increases in the intracellular vesicles due to bafilomycin A1 treatment, the fluorescein/TMR emission ratio increases. We measured cellular fluorescein and TMR intensity by flow cytometry, and plotted the frequency distribution of the fluorescein/TMR ratio in ~10,000 cells. This assay demonstrated incomplete inhibition of lysosome acidification by 10 nM bafilomycin A1, compared to 10 μM bafilomycin A1 (Figure 1E), thus justifying the use of the higher dose in our study. We also performed the same assay in RAW cells following ATP6V0C siRNA knockdown. ATP6V0C knockdown increased lysosomal/endosomal pH attaining ~half of the effect of 10 μM bafilomycin A1 (Figure 1F), which goes along with its less prominent inhibitory effect on cholesterol efflux (Figure 1D).
In order to determine the effect of inhibiting lysosomal proteolysis on ABCA1 dependent cholesterol efflux, BHK cells were incubated with the lysosomal protease inhibitor leupeptin; and we found no effect on cholesterol efflux to apoA1 (Figure III in the online-only Data Supplement). In order to determine if increasing lysosomal pH without V-ATPase inhibition also inhibited ABCA1-mediated cholesterol efflux, we pretreated cell with the weak base ammonium chloride that also increases lysosomal pH, and we observed a small 10.7% decrease in cholesterol efflux to apoA1 (Figure IVA in the online-only Data Supplement). Using the dual-labeled dextran assay, we found that 20 mM ammonium chloride and 10 μM bafilomycin A1 both resulted in the same increase in lysosomal pH (Figure IVB in the online-only Data Supplement). Thus bafilomycin A1 and ammonium chloride increased endosomal/lysosomal pH to the same extent, while only the V-ATPase inhibitor strongly decreased cholesterol efflux to apoA1.
ABCA1 increases cell surface V-ATPase
Since V-ATPase inhibitors blocked ABCA1 mediated cholesterol efflux, we measured whether ABCA1 induction altered the level of V-ATPase. Western blots of control and ABCA1 induced cells demonstrated that the total cellular levels of the V0A1 and V1E1 subunits were not changed by ABCA1 induction; however, the cell surface levels of the V0A1 and V1E1subunits, detected by cell surface biotinylation, were increased by ABCA1 induction (Figure 2A, entire blots available in Figure VA and VB in the online-only Data Supplement). We blotted GAPDH in the biotinylation assay as whole cell protein control. The loading was similar in four lanes of whole cell lysate, and there was no contamination from intracellular protein GAPDH in four lanes of cell surface lysate (Figure VI in the online-only Data Supplement). The increase in cell surface V-ATPase was further confirmed by flow cytometry using fixed but unpermeabilized cells stained for V0A1, where ABCA1 induction led to a 59% increase in cell surface V-ATPase (P=0.0.004, Figure 2B). Immunofluorescence microscopy of permeabilized cells stained for V0A1 also confirmed that cell surface V-ATPase was increased upon ABCA1 induction (Figure 2C). Furthermore, the ABCA1 mediated increase in cell surface V-ATPase was not affected by bafilomycin A1 treatment (Figure 2C). Therefore, ABCA1 recruits V-ATPase to the cell surface.
Figure 2. ABCA1 increases V-ATPase on the cell surface.
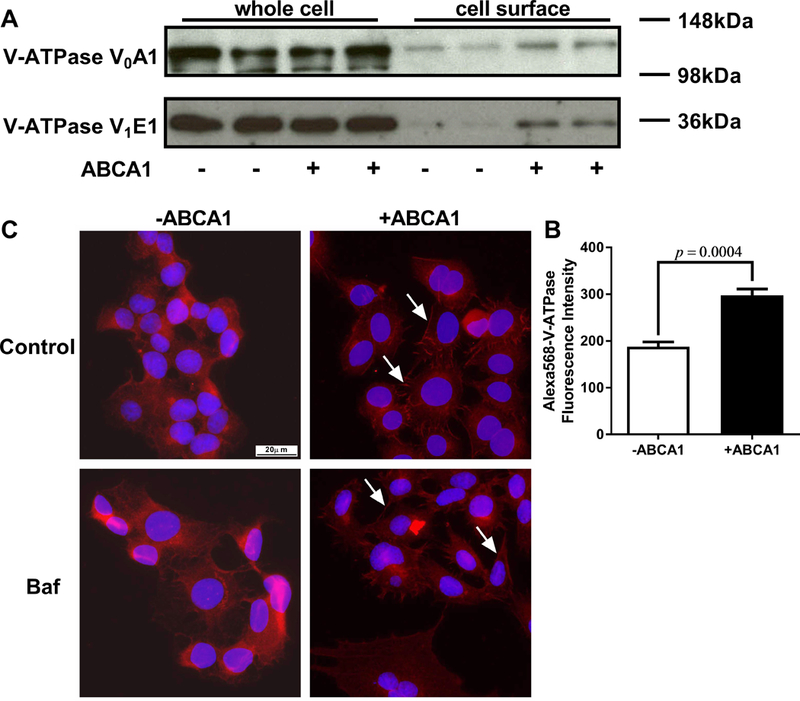
A. Cell surface proteins from ABCA1 induced and non-induced BHK cells were biotinylated, treated with the cell permeable cross linker DSP, and separated from the cellular lysate by streptavidin pull down. Total and cell surface V-ATPase subunits were detected by Western blot analysis. B. ABCA1 induced and non-induced BHK cells were fixed without permeabilization and were stained with antibody against V-ATPase V0A1. Flow cytometry was used to measure cell surface V-ATPase (N=3; mean ± SD; P=0.0004). C. ABCA1 induced and non-induced BHK cells were pretreated +/−10 μM bafilomycin A1 for 1 hr, fixed, permeabilized, and stained with antibody against V-ATPase V0A1 followed by epifluorescent microscopy (40× objective) for V-ATPase (red) and DAPI (blue). ABCA1 expression increased the level of V-ATPase on the cell surface (white arrows) independent of bafilomycin A1 treatment.
ABCA1 induces apoA1 acidification mediated by V-ATPase
To investigate whether apoA1 is acidified at the presence of ABCA1 expression, we designed a fluorescent ratiometric apoA1 pH indicator using the pH sensitive and insensitive dyes fluorescein isothiocyanate (FITC) and Alexa647, respectively. This apoA1 pH indicator was validated in solution assay showing that FITC/Alexa647 emission ratio decreased as the pH goes down, with an EC50 of pH 6.6 (Figure 3A). Furthermore, the FITC/Alexa647 labeled apoA1 retained full cholesterol acceptor activity compared to unmodified apoA1 (Figure 3B). Human ABCA1 expression induced by mifepristone in BHK cells led to increased apoA1 uptake; and, the nonspecific apoA1 uptake in cells without ABCA1 induction is also detectable and sufficient for use of our ratiometric apoA1 pH indicator (Figure 3C). We measured cellular FITC and Alexa647 intensity by flow cytometry, and plotted the frequency distribution of the FITC/Alexa647 ratio in ~10,000 cells. Incubation of the apoA1 pH indicator with ABCA1 induced vs. non-induced BHK cells for 45 min at 37oC led to a large shift of FITC/Alexa647 ratio to the left, indicating a lower pH of the apoA1 indicator in ABCA1 expressing cells (Figure 3D). We replicated the result in RAW264.7 cells with ABCA1 induced by 8-Br-cAMP (Figure VII in the online-only Data Supplement). The acidification of cell associated apoA1 is expected based on prior work showing that apoA1 is taken up by endosomes, in an ABCA1-dependent manner, with a fraction delivered to lysosomes and a fraction being resecreted by retroendocytosis.22–26 We repeated the above apoA1 pH indicator studies in cells pretreated for 1 hr with 10 nM or 10 μM bafilomycin A1. 10 nM bafilomycin A1 partially blocked the ABCA1-induced apoA1 acidification (Figure 4A), while 10 μM bafilomycin A1 completely blocked the ABCA1-induced apoA1 acidification (Figure 4B). 10 μM bafilomycin A1 treatment did not inhibit the uptake of Alexa647-labeled apoA1, as assed by flow cytometry (Figure 4C). We also found that a 16 hr pretreatment with 10 nM bafilomycin A1 inhibited most of the ABCA1-induced apoA1 acidification (Figure VIII in the online-only Data Supplement). In addition, bafilomycin A1 treatment of the BHK cells did not block ABCA1 dependent cholesterol efflux to the weak detergent sodium taurocholate (2 mM, Figure IX in the online-only Data Supplement). Thus, the ABCA1-dependent apoA1 acidification requires V-ATPase activity that mediates apoA1 acidification.
Figure 3. ABCA1 promotes apoA1 acidification.
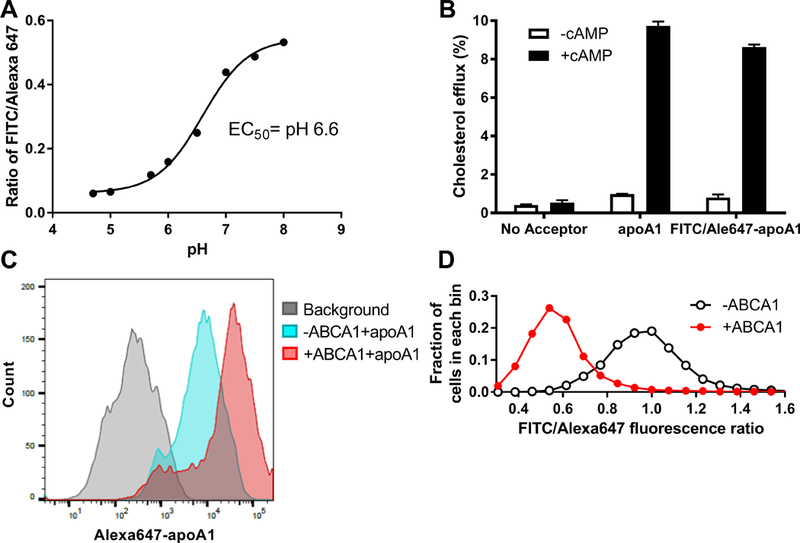
A. ApoA1 was double-labeled with FITC/Alexa647 as pH indicator. In solution studies, FITC/Alexa647 emission ratio decreased as the pH decreased, with an EC50 of pH 6.6. B. The cholesterol acceptor activity of FITC/Alexa647 labeled apoA1 was comparable to unlabeled apoA1, as tested in RAW264.7 cells with or without ABCA1 induction (N=3, mean ± SD). C. ABCA1 induced and non-induced BHK cells were incubated with 1 μg/ml FITC/Alexa647 apoA1 for 45 min at 37oC. ApoA1 cellular uptake was induced by ABCA1 expression as determined by flow cytometry of the Alexa647 florescence intensity; representative of 3 independent experiments. D. ABCA1 expression led to acidification of the cell associated apoA1 as determined by the FITC/Alexa647 ratio measured by flow cytometry. Plot shows the frequency histogram of FITC/Alexa647 ratio; representative of 3 independent experiments.
Figure 4. Inhibition V-ATPase by bafilomycin A1 inhibits apoA1 acidification.
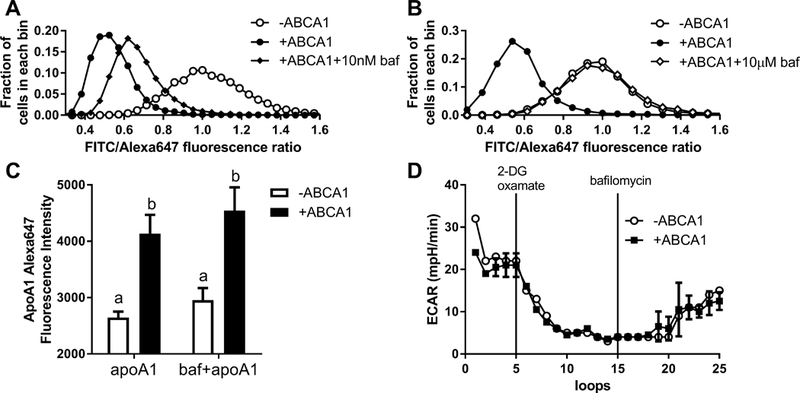
ABCA1 induced and non-induced BHK cells were pretreated +/− 10 nM (A) or 10 μM (B) bafilomycin A1 for 1 hr. Cells were then incubated with 1 μg/ml FITC/Alexa647 apoA1 for 45 min at 37oC +/− bafilomycin A1 followed by flow cytometry to measure the FITC/Alexa647 ratio as indication of apoA1 acidification. Plot shows the frequency histogram of FITC/Alexa647 ratio; representative of 3 independent experiments. C. FITC/Alexa647 labeled apoA1 uptake by BHK cells with or without ABCA1 induction was not inhibited by treatment with 10 μM bafilomycin A1 for 1 hr, as assessed by Alexa647 flow cytometry (N=3, mean ± SD, different letters above the bars show P<0.05 by ANOVA posttest). D. ABCA1 induced and non-induced BHK cells extracellular acidification rate (ECAR) in the medium was measured by Seahorse in a time course for 25 loops (9 min/loop). 2-deoxyglucose and oxamate were injected at the loop 5 to inhibit the lactic acid production by glycolysis. At loop 15, 10 μM bafilomycin A1 was injected to cells to inhibit V-ATPase (N=3; mean ± SD; representative of ≥ 3 independent experiments).
ABCA1 does not increase extracellular proton release
V-ATPase normally pumps protons into the endosome/lysosome to lower vesicle pH. However, when the endosome/lysosome fuses with the plasma membrane, V1 domain will be on the cytoplasmic side of the membrane and protons would be pumped from the cytoplasm to the extracellular environment.27 Since ABCA1 induces apoA1 acidification and increases cell surface V-ATPase, we examined if ABCA1 increases V-ATPase activity to pump protons out of cells. Using an XF24 Seahorse Analyzer, we measured the extracellular acidification rate (ECAR), which detects acid released by the cells into the medium. Glycolysis and lactic acid release is the major contributor to ECAR; therefore, we used 2-deoxyglucose to inhibit the rate-limiting enzyme of glycolysis, and oxamate to inhibit non-glycolytic pyruvate conversion to lactic acid. We examined ECAR in BHK cells over a time course and demonstrated that inhibition of glycolysis decreased ECAR as expected (Figure 4D). However, there was no difference in ECAR between ABCA1 induced and non-induced BHK cells. After adding the V-ATPase inhibitor bafilomycin A1 to cells, we didn’t observe a further decrease of ECAR, but a slow increase over time. Similar results were obtained with the V-ATPase inhibitor concanamycin A (Figure X in the online-only Data Supplement). Thus, despite the increase in cell surface V-ATPase in ABCA1 expressing cells, there was no detectable increase in acid released from the cells to the media, nor was V-ATPase activity responsible for the baseline acid release from these cells.
Acidic pH dependent apoA1 unfolding and rHDL formation
To directly observe whether acidic pH facilitates apoA1 unfolding, we performed an apoA1 guanidine denaturation study. ApoA1 has 4 tryptophan residues, which are largely protected from the aqueous environment, and aqueous exposure of the tryptophan residues induced by increasing concentrations of guanidine can be assessed by a red shift in the peak fluorescent emission wavelength. As the guanidine concentration was increased from 0 to 3 M at neutral pH (pH=7.5), apoA1 exhibited a wavelength of maximum fluorescence (WMF) shift from 352.2 nm to 367.6 nm, with an EC50 of 0.94 M guanidine (Figure 5A). Upon repeating this study at pH=5.0, we observed a similar WMF shift of apoA1 from 351.5 nm to 368.0 nm. However, the EC50 at pH=5.0 was 0.75 M guanidine, showing that apoA1 unfolding in guanidine was facilitated at acidic pH. rHDL is easily formed from large unilamellar vesicles (LUVs) made up of the non-physiological phospholipid dimyristoylphosphatidylcholine upon incubation with lipid-free apoA1 at 21oC; however; LUVs made from physiological palmitoyloleoylphosphatidylcholine (POPC) or egg PC, are not solubilized by apoA1 to form rHDL.15, 28 Fukuda et al. demonstrated that LUVs made with egg PC or PC:PS (8:2) could be solubilized by apoA1 at 37oC, but only at low pH.15 We reproduced this finding using LUVs made of egg PC:palmitoyloleoylphosphatidyserine (POPS) (8:2 mole ratio), showing solubilization by apoA1 at pH < 6.0, in a pH dependent fashion (Figure 5B). Furthermore, we confirmed this finding by surface plasmon resonance to follow the interaction of injected apoA1 and immobilized egg PC:POPS (8:2 mole ratio) LUVs. At pH 7.1, apoA1 didn’t exhibit binding to LUVs, and did not solubilize the LUVs, but at pH 4.5, injected apoA1 led to a transient rise in apparent mass on the chip, as the apoA1 bound to LUVs, then led to a steady state decrease in total mass on the chip presumably due to the formation and release of rHDL (Figure 5C). In addition, we also discovered that acidic pH directly increased lipid disorder in the egg PC:POPS LUVs, as measured by diphenylhexatriene (DPH) anisotropy, particularly at physiological temperatures (Figure 5D). Thus, lowered pH destabilized the tertiary structure of apoA1, increased lipid disorder in the LUVs, and led to rHDL formation from physiological liposomes.
Figure 5. ApoA1 unfolding and liposome solubilization are facilitated at acidic pH.
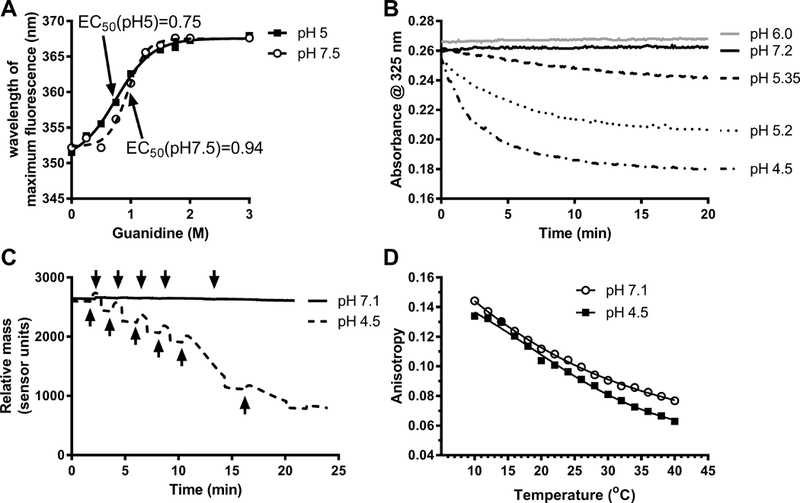
. A. ApoA1 unfolding in presence of increasing concentration of guanidine hydrochloride at pH 7.5 and 5 assessed by the shift in the wavelength of maximal fluorescence (WMF) of endogenous tryptophan residues (representative of 2 independent experiments). B. LUV (egg PC: POPS, 8:2 mole ratio) clearance was followed at different pH values, as indicated, by absorbance at 325 nm. Phospholipids and apoA1 final concentrations were 100 μM and 1 μM, respectively (representative of 3 independent experiments). C. Surface plasmon resonance was used to follow the interaction of apoA1 and PC:POPS LUVs containing 0.1% biotinylated PE at pH 7.1 and 4.5. ApoA1 (25 μg/ml) was injected (black arrows) onto the sensor with immobilized LUVs (30 μg/ml) bound to the streptavidin chip. At pH 7.1 (solid line), apoA1 didn’t exhibit binding to LUVs, but at pH 4.5 (dashed line), injected apoA1 led to a transient rise in apparent mass on the chip, as the apoA1 bound to LUVs, then led to a steady state decrease in total mass due to formation of rHDL (representative of 2 independent experiments). D. Acidic pH directly increased membrane fluidity in PC:POPS LUVs labeled with 0.2% DPH, with DPH anisotropy used to assess membrane fluidity over various temperatures.
Discussion
The ATP binding cassette (ABC) gene family is found in organisms ranging from bacteria to humans, and includes hundreds of different proteins, many acting as transporters. Prior examples of various ABC proteins in maintaining low pH in organelles has been shown in several species. For example, in Dictyostelium, the ABC transporter mdrA1/mdrA2 is required for the acidification of endosomes.29 The Caenorhabditis elegans ABC transporter pgp-2 plays a direct role in regulating intestinal lysosome biogenesis and acidification.30, 31 The Plasmodium faciparum ABC transporter Pgh1 regulates acidification of vacuoles; and, Pgh1 is speculated to function as a chloride channel or regulator of V-ATPase.32 Here we demonstrated that ABCA1 recruits V-ATPase to the cell surface, without changing the total levels of V-ATPase, and that inhibition of V-ATPase greatly impairs ABCA1-mediated cholesterol efflux. It is possible that ABCA1 mediated increased exocytosis, decreased endocytosis, and/or increased endosome recycling could be a mechanism responsible for increased V-ATPase level on the plasma membrane. ABCA1 is a large ABC gene family protein with 12 transmembrane domains, two large extracellular domains, and two ATP binding domains. We previously demonstrated that ABCA1 is a PIP2 floppase, and that cell surface PIP2 is required for cellular apoA1 binding.9 The previously demonstrated PS floppase activity of ABCA1 is inhibited by mutations in the first large extracellular domain,33, 34 while we showed that mutations in the second large extracellular domain inhibit PIP2 floppase and apoA1 cellular binding.9 Although bafilomycin A1 inhibited ABCA1-mediated cholesterol efflux to apoA1, ABCA1-dependent cholesterol efflux to sodium taurocholate was not inhibited by bafilomycin A1 treatment. Since ABCA1-dependent efflux to sodium taurocholate requires the PS floppase activity of ABCA1 (efflux to sodium taurocholate is disrupted by the same mutations in the first large extracellular domain of ABCA1),6, 34 we can infer that bafilomycin A1 did not inhibit the PS floppase activity of ABCA1. In addition, since apoA1 cellular binding was not altered by bafilomycin A1, we can infer that the PIP2 floppase activity of ABCA1 was not inhibited by bafilomycin A1 treatment.
V-ATPase, in addition to residing in endosomes/lysosomes, has also been found on the plasma membrane in mammalian cells.11–14 V-ATPase on the plasma membrane of osteoclasts forms an acidic extracellular compartment to promote bone reabsorption, and mice deficient in Tcirg1 (gene encoding V-ATPase subunit V0A3, previously called Atp6i) exhibit severe osteopetrosis due to loss of extracellular acidification and impaired bone remodeling.11 Maxfield and colleagues have shown that cell surface V-ATPase in macrophages can create a transiently sealed acidic extracellular hydrolytic compartment that promotes the digestion of aggregated low-density lipoprotein.14 Thus, there is precedence for the regulated activity of V-ATPase on the plasma membrane. In our current study, ABCA1 induction in BHK cells did not lead to a decrease in the extracellular pH that we could detect using the Seahorse ECAR assay, perhaps this could be due to lack of sufficient sensitivity of this assay. The lack of detectable extracellular acidification could also be due to a passive diffusion of secreted protons back across the plasma membrane down their electrochemical gradient into the cell,35 or via an active transporter such as the potassium-proton antiporter.36 Alternatively, this situation could be similar to what Maxfield observed with the formation of a transiently sealed compartment on the plasma membrane so that the V-ATPase extruded protons did not reach the bulk extracellular medium.
ABCA1 resides not only on the plasma membrane, but also in intracellular vesicles, including early/late endosomes, which transfer ABCA1 to and from the plasma membrane.23 Moreover, intracellular apoA1 traffics in the ABCA1 containing vesicles to the perinuclear region and back to the cell surface.24 We previously showed that apoA1 could be taken up by endocytosis into macrophages, in an ABCA1-dependent manner, and resecreted as nHDL, and that blocking endocytosis impairs lipid efflux to apoA1.22 Others have shown that intracellular pools of cholesterol constituted the major cholesterol source for ABCA1-mediated cholesterol efflux to apoA1.37 Genest demonstrated that resecretion of apoA1 from intracellular compartments is faster than from plasma membrane.25 In addition, ABCA1-mediated lipid efflux has delayed kinetics and is abolished at room temperature, results that are also consistent with a role for endocytosis and vesicular trafficking in this process.38 Interestingly, when ABCA1 and apoA1 internalization is blocked, cholesterol efflux from cells that have accumulated intracellular cholesterol is decreased, whereas efflux from cells without intracellular cholesterol accumulation is increased.26 Thus, the retroendocytosis pathway may contribute to HDL formation by macrophages when excess cholesterol has accumulated inside the cell. Since ABCA1, apoA1 and V-ATPase are all found together in endosomes, it is possible that V-ATPase acidification of the endosome lumen may facilitate the lipidation of apoA1 and nHDL generation. However, it is clear that nHDL assembly and lipid efflux can also occur on the plasma membrane.39 In macrophages that were not cholesterol loaded, it has been calculated that the amount of intact apoA1 resecreted from the cells is not sufficient to account for the HDL produced by the cholesterol efflux reaction.26 In this scenario, increased V-ATPase on the plasma membrane in ABCA1-expressing cells may facilitate apoA1-mediated efflux on the cell surface. Our current study found that ammonium chloride increased lysosomal pH, but did not inhibit ABCA1-mediated cholesterol efflux. This implicates that plasma membrane V-ATPase activity was required for ABCA1-mediated cholesterol efflux. Although, early endosomal acidification may not be abrogated by ammonium chloride, and V-ATPase activity in this compartment may also increase ABCA1-mediated cholesterol efflux.
The V-ATPase has a similar structure to the mitochondrial F0F1 ATP synthase, and both use molecular motors to transport protons linked to ATP hydrolysis or synthesis. Interestingly, the F1 β-chain subunit (ATP5F1B gene), and possibly other subunits, is expressed ectopically on the surface of hepatocytes and endothelial cells, where it can serve as a receptor for apoA1 to mediate HDL uptake or transcytosis.40, 41 siRNA knockdown of the β-chain or treatment with an ATP synthase inhibitory peptide IF1 reduced cell binding of apoA1 in endothelial cells.41 The murine F1 β-chain amino acid sequence has 20.5% identity with the murine V-ATPase V1B subunit. It is possible that the V1B subunit of the V-ATPase could also promote apoA1 binding, and the close physical interaction between apoA1 and V-ATPase could facilitate apoA1 acidification and lipidation. However, we found that treatment with F-ATPase inhibitors did not decrease ABCA1-mediated cholesterol efflux to apoA1.
Mechanistically, the requirement for V-ATPase activity for ABCA-mediated cholesterol efflux is probably related to the effect of low pH on promoting the unfolding of apoA1 to expose its hydrophobic residues (Figure 5A), as well as promoting phospholipid bilayer fluidity (Figure 5D), both of which can promote apoA1 insertion into cellular membranes, membrane microsolubilization, and the release of nHDL. In addition, we confirmed here (Figure 5B) the previously described effect of acidic pH to accelerate liposome clearance and rHDL formation in cell-free studies using liposomes made from physiologic phospholipids.15 It has also been observed that treatment of HDL2 and HDL3 subfractions at acidic pH leads to HDL remodeling, the release of lipid-free apoA1, and HDL remnant fusion.16 We have shown that ABCA1 independently flops PS and PIP2 to the outer leaflet of the plasma membrane, with the former promoting detergent sensitivity to the plasma membrane and the latter mediating apoA1 binding.6, 9 Our current study, modeled in Figure 6, shows that ABCA1 also recruits V-ATPase to the plasma membrane. V-ATPase proton pumping can acidify apoA1 on the plasma membrane or in early endosomes. Acidification facilitates the partial unfolding of apoA1 and increased membrane fluidity, and the unfolded apoA1 is able to spontaneously insert into the membrane, which resolves in the release of nHDL directly from the plasma membrane or into the endosome lumen, from which it can be released by retroendocytosis. Although we have no direct proof that apoA1 acidification and unfolding are required for nHDL biogenesis via ABCA1, inhibiting V-ATPase activity impaired apoA1 acidification and nHLD biogenesis, and inhibiting V-ATPase expression also impaired nHDL biogenesis. Along with our in vitro data showing that apoA1 acidification increased apoA1 unfolding and liposome solubilization, the most parsimonious explanation for our observations is consistent with our model.
Figure 6. The role of V-ATPase in the ABCA1 mediated nHDL biogenesis.
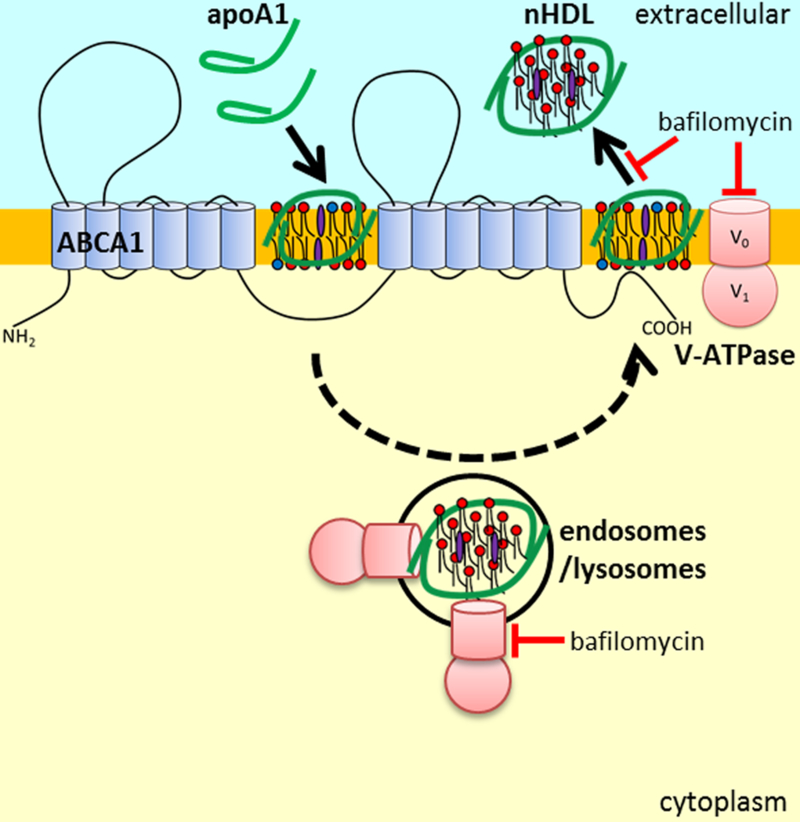
ABCA1 expression recruits V-ATPase to the plasma membrane which can lead to apoA1 acidification to promote its N-terminal unfolding, as well as membrane acidification to increase lipid fluidity. N-terminal unfolded apoA1 is able to spontaneously interact with membrane lipids to generate and release nHDL from the cell. The dashed line indicates that in some cells, such as cholesterol loaded macrophages, apoA1 acidification and nHDL formation may occur in endosomes, followed by retroendocytosis and the release of the nHDL. V-ATPase inhibition (bafilomycin A1) impairs nHDL biogenesis without impeding apoA1 binding/uptake.
In conclusion, we showed that ABCA1 mediated apoA1 lipidation requires V-ATPase activity and that ABCA1 recruits V-ATPase to the cell surface. Together, these findings increase our insight into the mechanism by which ABCA1 mediates apoA1 lipidation, and suggest that modulation of V-ATPase and/or apoA1 acidification may serve as new targets for increasing cholesterol efflux activity.
Supplementary Material
Highlights.
Inhibition of V-ATPase blocks ABCA1-dependent cholesterol efflux
Other inhibitors of lysosome pH or proteolysis do not block cholesterol efflux
ABCA1 promotes the cellular acidification of apoA1 in a V-ATPase dependent fashion
ABCA1 recruits V-ATPase to the cell surface, where it may promote nHDL assembly
Acknowledgments
Sources of Funding
This work was supported by National Institutes of Health grants R01 HL128268 and R01 HL130085 to J.D.S.
Non-standard abbreviations:
- nHDL
nascent HDL
- rHDL
reconstituted HDL
- PS
phosphatidyserine
- PIP2
phosphatidylinositol (4,5) bisphosphate
- PC
phosphatidycholine
- POPS
palmitoyloleoylphosphatidyserine
- LUVs
large unilamellar vesicles
- DPH
diphenylhexatriene
- FITC
fluorescein isothiocyanate
- vacuolar-ATPase
V-ATPase
- ECAR
extracellular acidification rate
Footnotes
Disclosures
None.
References
- 1.Gordon DJ, Probstfield JL, Garrison RJ, Neaton JD, Castelli WP, Knoke JD, Jacobs DR Jr., Bangdiwala S and Tyroler HA. High-density lipoprotein cholesterol and cardiovascular disease. Four prospective American studies. Circulation. 1989;79:8–15. [DOI] [PubMed] [Google Scholar]
- 2.Toth PP, Barter PJ, Rosenson RS, et al. High-density lipoproteins: a consensus statement from the National Lipid Association. J Clin Lipidol. 2013;7:484–525. [DOI] [PubMed] [Google Scholar]
- 3.Voight BF, Peloso GM, Orho-Melander M, et al. Plasma HDL cholesterol and risk of myocardial infarction: a mendelian randomisation study. Lancet. 2012;380:572–80. [DOI] [PMC free article] [PubMed] [Google Scholar]
- 4.Plump AS, Scott CJ and Breslow JL. Human apolipoprotein A-I gene expression increases high density lipoprotein and suppresses atherosclerosis in the apolipoprotein E-deficient mouse. Proc Natl Acad Sci U S A. 1994;91:9607–11. [DOI] [PMC free article] [PubMed] [Google Scholar]
- 5.Paszty C, Maeda N, Verstuyft J and Rubin EM. Apolipoprotein AI transgene corrects apolipoprotein E deficiency-induced atherosclerosis in mice. J Clin Invest. 1994;94:899–903. [DOI] [PMC free article] [PubMed] [Google Scholar]
- 6.Wang S, Gulshan K, Brubaker G, Hazen SL and Smith JD. ABCA1 mediates unfolding of apolipoprotein AI N terminus on the cell surface before lipidation and release of nascent high-density lipoprotein. Arterioscler Thromb Vasc Biol. 2013;33:1197–205. [DOI] [PMC free article] [PubMed] [Google Scholar]
- 7.Wang S and Smith JD. ABCA1 and nascent HDL biogenesis. Biofactors. 2014;40:547–54. [DOI] [PMC free article] [PubMed] [Google Scholar]
- 8.Rigot V, Hamon Y, Chambenoit O, Alibert M, Duverger N and Chimini G. Distinct sites on ABCA1 control distinct steps required for cellular release of phospholipids. J Lipid Res. 2002;43:2077–86. [DOI] [PubMed] [Google Scholar]
- 9.Gulshan K, Brubaker G, Conger H, Wang S, Zhang R, Hazen SL and Smith JD. PI(4,5)P2 Is Translocated by ABCA1 to the Cell Surface Where It Mediates Apolipoprotein A1 Binding and Nascent HDL Assembly. Circ Res. 2016;119:827–38. [DOI] [PMC free article] [PubMed] [Google Scholar]
- 10.Nishi T and Forgac M. The vacuolar (H+)-ATPases--nature’s most versatile proton pumps. Nat Rev Mol Cell Biol. 2002;3:94–103. [DOI] [PubMed] [Google Scholar]
- 11.Li YP, Chen W, Liang Y, Li E and Stashenko P. Atp6i-deficient mice exhibit severe osteopetrosis due to loss of osteoclast-mediated extracellular acidification. Nat Genet. 1999;23:447–51. [DOI] [PubMed] [Google Scholar]
- 12.Brown D and Breton S. H(+)V-ATPase-dependent luminal acidification in the kidney collecting duct and the epididymis/vas deferens: vesicle recycling and transcytotic pathways. J Exp Biol. 2000;203:137–45. [DOI] [PubMed] [Google Scholar]
- 13.Brisseau GF, Grinstein S, Hackam DJ, Nordstrom T, Manolson MF, Khine AA and Rotstein OD. Interleukin-1 increases vacuolar-type H+-ATPase activity in murine peritoneal macrophages. J Biol Chem. 1996;271:2005–11. [DOI] [PubMed] [Google Scholar]
- 14.Haka AS, Grosheva I, Chiang E, Buxbaum AR, Baird BA, Pierini LM and Maxfield FR. Macrophages create an acidic extracellular hydrolytic compartment to digest aggregated lipoproteins. Mol Biol Cell. 2009;20:4932–40. [DOI] [PMC free article] [PubMed] [Google Scholar]
- 15.Fukuda M, Nakano M, Miyazaki M, Tanaka M, Saito H, Kobayashi S, Ueno M and Handa T. Conformational change of apolipoprotein A-I and HDL formation from model membranes under intracellular acidic conditions. J Lipid Res. 2008;49:2419–26. [DOI] [PubMed] [Google Scholar]
- 16.Nguyen SD, Oorni K, Lee-Rueckert M, Pihlajamaa T, Metso J, Jauhiainen M and Kovanen PT. Spontaneous remodeling of HDL particles at acidic pH enhances their capacity to induce cholesterol efflux from human macrophage foam cells. J Lipid Res. 2012;53:2115–25. [DOI] [PMC free article] [PubMed] [Google Scholar]
- 17.Peng DQ, Brubaker G, Wu Z, Zheng L, Willard B, Kinter M, Hazen SL and Smith JD. Apolipoprotein A-I tryptophan substitution leads to resistance to myeloperoxidase-mediated loss of function. Arterioscler Thromb Vasc Biol. 2008;28:2063–70. [DOI] [PMC free article] [PubMed] [Google Scholar]
- 18.Vaughan AM and Oram JF. ABCA1 redistributes membrane cholesterol independent of apolipoprotein interactions. J Lipid Res. 2003;44:1373–80. [DOI] [PubMed] [Google Scholar]
- 19.Zhu K, Brubaker G and Smith JD. Large disk intermediate precedes formation of apolipoprotein A-I-dimyristoylphosphatidylcholine small disks. Biochemistry. 2007;46:6299–307. [DOI] [PMC free article] [PubMed] [Google Scholar]
- 20.Roczniak-Ferguson A, Petit CS, Froehlich F, Qian S, Ky J, Angarola B, Walther TC and Ferguson SM. The transcription factor TFEB links mTORC1 signaling to transcriptional control of lysosome homeostasis. Sci Signal. 2012;5:ra42. [DOI] [PMC free article] [PubMed] [Google Scholar]
- 21.Le Goff W, Zheng P, Brubaker G and Smith JD. Identification of the cAMP-responsive enhancer of the murine ABCA1 gene: requirement for CREB1 and STAT3/4 elements. Arterioscler Thromb Vasc Biol. 2006;26:527–33. [DOI] [PubMed] [Google Scholar]
- 22.Takahashi Y and Smith JD. Cholesterol efflux to apolipoprotein AI involves endocytosis and resecretion in a calcium-dependent pathway. Proc Natl Acad Sci U S A. 1999;96:11358–63. [DOI] [PMC free article] [PubMed] [Google Scholar]
- 23.Neufeld EB, Remaley AT, Demosky SJ, Stonik JA, Cooney AM, Comly M, Dwyer NK, Zhang M, Blanchette-Mackie J, Santamarina-Fojo S and Brewer HB Jr. Cellular localization and trafficking of the human ABCA1 transporter. J Biol Chem. 2001;276:27584–90. [DOI] [PubMed] [Google Scholar]
- 24.Neufeld EB, Stonik JA, Demosky SJ Jr, Knapper CL, Combs CA, Cooney A, Comly M, Dwyer N, Blanchette-Mackie J, Remaley AT, Santamarina-Fojo S and Brewer HB Jr. The ABCA1 transporter modulates late endocytic trafficking: insights from the correction of the genetic defect in Tangier disease. J Biol Chem. 2004;279:15571–8. [DOI] [PubMed] [Google Scholar]
- 25.Hassan HH, Bailey D, Lee DY, Iatan I, Hafiane A, Ruel I, Krimbou L and Genest J. Quantitative analysis of ABCA1-dependent compartmentalization and trafficking of apolipoprotein A-I: implications for determining cellular kinetics of nascent high density lipoprotein biogenesis. J Biol Chem. 2008;283:11164–75. [DOI] [PubMed] [Google Scholar]
- 26.Azuma Y, Takada M, Shin HW, Kioka N, Nakayama K and Ueda K. Retroendocytosis pathway of ABCA1/apoA-I contributes to HDL formation. Genes Cells. 2009;14:191–204. [DOI] [PubMed] [Google Scholar]
- 27.Forgac M Vacuolar ATPases: rotary proton pumps in physiology and pathophysiology. Nat Rev Mol Cell Biol. 2007;8:917–29. [DOI] [PubMed] [Google Scholar]
- 28.Ji Y and Jonas A. Properties of an N-terminal proteolytic fragment of apolipoprotein AI in solution and in reconstituted high density lipoproteins. J Biol Chem. 1995;270:11290–7. [DOI] [PubMed] [Google Scholar]
- 29.Brazill DT, Meyer LR, Hatton RD, Brock DA and Gomer RH. ABC transporters required for endocytosis and endosomal pH regulation in Dictyostelium. J Cell Sci. 2001;114:3923–32. [DOI] [PubMed] [Google Scholar]
- 30.Nunes F, Wolf M, Hartmann J and Paul RJ. The ABC transporter PGP-2 from Caenorhabditis elegans is expressed in the sensory neuron pair AWA and contributes to lysosome formation and lipid storage within the intestine. Biochem Biophys Res Commun. 2005;338:862–71. [DOI] [PubMed] [Google Scholar]
- 31.Schroeder LK, Kremer S, Kramer MJ, Currie E, Kwan E, Watts JL, Lawrenson AL and Hermann GJ. Function of the Caenorhabditis elegans ABC transporter PGP-2 in the biogenesis of a lysosome-related fat storage organelle. Mol Biol Cell. 2007;18:995–1008. [DOI] [PMC free article] [PubMed] [Google Scholar]
- 32.van Es HH, Renkema H, Aerts H and Schurr E. Enhanced lysosomal acidification leads to increased chloroquine accumulation in CHO cells expressing the pfmdr1 gene. Mol Biochem Parasitol. 1994;68:209–19. [DOI] [PubMed] [Google Scholar]
- 33.Singaraja RR, Visscher H, James ER, Chroni A, Coutinho JM, Brunham LR, Kang MH, Zannis VI, Chimini G and Hayden MR. Specific mutations in ABCA1 have discrete effects on ABCA1 function and lipid phenotypes both in vivo and in vitro. Circ Res. 2006;99:389–97. [DOI] [PubMed] [Google Scholar]
- 34.Nagao K, Zhao Y, Takahashi K, Kimura Y and Ueda K. Sodium taurocholate-dependent lipid efflux by ABCA1: effects of W590S mutation on lipid translocation and apolipoprotein A-I dissociation. J Lipid Res. 2009;50:1165–72. [DOI] [PMC free article] [PubMed] [Google Scholar]
- 35.Kuno M, Li G, Moriura Y, Hino Y, Kawawaki J and Sakai H. Acid-inducible proton influx currents in the plasma membrane of murine osteoclast-like cells. Pflugers Arch. 2016;468:837–47. [DOI] [PubMed] [Google Scholar]
- 36.Beyenbach KW and Wieczorek H. The V-type H+ ATPase: molecular structure and function, physiological roles and regulation. J Exp Biol. 2006;209:577–89. [DOI] [PubMed] [Google Scholar]
- 37.Chen W, Sun Y, Welch C, Gorelik A, Leventhal AR, Tabas I and Tall AR. Preferential ATP-binding cassette transporter A1-mediated cholesterol efflux from late endosomes/lysosomes. J Biol Chem. 2001;276:43564–9. [DOI] [PubMed] [Google Scholar]
- 38.Smith JD, Le Goff W, Settle M, Brubaker G, Waelde C, Horwitz A and Oda MN. ABCA1 mediates concurrent cholesterol and phospholipid efflux to apolipoprotein A-I. J Lipid Res. 2004;45:635–44. [DOI] [PubMed] [Google Scholar]
- 39.Denis M, Landry YD and Zha X. ATP-binding cassette A1-mediated lipidation of apolipoprotein A-I occurs at the plasma membrane and not in the endocytic compartments. J Biol Chem. 2008;283:16178–86. [DOI] [PMC free article] [PubMed] [Google Scholar]
- 40.Martinez LO, Jacquet S, Esteve JP, Rolland C, Cabezon E, Champagne E, Pineau T, Georgeaud V, Walker JE, Terce F, Collet X, Perret B and Barbaras R. Ectopic beta-chain of ATP synthase is an apolipoprotein A-I receptor in hepatic HDL endocytosis. Nature. 2003;421:75–9. [DOI] [PubMed] [Google Scholar]
- 41.Cavelier C, Ohnsorg PM, Rohrer L and von Eckardstein A. The beta-chain of cell surface F(0)F(1) ATPase modulates apoA-I and HDL transcytosis through aortic endothelial cells. Arterioscler Thromb Vasc Biol. 2012;32:131–9. [DOI] [PubMed] [Google Scholar]
Associated Data
This section collects any data citations, data availability statements, or supplementary materials included in this article.