

Abstract
High-throughput mass spectrometry (MS) glycomics is an emerging field driven by technological advancements including sample preparation and data processing. Previously, we reported an automated protocol for the analysis of N-glycans released from plasma proteins that included sialic acid derivatization with linkage-specificity, namely, ethylation of α2,6-linked sialic acid residues and lactone formation of α2,3-linked sialic acids. In the current study, each step in this protocol was further optimized. Method improvements included minimizing the extent of side-reaction during derivatization, an adjusted glycan purification strategy and mass analysis of the released N-glycans by ultrahigh resolution matrix-assisted laser desorption/ionization Fourier transform ion cyclotron resonance MS. The latter resolved peak overlap and simplified spectral alignment due to high mass measurement precision. Moreover, this resulted in more confident glycan assignments and improved signal-to-noise for low-abundant species. The performance of the protocol renders high-throughput applications feasible in the exciting field of clinical glycomics.
Without compromising the value of genomic and transcriptomic analyses it is widely acknowledged that the complexity of the human body largely arises from variations in protein expression as well as modifications between cells, tissues and body fluids. In this context, mass spectrometry (MS)-based proteomics has greatly contributed to an understanding of cellular functions at a molecular level.1 Interestingly, in MS-based biomarker discovery efforts protein glycosylation has often not been taken into account, albeit that glycoproteins are key players in biological processes, such as cell adhesion, endocytosis, receptor activation, signal transduction, molecular trafficking, and clearance.2,3 Moreover, glycosylation has proven to be reflective of (and in some cases causal to) disease etiology. Notable examples include tumor growth and metastasis, various inflammatory conditions and autoimmune diseases, and congenital disorders of glycosylation.4,5 This neglect of glycans, and proteoforms in general, can be rationalized from data complexity and technical challenges.6−8 In MS-based proteomics, database searches methyl-, phosphate-, and acetyl-groups are accommodated by an exactly defined mass difference, whereas glycans have different sizes (monomeric to oligomeric) that moreover can be isobaric. With regard to technical considerations, the applied analytical methods require high-throughput (HT) platforms to study the clinical relevance of protein glycosylation in large-scale studies, as larger sample sizes have a higher risk of errors and inconsistencies in sample preparation, leading to poor repeatability.9
Multiple HT methods have been developed for proteomics10,11 and glycomics9,12,21,13−20 purposes. For released N-glycan analysis several HT methods are available: capillary electrophoresis with laser-induced fluorescence detection (CE-LIF),13,14 ultraperformance liquid chromatography with fluorescence detection (UPLC-FLD),15,17 and matrix-assisted laser desorption/ionization mass spectrometry (MALDI)-MS.12,22 Some of these methods include LC runs, which show a relatively lower throughput compared to MALDI-MS and multiplexed CE-LIF. In addition, fluorescence detection is often used, which has limitations for highly complex samples due to potentially overlapping signals. Here we present a high-performance mass spectrometric glycomics assay which includes automated sample preparation and high resolution mass spectrometry. This assay shows a range of advantages as compared to other workflows and is based on our previous plasma glycomics protocol that includes sialic acid derivatization with linkage-specificity and a plate-based method for glycan purification. High throughput: The assay can be run at high throughput allowing the measurement of 576 samples within 1 day, thereby making the analysis of large-scale clinical cohorts possible. High coverage: 120 glycans were detected from human plasma applying linkage-specific sialic acid derivatization, 90 glycans whereof were consistently quantified. High confidence identification: artifacts and contaminants were minimized by optimizing the sample preparation. Together with the high-resolution, high mass accuracy and precision, this tackled issues regarding signal overlap and allowed confident glycan identification. High performance relative quantification: Due to the automated and optimized sample preparation including cotton thread microsolid phase extraction tips, reproducible glycan profiles were obtained. This novel high-performance workflow allows the robust performance of large-scale clinical glycomics studies.
Experimental Section
Samples
Plasma standard (Visucon-F frozen normal control plasma, pooled from 20 human donors, citrated and buffered with 0.02 M HEPES) was purchased from Affinity Biologicals (Ancaster, ON, Canada) and used for all experiments.
Chemicals, Reagents, and Enzymes
Analytical grade ethanol, sodium dodecyl sulfate (SDS), trifluoroacetic acid (TFA), and potassium hydroxide (KOH) were obtained from Merck (Darmstadt, Germany). Disodium hydrogen phosphate dihydrate (Na2HPO4 × 2H2O), potassium dihydrogen phosphate (KH2PO4), sodium chloride (NaCl), N,N′-diisopropylcarbodiimide (DIC), N,N′-dicyclohexylcarbodiimide (DCC), 85% phosphoric acid (H3PO4), 50% sodium hydroxide (NaOH), nonidet P-40 substitute (NP-40), 1-hydroxybenzotriazole 97% (HOBt) and super-DHB (9:1 mixture of 2,5-dihydroxybenzoic acid and 2-hydroxy-5-methoxybenzoic acid, sDHB) were purchased from Sigma-Aldrich (Steinheim, Germany). 1-Ethyl-3-(3-(dimethylamino)propyl)carbodiimide (EDC) hydrochloride was obtained from Fluorochem (Hadfield, UK), whereas recombinant peptide-N-glycosidase F (PNGase F) was obtained from Roche Diagnostics (Mannheim, Germany) and HPLC-grade acetonitrile (ACN) was purchased from Biosolve (Valkenswaard, The Netherlands). Milli-Q water (MQ) was generated from a Q-Gard 2 system (Millipore, Amsterdam, The Netherlands), which was maintained at ≥18 MΩ.
Enzymatic N-Glycan Release
The enzymatic release of N-glycans from plasma proteins was performed as previously described, however using an acidified PBS buffer.12,23−25 Briefly, acidified PBS (pH 5.6) was prepared by adding 68 μL of 85% phosphoric acid to 9.93 mL of 5× PBS solution. Then, 6 μL of plasma was added to 12 μL of 2% SDS and incubated at 60 °C for 10 min. Next, 12.6 μL of freshly prepared releasing mixture (6 μL of 4% NP-40, 6 μL of acidified PBS, and 0.6 μL of PNGase F) was added, and the samples were overnight incubated at 37 °C. Thus, prepared samples were stored at −20 °C until further analysis and measurement.
Automated Sample Preparation
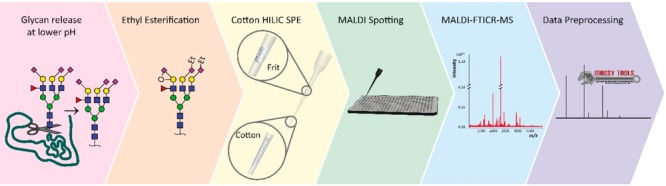
The derivatization, hydrophilic interaction liquid chromatography (HILIC) purification, and MALDI-target plate spotting were performed using an automated liquid handling platform as described in Bladergroen et al.12 This platform allows for processing of 96 samples (i.e., one microtitration plate (MTP)) in a simultaneous manner and can accommodate sequential processing of six MTPs without interruption. The first plate requires 1.5 h for processing, whereas the following ones each add half an hour to the total processing time due to efficient (overlapping) time scheduling.12 The ethyl esterification derivatization was performed by adding 2 μL of released glycan sample to 40 μL of ethyl esterification reagent (0.25 M EDC with 0.25 M HOBt in ethanol) and incubating the mixture for 1 h at 37 °C.24 Subsequently 40 μL of acetonitrile was added and after 10 min the purification was started. In-house assembled microtips used for cotton HILIC microtip purification were prepared as follows: 3 mm cotton thread (approximately 180 μg, Pipoos, Utrecht, Netherlands) was placed into a 50 μL tip (clear CO-RE tip without filter, Hamilton, Switzerland) by using tweezers. Then, a polypropylene porous frit (DPX Technologies, Columbia GA, United States of America) was placed 18 mm above the tip opening in order to prevent the cotton thread from floating through the microtips during purification. The cotton HILIC tips were three times prewetted with 40 μL of MQ water and then conditioned with three times 40 μL of 85% ACN. Subsequently the sample was loaded by pipetting the ethyl-esterified sample 20 times up and down (40 μL per time). The HILIC tips were washed three times with 40 μL of 85% ACN containing 1% TFA, and three times with 40 μL of 85% ACN. The purified N-glycans were eluted in 20 μL of MQ water by pipetting five times up and down (pipet set at 15 μL). Next, 10 μL of purified sample was premixed with 5 μL of sDHB matrix (5 mg/mL in 99% ACN with 1 mM NaOH) and 3 μL of the mixture was spotted onto a MALDI target plate (800/384 MTP AnchorChip, Bruker Daltonics, Bremen, Germany). The spots were allowed to dry in air, followed by MALDI-time-of-flight (TOF)-MS measurement and subsequent MALDI-FTICR-MS measurement of the exact same spot.
Sample Workup for Studying Adduct Formation
The N-glycan release was performed three times in acidified PBS (pH 5.6) and nine times in “regular” 5× PBS (pH 7.3). Ethyl esterification was carried out according to the protocol described above, however for the group of nine samples the reaction was performed three times with three different activating agents: 0.25 M EDC, 0.25 M DCC, or 0.25 M DIC. The samples were subsequently purified with the manual cotton HILIC solid phase extraction (SPE) microtips as described previously,24,26 spotted onto a MALDI target plate and allowed to dry in air.
MALDI-TOF-MS
MALDI-TOF-MS spectra were recorded in reflectron positive mode on an UltrafleXtreme mass spectrometer (Bruker Daltonics). The system was equipped with a Smartbeam-II laser and operated by flexControl version 3.4 Build 135. Per sample 10 000 laser shots were collected at a laser frequency of 1000 Hz. The spot was analyzed using a random walking pattern of 200 shots per raster spot. Spectra were recorded with an m/z-range of 1000–5000.
MALDI-FTICR-MS and MS/MS
MALDI-FTICR-MS measurements were performed on a Bruker 15T solariX XR FTICR mass spectrometer equipped with a CombiSource and a ParaCell (Bruker Daltonics). The system was controlled by ftmsControl version 2.1.0 and spectra were recorded with 1 M data points (i.e., transient length of 2.307 s). A Bruker Smartbeam-II Laser System was used for irradiation at a frequency of 500 Hz using the “medium” predefined shot pattern. Each MALDI-FTICR spectrum was generated in the m/z-range from 1011.86 to 5000.00. At each raster 200 laser shots were collected and each spectrum consisted of ten acquired scans. The ParaCell parameters were as follows: the DC bias RX0, TX180, RX180, and TX0 were 9.13, 9.20, 9.27, 9.20 V, respectively; the trapping potentials were set at 9.50 and 9.45 V and the excitation power and sweep step time at 55% and 15 μs. The transfer time of the ICR cell was 1.0 ms, and the quadrupole mass filter was set at m/z 850. Collision-induced dissociation (CID) experiments were performed in the m/z-range 153.34–5000 with 512 k data points. The quadrupole (Q1) was used from precursor ion selection with an isolation window of 12 mass units. Fragments were generated using a collision energy of 75 V. DataAnalysis Software 4.2 (Bruker Daltonics) was used for the visualization and data analysis of MALDI-(CID)-FTICR spectra.
Method Repeatability
The repeatability of the method was evaluated by performing the sample preparation and measurements multiple times on three different days. On day 1 the process described in the section “automated sample preparation” was repeated three times with 96 samples each time and on day 2 and 3 the process was repeated once with 96 samples per day. From this data the intraplate, intraday, and interday variation can be determined. The intraplate variation was calculated over the total amount of spectra per plate. The intraday variation was calculated over the total amount of spectra from day 1 (plates 1–3) and the interday variation was calculated over the total amount of spectra from all days (plates 1–5).
Preprocessing of Mass Spectral Data
The MALDI-TOF-MS spectra were transformed in text format (x,y) using flexAnalysis 3.4 (Bruker Daltonics). The data transformation to text format of the MALDI-FTICR-MS spectra was performed with DataAnalysis 3.1 (Bruker Daltonics). With MassyTools 0.1.8.1, the text files were calibrated if at least five calibrants showed a signal-to-noise (S/N) ratio of 9 or higher, which was the case in all 480 MALDI-TOF-MS spectra and 479 out of 480 MALDI-FTICR-MS spectra. The list of calibration masses is shown in the Supporting Information Table S-1. In addition, the spectra showing less than (average of all spectra) minus 3 × (standard deviation) of the analyte area above S/N 9 were excluded in the analysis (13 MALDI-TOF-MS spectra and 6 MALDI-FTICR-MS spectra).
In the obtained spectra, the m/z values corresponding to 163 glycan compositions including 19 “dummy signals” (as defined in Table S-2) were integrated with a coverage of 95% of the theoretical isotopic envelope per analyte. For the MALDI-TOF-MS data an extraction window of 0.49 m/z-units was applied, while for the MALDI-FTICR-MS spectra an increasing mass window was used for increasing m/z values (see Table S-3). Analyte curation was performed with multiple quality criteria: the S/N of the analyte for the median of all spectra had to be at least 6, the quality score for the comparison of the theoretical and observed isotopic envelope of the analyte had to be lower than 0.5 for the median of all spectra and the PPM-error of the analyte had to be lower than 10 for the first quartile of all spectra. All dummy analytes were excluded by these criteria. In addition, 64 signals were excluded for further analysis in the MALDI-TOF-MS spectra and 53 in the MALDI-FTICR-MS spectra. The complete list of N-glycans included in the extraction is shown in Table S-4. In this list also the observed glycan analytes that could not be extracted because of lacking intensity or overlap with other signals are displayed. For MALDI-TOF-MS and MALDI-FTICR-MS, spectra these were 5 and 19 analytes, respectively. Additionally, for 10 analytes only the first isotopic peak could be used for analysis, due to overlap of the other isotopic peaks with other signals.
The extracted area values for the selected glycans were normalized to the sum of all areas for each spectrum separately. In addition derived traits were calculated from single glycans using R-Studio software with an in-house written script. The exact calculations for these derived traits, including the information on which glycans are involved in a certain trait, are shown in Table S-5.
Per analyte and trait the average area, standard deviation (SD) and relative standard deviation (RSD) were calculated. In addition, the average RSD of the 25 most abundant glycans was determined. These calculations were done for the intraplate, intraday, and interday variation.
Results and Discussion
Protocol Development
The initial plasma glycomics protocol that includes a sialic acid derivatization method with linkage-specificity was used as a starting point for the development and optimization of a high performance assay.12 Method improvements included minimizing the extent of side-reaction during derivatization, an adjusted glycan purification strategy and mass analysis of the released N-glycans by MALDI-FTICR. The benefits of MALDI-FTICR mass analysis of the plasma glycome will be presented and compared to MALDI-TOF readout. With these improvements the assay is now suitable for HT studies with predefined quality metrics.27,28 A resulting ultrahigh resolution glycan profile of the improved and optimized protocol is exemplified in Figure 1. Here, released N-glycans were accurately identified up to m/z-values higher than 4000. Moreover, high precision measurement of mass differences allowed identification of a byproduct as follows.
Figure 1.

Annotated MALDI-FTICR-MS spectrum of released total plasma N-glycome, with the signals assigned as [M + Na]+ compositions. The glycans were enzymatically released and subsequently ethyl esterified, cotton HILIC purified and spotted on a MALDI-target by the automated pipetting platform. The linkages and positions of the monosaccharides are based on literature as linkage specific information cannot be extracted from the MS-data, except for the N-acetylneuraminic acid monosaccharides of which the linkage is determined by the ethyl esterification derivatization method.
Identification of a Byproduct from Derivatization
Upon careful inspection of the MALDI-based glycan profiles (such as depicted in Figure 1), it was observed that satellites of annotated glycans appeared with mass increases of +132.174 ± 0.002 and 357.205 ± 0.029 Da, respectively (averaged over 114 profiles for three different analytes). Previously, these were explained as unidentified reducing end modifications or ionization variants, namely at +132.19 and +357.18 Da of each glycan signal.29 These signals only appear when the ethyl esterification method is used, so it is likely that one of the chemicals used in this reaction reacts with the glycan. In Figure 2A, the hypothesized reaction of EDC and other carbodiimides with the reducing end of the glycan is illustrated. For this reaction it is assumed that the hydrolysis reaction of the glycosylamine after PNGase F release has not completed before addition of the ethyl esterification reagent. The resulting molecule matches the observed m/z-values when it is ionized as [M + H]+. To further confirm this hypothesis, fragmentation of the +132.19-signal of H5N4E2 at m/z 2434.002 was performed and showed that the additional mass was indeed located at the reducing end and ionized as a proton adduct (Figure 2B and 2C).
Figure 2.

(A) Reaction scheme of the observed reaction of the reducing end glycosylamine with a carbodiimide activating reagent. Chemical structures and reactions were drawn in Marvin (Marvin 17.26.0, ChemAxon). (B and C) MALDI-CID-FTICR-MS spectrum of EDC-linked H5N4E2 selected at m/z 2434.002. For more fragmentation spectra, see Figure S-1. (D) MALDI-TOF-MS spectra of derivatized H5N4E2. In panel D1–3 the observed m/z difference between the free reducing end glycan (H5N4E2 at m/z 2301.84) and the same glycan with the different carbodiimides attached to the reducing end is shown. The difference in peak shift corresponds to the mass difference of the R-groups of the different carbodiimides. For these samples, the glycan release was performed at regular pH 7.3. In panel D4 a spectrum is shown of a glycan release reaction performed with acidified PBS including ethyl esterification activated by EDC. In this spectrum, no signals corresponding to bound EDC are found.
The observed fragments (see also Figure S-1) match the structure as it was proposed in Figure 2A. This reaction results in a theoretical mass shift of 132.1763 m/z-units, which matches the observed mass shift. To proof that it is truly an addition of the complete EDC molecule, the reaction was also performed with two carbodiimides with different side groups. For these samples the glycan release was performed at regular pH 7.3. The results of these experiments are shown in Figure 2D panel 1–3. The shift of the extra peaks corresponds exactly to the mass differences between the different carbodiimides. To test whether the artifact is linked to the presence of glycosylamines, we performed the glycan release at slightly acidic conditions, knowing that glycosylamines are sensitive to acidic hydrolysis. The glycans from the sample in Figure 2D, panel 4, were released with PNGase F in acidified PBS and ethyl esterified with EDC as an activating reagent. In this spectrum no signals corresponding to the byproduct were visible. This is explained by the hydrolysis reaction that is favored at lower pH. This adjustment of the pH of the glycan release reaction prevents the presence of glycosylamines in the subsequent ethyl esterification reaction. In addition, it is worth noting that the signals at +357.205 Da also disappear from the spectra when the glycan release is performed at lower pH. This indicated that these satellites may indeed be linked to the presence of glycosylamines. Interestingly, these peaks do not change when using different carbodiimides, implying that the additional mass originates from another source. Clearly, the “removal” of these satellites of annotated glycans by performing the release in acidified PBS simplifies the MALDI-profiles. It is furthermore stressed that the here applied FTICR-MS read-out facilitates the identification of other, obviously unwanted, satellite or unexplained signals. For example, in MALDI-based analysis of glycans the potential loss of the reducing end GlcNAc (−221.0899 Da or in the case of a core fucosylation −367.1478 Da) should be taken into account, as well as signals resulting from a 0,2A cross-ring fragmentation29 or a 2,4A cross-ring fragmentation of the reducing end GlcNAc.29
Automated Cotton HILIC Purification
It was found that our initial GHP plate-based HILIC-SPE method for glycan purification (GHP plate, Pall AcroPrep Advance 96 Filter plate, Pall Corporation, Ann Arbor, MI) suffered from batch-to-batch differences for released glycans.12 Both the signal intensity in the spectra and the number of glycans visible in the spectra were decreasing over time. A clear explanation for this decrease could not be traced and for that reason an alternative purification method was added to the protocol. Here, automated HILIC purification was performed with cotton thread as the stationary phase that previously has been used in manual purification protocols.24 For the automated method a piece of cotton thread was put into a pipet tip and was kept in place by capping it with a porous frit. These newly and in-house prepared microtips enabled the application of cotton HILIC tips in an automated pipetting platform.
Using the automated cotton HILIC tips for purification instead of a GHP filter plate the spectral quality increased with respect to the signal intensity and glycan coverage. Moreover, using purification tips instead of a filter plate implies that there is no need to have a vacuum manifold or centrifuge (for elution) available on the pipetting platform. Furthermore, the overall throughput of the protocol is increased.
Glycan Assignments
As the resolving power in MALDI-FTICR-MS spectra is higher compared to MALDI-TOF (ranging from 20 000 to 10 000 in TOF versus 100 000 to 50 000 in FTICR30), overlapping species in the glycan profiles become visible (see top and middle panel of Figure 3). The narrow peaks result in a higher peak capacity in the spectrum and moreover are measured at higher precision compared to MALDI-TOF-MS data. With suitable calibration of the MALDI-FTICR-MS spectra (<5 ppm errors for calibrants), the accuracy of the measurement increases to a level where the measured m/z can give a strong indication of the monosaccharide composition of the analyte. As a consequence, fewer false assignments are made and annotations are of higher confidence. In addition, the number of detected glycan signals is increased due to the larger dynamic range of the MALDI-FTICR-MS: signals with intensities near the limit of detection in MALDI-TOF-MS spectra could not be included for analysis, but the corresponding glycan signals in MALDI-FTICR-MS spectra showed higher intensity and S/N ratio, which made it possible to include these signals in the analysis. More details on the observed and relatively quantified analytes in MALDI-TOF-MS versus MALDI-FTICR-MS are found in Table S-4.
Figure 3.
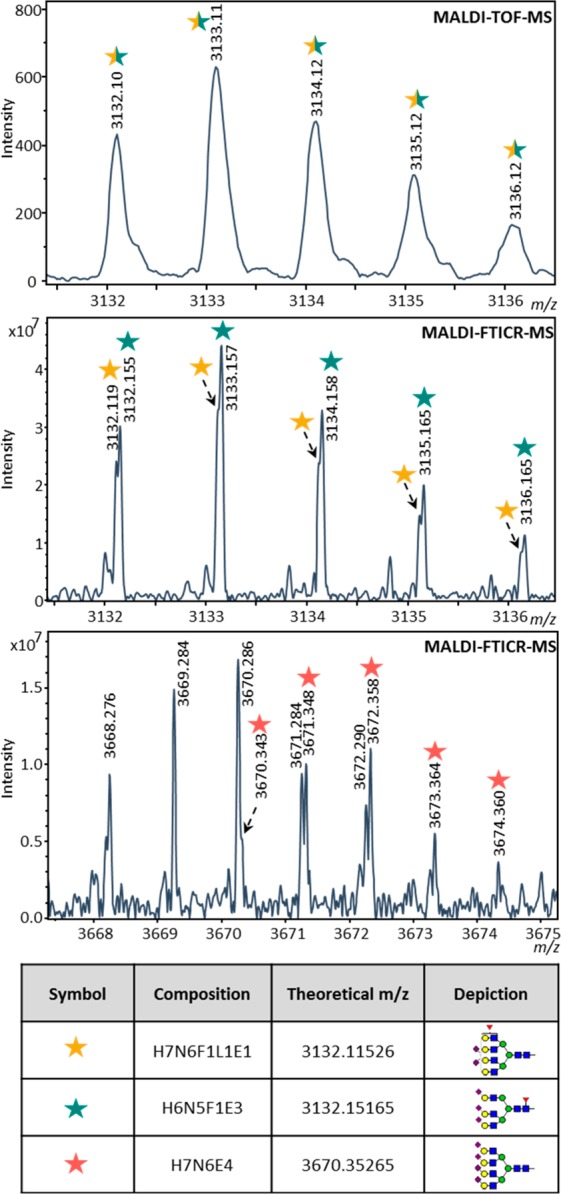
Resolving power of MALDI-FTICR-MS. In the top MALDI-TOF-MS spectrum a single isotopic pattern is visible, while in the middle MALDI-FTICR-MS spectrum there are two isotopic patterns observed. In the lower MALDI-FTICR-MS spectrum the glycan signal of H7N6E4 can be distinguished from an overlapping signal, but could not be extracted for relative quantification.
In the MALDI-TOF-MS spectra 86 glycan signals were annotated of which 80 could be extracted for relative quantification. For the MALDI-FTICR-MS spectra these numbers were 112 and 91, respectively. From these quantifiable glycans 76 were extracted from both MALDI-TOF-MS and MALDI-FTICR-MS spectra, 15 glycan signals were exclusively extracted in MALDI-FTICR-MS and 4 were exclusively extracted in MALDI-TOF-MS spectra. It should be noted that of these four MALDI-TOF-MS glycan signals (see Table S-4) one (H7N6E4) was observed in MALDI-FTICR-MS spectra, but due to overlap could not be quantified, see Figure 3. The three remaining glycan signals did not have a corresponding signal in MALDI-FTICR-MS spectra, in fact it was observed that the isotopic pattern of these signals did not correspond to glycan identities.
As a result of the higher resolving power of MALDI-FTICR-MS measurements the glycan signals were annotated with higher confidence. For most of the annotated glycans we published in previous studies the current data corroborated with proposed compositions. However, we also found a few interesting exceptions. In both MALDI-TOF-MS and MALDI-FTICR-MS, a signal was observed around m/z-value 3132.14 (see Figure 3). In previous MALDI-TOF-MS studies this signal was often annotated as H6N5F1E3, a triantennary glycan which matches all quality criteria of the data preprocessing. However, in MALDI-FTICR-MS spectra not one, but two partially overlapping signals are observed, as is shown in Figure 3. One of these signals indeed matches the mass of the triantennary glycan composition stated above, but the other signal can very well be annotated as a signal corresponding to the tetraantennary glycan H7N6F1L1E1. In MALDI-TOF-MS, it seemed that the signal was coming from one analyte, while the resolution of the MALDI-FTICR-MS spectra show that this signal is actually made up from two different glycan species. Notably there were also some cases in which the previous annotation was proven wrong. For example, a species previously assigned as H4N6F1E1 (m/z-value 2372.87) on the basis of TOF data12 is now considered to be a byproduct or adduct from another glycan, because the signal highly decreases when the glycan release is performed at lower pH. In addition, there were some signals which in MALDI-TOF-MS were annotated with some compositions, such as H4N7E1, that are questionable in a biosynthetic manner. Here the high resolution in combination with a good calibration showed that the ppm error for this composition and signal was much higher than for the other signals.
Repeatability of Glycan Relative Quantifications
From the obtained MALDI-TOF-MS, as well as MALDI-FTICR-MS spectra, the variation of the sample preparation combined with the measurements was calculated for both systems. The intraplate-, intraday-, and interday variation was calculated for the glycan with the highest relative area (H5N4E2) (see Table S-6) and averaged for the ten glycans (specific compositions are shown in Table S-6) with the highest relative area, which is shown in Figure 4. In this figure also the variation of the 25 glycans with the highest relative area is shown. The variation of all glycans is shown in Figure S-2 and in addition the variation of the calculated derived traits is shown in Figure S-3. From the information presented in Figure 4 and Table S-7 we can conclude that the variation of the MALDI-TOF-MS and MALDI-FTICR-MS measurements is similar to those reported previously: the variation of the most abundant signal is found to be around 5%.12 For the ten most abundant signals the average intraplate variation is 14.9% for the MALDI-TOF-MS measurements, whereas for the MALDI-FTICR-MS measurements this variation is only 9.0%. When comparing the interday variation this slight difference is also visible with 16.5% and 9.9% variation for the MALDI-TOF-MS and MALDI-FTICR-MS measurements, respectively. This shows that the variation in the MALDI-FTICR-MS measurements is slightly lower than in the MALDI-TOF-MS measurements.
Figure 4.

Repeatability of the automated sample preparation method and MALDI-TOF-MS and MALDI-FTICR-MS measurements for the 25 most abundant glycan signals in MALDI-FTICR-MS. On day 1 the released glycan sample plate was processed three times (resulting in plate 1–3) and on day 2 and day 3 the same sample plate was processed once (respectively resulting in plate 4 and plate 5). Error bars show standard deviation. H = hexose, N = N-acetylhexosamine, F = deoxyhexose (fucose), L = lactonized N-acetylneuraminic acid (α2,3-linked), E = ethyl esterified N-acetylneuraminic acid (α2,6-linked).
Conclusion
The aim of the present research was to further develop and improve our previous plasma glycomics protocol, which includes linkage specific sialic acid derivatization, HILIC purification, and MALDI measurement. In this study, the occurrence of side-reactions during derivatization was successfully prevented and a newly automated HILIC purification method was included. Moreover, the measurements were performed on a MALDI-FTICR-MS instrument, providing ultrahigh resolution spectra with resulting higher dynamic range and precision, which were proven to be beneficial for the correct annotation and relative quantification of the observed signals. These changes were made without affecting the repeatability of the protocol. Taken together, the improvements in the methods provide a time-efficient and repeatable protocol with higher confidence identifications for glycosylation analysis in clinical applications.
Acknowledgments
The society “Genootschap Keukenhof” (Lisse, The Netherlands) financially supported parts of this research performed at the LUMC to further endorse the development of a blood-based test for early detection of cancer. No grant number applicable. The authors thank Jan Nouta and Jennifer Heikamp for their assistance with the automated pipetting platform and Guinevere S. M. Kammeijer for her valuable contribution to the glycan annotation.
Supporting Information Available
The Supporting Information is available free of charge on the ACS Publications website at DOI: 10.1021/acs.analchem.8b02391.
Fragmentation spectrum of EDC-linked H5N4E2, repeatability of the automated sample preparation method for glycans, and repeatability of the automated sample preparation method for derived traits (PDF)
Calibration masses list, dummy analytes, extraction window width in MALDI-FTICR-MS, overview of detected glycans and relative quantification results, derived traits calculation formula, calculated repeatability of the automated sample preparation method and measurements, and a list of the ten most abundant glycan signals. (XLSX)
The authors declare no competing financial interest.
Supplementary Material
References
- Aebersold R.; Mann M. Mass-Spectrometric Exploration of Proteome Structure and Function. Nature 2016, 537 (7620), 347–355. 10.1038/nature19949. [DOI] [PubMed] [Google Scholar]
- Dell A.; Morris H. R. Glycoprotein Structure Determination by Mass Spectrometry. Science 2001, 291, 2351–2356. 10.1126/science.1058890. [DOI] [PubMed] [Google Scholar]
- Cummings R. D. The Repertoire of Glycan Determinants in the Human Glycome. Mol. BioSyst. 2009, 5 (10), 1087. 10.1039/b907931a. [DOI] [PubMed] [Google Scholar]
- Adamczyk B.; Tharmalingam T.; Rudd P. M. Glycans as Cancer Biomarkers. Biochim. Biophys. Acta, Gen. Subj. 2012, 1820 (9), 1347–1353. 10.1016/j.bbagen.2011.12.001. [DOI] [PubMed] [Google Scholar]
- Guillard M.; Morava E.; Van Delft F. L.; Hague R.; Körner C.; Adamowicz M.; Wevers R. A.; Lefeber D. J. Plasma N-Glycan Profiling by Mass Spectrometry for Congenital Disorders of Glycosylation Type II. Clin. Chem. 2011, 57 (4), 593–602. 10.1373/clinchem.2010.153635. [DOI] [PubMed] [Google Scholar]
- Smith L. M.; Kelleher N. L. Proteoform: A Single Term Describing Protein Complexity. Nat. Methods 2013, 10 (3), 186–187. 10.1038/nmeth.2369. [DOI] [PMC free article] [PubMed] [Google Scholar]
- Doerr A. Glycoproteomics. Nat. Methods 2012, 9 (1), 36–36. 10.1038/nmeth.1821. [DOI] [Google Scholar]
- van der Burgt Y. E. M.; Cobbaert C. M. Proteoform Analysis to Fulfill Unmet Clinical Needs and Reach Global Standardization of Protein Measurands in Clinical Chemistry Proteomics. Clin. Lab. Med. 2018, 38 (3), 487–497. 10.1016/j.cll.2018.05.001. [DOI] [PubMed] [Google Scholar]
- Shubhakar A.; Reiding K. R.; Gardner R. A.; Spencer D. I. R.; Fernandes D. L.; Wuhrer M. High-Throughput Analysis and Automation for Glycomics Studies. Chromatographia 2015, 78 (5–6), 321–333. 10.1007/s10337-014-2803-9. [DOI] [PMC free article] [PubMed] [Google Scholar]
- van den Broek I.; Nouta J.; Razavi M.; Yip R.; Bladergroen M. R.; Romijn F. P. H. T. M.; Smit N. P. M.; Drews O.; Paape R.; Suckau D.; et al. Quantification of Serum Apolipoproteins A-I and B-100 in Clinical Samples Using an Automated SISCAPA-MALDI-TOF-MS Workflow. Methods 2015, 81, 74–85. 10.1016/j.ymeth.2015.03.001. [DOI] [PubMed] [Google Scholar]
- Fu Q.; Kowalski M. P.; Mastali M.; Parker S. J.; Sobhani K.; Van Den Broek I.; Hunter C. L.; Van Eyk J. E. Highly Reproducible Automated Proteomics Sample Preparation Workflow for Quantitative Mass Spectrometry. J. Proteome Res. 2018, 17 (1), 420–428. 10.1021/acs.jproteome.7b00623. [DOI] [PMC free article] [PubMed] [Google Scholar]
- Bladergroen M. R.; Reiding K. R.; Hipgrave Ederveen A. L.; Vreeker G. C. M.; Clerc F.; Holst S.; Bondt A.; Wuhrer M.; van der Burgt Y. E. M. Automation of High-Throughput Mass Spectrometry-Based Plasma N -Glycome Analysis with Linkage-Specific Sialic Acid Esterification. J. Proteome Res. 2015, 14 (9), 4080–4086. 10.1021/acs.jproteome.5b00538. [DOI] [PubMed] [Google Scholar]
- Váradi C.; Lew C.; Guttman A. Rapid Magnetic Bead Based Sample Preparation for Automated and High Throughput N-Glycan Analysis of Therapeutic Antibodies. Anal. Chem. 2014, 86 (12), 5682–5687. 10.1021/ac501573g. [DOI] [PubMed] [Google Scholar]
- Szigeti M.; Lew C.; Roby K.; Guttman A. Fully Automated Sample Preparation for Ultrafast N-Glycosylation Analysis of Antibody Therapeutics. J. Lab. Autom. 2016, 21 (2), 281–286. 10.1177/2211068215608767. [DOI] [PubMed] [Google Scholar]
- Stöckmann H.; Duke R. M.; Millán Martín S.; Rudd P. M. Ultrahigh Throughput, Ultrafiltration-Based N-Glycomics Platform for Ultraperformance Liquid Chromatography (ULTRA3). Anal. Chem. 2015, 87 (16), 8316–8322. 10.1021/acs.analchem.5b01463. [DOI] [PubMed] [Google Scholar]
- Yang S.; Clark D.; Liu Y.; Li S.; Zhang H. High-Throughput Analysis of N-Glycans Using AutoTip via Glycoprotein Immobilization. Sci. Rep. 2017, 7 (1), 10216. 10.1038/s41598-017-10487-8. [DOI] [PMC free article] [PubMed] [Google Scholar]
- Adamczyk B.; Stöckmann H.; O’Flaherty R.; Karlsson N. G.; Rudd P. M.. High-Throughput Analysis of the Plasma N-Glycome by UHPLC. In High-Throughput Glycomics and Glycoproteomics; Lauc G., Wuhrer M., Eds.; Humana Press: New York, 2017; pp 97–108. [DOI] [PubMed] [Google Scholar]
- Doherty M.; Bones J.; McLoughlin N.; Telford J. E.; Harmon B.; DeFelippis M. R.; Rudd P. M. An Automated Robotic Platform for Rapid Profiling Oligosaccharide Analysis of Monoclonal Antibodies Directly from Cell Culture. Anal. Biochem. 2013, 442 (1), 10–18. 10.1016/j.ab.2013.07.005. [DOI] [PubMed] [Google Scholar]
- Stöckmann H.; Adamczyk B.; Hayes J.; Rudd P. M. Automated, High-Throughput IgG-Antibody Glycoprofiling Platform. Anal. Chem. 2013, 85 (18), 8841–8849. 10.1021/ac402068r. [DOI] [PubMed] [Google Scholar]
- Baković M. P.; Selman M. H. J.; Hoffmann M.; Rudan I.; Campbell H.; Deelder A. M.; Lauc G.; Wuhrer M. High-Throughput IgG Fc N-Glycosylation Profiling by Mass Spectrometry of Glycopeptides. J. Proteome Res. 2013, 12 (2), 821–831. 10.1021/pr300887z. [DOI] [PubMed] [Google Scholar]
- Huffman J. E.; Pučić-Baković M.; Klarić L.; Hennig R.; Selman M. H. J.; Vučković F.; Novokmet M.; Krištić J.; Borowiak M.; Muth T.; et al. Comparative Performance of Four Methods for High-Throughput Glycosylation Analysis of Immunoglobulin G in Genetic and Epidemiological Research. Mol. Cell. Proteomics 2014, 13 (6), 1598–1610. 10.1074/mcp.M113.037465. [DOI] [PMC free article] [PubMed] [Google Scholar]
- Nishimura S. I.; Niikura K.; Kurogochi M.; Matsushita T.; Fumoto M.; Hinou H.; Kamitani R.; Nakagawa H.; Deguchi K.; Miura N.; et al. High-Throughput Protein Glycomics: Combined Use of Chemoselective Glycoblotting and MALDI-TOF/TOF Mass Spectrometry. Angew. Chem., Int. Ed. 2005, 44 (1), 91–96. 10.1002/anie.200461685. [DOI] [PubMed] [Google Scholar]
- Ruhaak L. R.; Huhn C.; Waterreus W. J.; De Boer A. R.; Neusüss C.; Hokke C. H.; Deelder A. M.; Wuhrer M. Hydrophilic Interaction Chromatography-Based High-Throughput Sample Preparation Method for N-Glycan Analysis from Total Human Plasma Glycoproteins. Anal. Chem. 2008, 80 (15), 6119–6126. 10.1021/ac800630x. [DOI] [PubMed] [Google Scholar]
- Reiding K. R.; Blank D.; Kuijper D. M.; Deelder A. M.; Wuhrer M. High-Throughput Profiling of Protein N-Glycosylation by MALDI-TOF-MS Employing Linkage-Specific Sialic Acid Esterification. Anal. Chem. 2014, 86 (12), 5784–5793. 10.1021/ac500335t. [DOI] [PubMed] [Google Scholar]
- Reiding K. R.; Vreeker G. C. M.; Bondt A.; Bladergroen M. R.; Hazes J. M. W.; van der Burgt Y. E. M.; Wuhrer M.; Dolhain R. J. E. M. Serum Protein N-Glycosylation Changes with Rheumatoid Arthritis Disease Activity during and after Pregnancy. Front. Med. 2018, 4 (241), 1–11. 10.3389/fmed.2017.00241. [DOI] [PMC free article] [PubMed] [Google Scholar]
- Selman M. H. J.; Hemayatkar M.; Deelder A. M.; Wuhrer M. Cotton HILIC SPE Microtips for Microscale Purification and Enrichment of Glycans and Glycopeptides. Anal. Chem. 2011, 83 (7), 2492–2499. 10.1021/ac1027116. [DOI] [PubMed] [Google Scholar]
- Carr S. A.; Abbatiello S. E.; Ackermann B. L.; Borchers C.; Domon B.; Deutsch E. W.; Grant R. P.; Hoofnagle A. N.; Hüttenhain R.; Koomen J. M.; et al. Targeted Peptide Measurements in Biology and Medicine: Best Practices for Mass Spectrometry-Based Assay Development Using a Fit-for-Purpose Approach. Mol. Cell. Proteomics 2014, 13 (3), 907–917. 10.1074/mcp.M113.036095. [DOI] [PMC free article] [PubMed] [Google Scholar]
- Lim M. D.; Dickherber A.; Compton C. C. Before You Analyze a Human Specimen, Think Quality, Variability, and Bias. Anal. Chem. 2011, 83 (1), 8–13. 10.1021/ac1018974. [DOI] [PMC free article] [PubMed] [Google Scholar]
- Reiding K. R.; Lonardi E.; Ederveen A. L. H.; Wuhrer M.. Ethyl Esterification for MALDI-MS Analysis of Protein Glycosylation. In Proteomics in Systems Biology; Springer Science+Business Media: New York, 2016; Vol. 1394, pp 151–162. [DOI] [PubMed] [Google Scholar]
- Nicolardi S.; Bogdanov B.; Deelder A. M.; Palmblad M.; Van Der Burgt Y. E. M. Developments in FTICR-MS and Its Potential for Body Fluid Signatures. Int. J. Mol. Sci. 2015, 16 (11), 27133–27144. 10.3390/ijms161126012. [DOI] [PMC free article] [PubMed] [Google Scholar]
Associated Data
This section collects any data citations, data availability statements, or supplementary materials included in this article.