

Large-scale chemical and multibehavioral profiling identifies previously unknown potent and specific appetite modulators.
Abstract
How appetite is modulated by physiological, contextual, or pharmacological influence is still unclear. Specifically, the discovery of appetite modulators is compromised by the abundance of side effects that usually limit in vivo drug action. We set out to identify neuroactive drugs that trigger only their intended single behavioral change, which would provide great therapeutic advantages. To identify these ideal bioactive small molecules, we quantified the impact of more than 10,000 compounds on an extended series of different larval zebrafish behaviors using an in vivo imaging strategy. Known appetite-modulating drugs altered feeding and a pleiotropy of behaviors. Using this multibehavioral strategy as an active filter for behavioral side effects, we identified previously unidentified compounds that selectively increased or reduced food intake by more than 50%. The general applicability of this strategy is shown by validation in mice. Mechanistically, most candidate compounds were independent of the main neurotransmitter systems. In addition, we identified compounds with multibehavioral impact, and correlational comparison of these profiles with those of known drugs allowed for the prediction of their mechanism of action. Our results illustrate an unbiased and translational drug discovery strategy for ideal psychoactive compounds and identified selective appetite modulators in two vertebrate species.
INTRODUCTION
From an evolutionary, as well as a clinical, perspective, feeding represents a fundamental behavior, as nutritional supply is critical for survival and eating disorders are a rapidly growing prevalent health problem (1–3). Extreme lack of appetite, i.e., anorexia nervosa, causes irreversible physiological damage, while augmented food intake primarily promotes obesity, with a sedentary lifestyle and polygenetic mutations favoring disease onset (1–3). Managing nutritional intake is a key intervention strategy; however, to date, the pharmacological toolkit to selectively modulate food intake does not exist. Independent of their clinical relevance, selective modulators of appetite would serve a valuable role in providing targeted perturbations and thereby entry points into the neural circuits underlying the control of feeding behavior in many animal model systems. Historically, most appetite effectors provoked unintentional side effects, illustrating one of the challenges in psychoactive drug discovery (4, 5). One of these cautionary examples is the effective appetite suppressant rimonabant, a cannabinoid receptor 1 antagonist, which also causes anxiety and depression (6). This lack in specificity limits the usefulness of these drugs with respect to therapeutic intervention and constrains their use in the targeted perturbation of neural circuits when the goal is the discovery of general principles regulating feeding behavior. Therefore, a priority in drug discovery for therapeutic and basic research goals needs to include a description of general behavioral impact and drug selectivity. Both should become a standard requirement in preclinical development (7, 8).
Mainstream drug discovery efforts focus on protein targets using simple in vitro or cellular screens to identify small molecules or biologics as modulators (9). The quality of the target correlates with success, and consequently, an in-depth molecular characterization underlying a phenotype is a prerequisite. Behaviors, such as food intake, are not understood at the molecular level, which strongly limits the reductionist approach of target-driven drug discovery. To date, target-based approaches are far less successful at identifying first-in-class drugs compared to holistic and unbiased phenotypic strategies, particularly in central nervous system (CNS) drug discovery (9). Furthermore, in vivo drug efficacy is a major obstacle because traditional drug screening methods do not mimic whole-organism dynamics, e.g., the blood-brain barrier. To tackle these problems, we designed a high-throughput chemical screen quantifying the dynamics of food intake in live animals. Such an in vivo phenotype screen captures the complexity of whole organisms and makes compounds’ in vivo bioactivity and toxicity part of the initial screening phase. Here, the challenge is to quantify a complex phenotype like food intake on a large scale, which is normally constrained by the animal model under investigation. Rodents are not an optimal choice for initial high-throughput screening because their large size, generation time, and drug availability limit screen scale (10–12). A valid alternative is the larval zebrafish, a vertebrate roughly 4 mm long, which shares overall anatomy, physiology, and large parts of the genome with humans (13, 14). The small size enables miniaturization and makes the zebrafish larva an attractive model organism to screen for previously unidentified appetite modulators in vivo. We further demonstrate that a subset of specific, promising drug targets from the zebrafish study are also effective in a mouse model. Using this multibehavioral strategy as an active filter for behavioral side effects, we aimed to identify ideal selective appetite modulators. Overall, this multibehavior approach represents an innovative and unbiased strategy for ideal psychoactive drug discovery in vivo.
RESULTS
The homeostatic state modulates feeding behavior in zebrafish
Toward identifying feeding selective compounds, we designed a whole-organism high-throughput screening system that enabled us to quantify, in addition to feeding, a series of other vital behaviors in larval zebrafish. Larvae growth and development were standardized to guarantee similar baseline conditions in all experimental animals (Fig. 1A and Supplementary Text). Before behavioral phenotyping at 7 days post-fertilization (dpf), the larvae were fasted for different time periods and placed into a 96-well plate. Subsequently, a custom-built imaging platform detected several distinct behavioral phenotypes in all 96 animals simultaneously (Fig. 1B). First, larval zebrafish hunt and ingest live paramecia, a unicellular protozoan roughly 100 μm in size, and thereby enable the quantitative characterization of feeding behavior (15). Here, we fluorescently labeled the prey, and the imaging platform quantified larval food intake by detecting intestinal fluorescence content for 2 hours (Fig. 1C). Biologically grounded curve-fitting algorithms enabled us to extract key characteristics of feeding behavior, namely, total food intake, initial intake rate, and digestion rate (15). Different fasting periods modulated these parameters analogous to observation in adult rodents and humans (Fig. 1, D to F). Second, in parallel to the fluorescent feeding assay, we simultaneously tracked larval locomotion to quantify their swimming activity for 2 hours (Fig. 1, B and G). Third, we presented short periods of darkness to which larval zebrafish react with an increased motor output (Fig. 1H). Fourth, we applied a single mechanical tap to the plate, causing larvae to respond with a stereotypic startle response (Fig. 1I). Fifth, the larvae habituated to a series of high-frequency taps (Fig. 1, J and K). Neither spontaneous activity (Fig. 1G), responsiveness to visual (Fig. 1H) or acoustic (Fig. 1I) stimuli, nor habituation (Fig. 1, J and K) was affected by different fasting periods and their underlying homeostatic state, whereas feeding behavior (Fig. 1, C to F) was strongly modulated, indicating a lack of interdependence of these behaviors and, possibly, the underlying neuronal circuitry. All these behaviors were quantifiable in a multiwell plate and therefore amenable to large-scale chemical screening.
Fig. 1. Homeostatic state modulates feeding behavior but not spontaneous activity, arousal to visual or acoustic signals, or habituation in zebrafish larvae.
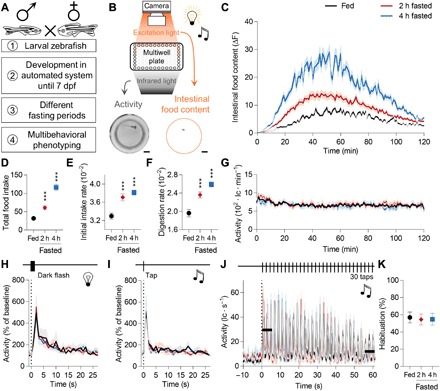
(A) Zebrafish larvae were raised under controlled conditions until 7 dpf, loaded into a well of a 96-well plate, and fasted for different time periods before assessment of distinct behaviors. (B) A custom-built imaging platform can quantify larval feeding behavior by measuring intestinal food content if combined with feeding fluorescently labeled live prey, larval locomotion by tracking swimming behavior, larval arousal by presenting visual and acoustic signals, and larval habituation (nonassociative learning) by repeatedly presenting inconsequential stimuli. The two exemplary images show data quality used for larval activity tracking and larval intestinal food content quantification using two distinct invisible light sources. All measurements were acquired under daylight conditions. Scale bars, 1 mm. (C) After different fasting periods, larvae were given access to fluorescently labeled paramecia, and their intestinal food content was quantified for 2 hours. Using a biological inspired curve-fitting algorithm, we extracted total food intake (D), initial intake rate (E), and digestion rate (F) (15) (n = 48; one-way ANOVA, Dunnett’s post test, ***P < 0.001). (G) Simultaneously, larval locomotor activity was tracked for 2 hours (n = 48; lc, line crosses). (H) Larval zebrafish react to dark flashes with increased motor output (50). After different fasting periods, larvae were exposed to eight dark flashes [750-ms duration, 30-s interstimulus interval (ISI)] and their locomotion was quantified. The triggered average is shown (n = 48). (I) An acoustic stimulus triggers larval locomotion (51). Identical experiment as in (H), but here a single tap was presented instead of a dark flash (n = 48). (J) Zebrafish larvae habituate to repetitive, inconsequential stimuli (52). Here, we presented 30 sequential taps with a short ISI (2 s) to differently fasted larvae and quantified larvae’s locomotor response. (K) The habituation metric is the activity ratio of the initial and last three taps indicated by the black bars (n = 48; one-way ANOVA, Dunnett’s post test, P > 0.05).
Current appetite modulators are not selective for feeding behavior
To establish the value of the here developed multibehavioral strategy, we first tested many appetite-modulating drugs previously used in humans. Briefly, we pre-exposed 2-hour-fasted larval zebrafish to a single compound, as shown here for nicotine and rimonabant, before giving them access to live, fluorescently labeled prey (Fig. 2A). Subsequently, the custom-built imaging platform quantified larval food intake by detecting intestinal fluorescence content (Fig. 2, B to E) and tracked larval locomotion to quantify their spontaneous activity (Fig. 2F), responsiveness to visual (Fig. 2G) or acoustic (Fig. 2H) stimuli, habituation (Fig. 2I), and lethargy (Fig. 2J). Both nicotine and rimonabant significantly reduced food intake (Fig. 2, B to E). Additional nutritional and endocrinal interventions were previously demonstrated to have an analogous impact on feeding behavior in fish, rodents, and humans (15). Furthermore, nicotine increased spontaneous activity, yet had no significant impact on any other tested behaviors (Fig. 2, F to J). Rimonabant decreased spontaneous activity, reduced the habituation response, and modulated lethargy, but had no impact on the response to visual stimuli (Fig. 2, F to J). In an effort to simplify behavioral quantification, we normalized each compound’s behavioral effect size to on-plate vehicle controls (n ≥ 24 per plate) and condensed their quantitative behavioral impact into behavioral barcodes accounting for reproducibility and effect size by an observer-independent approach (Fig. 2K, black box). Next, we tested additional appetite-modulating drugs previously used in humans and showed that all of these drugs phenocopied their behavioral effect in zebrafish larvae (Fig. 2K, first two columns; F1 and F2, orange box). Critically, all of these drugs altered a pleiotropy of larval behaviors (Fig. 2K), which are representative of the limited selectivity of current appetite-modulating drugs. Distinct side effects had led to the market retraction for the majority of these anorectic drugs (4, 5). Notably, the recently approved lorcaserin, a serotonin receptor 2C agonist, reduced food intake and the habituation response in zebrafish (Fig. 2K) and also altered a pleiotropy of rodent behaviors (16–19). This lack of behavioral selectivity resembles the unspecific neuronal impact observed after rimonabant treatment in rodents (20). Anamorelin, a ghrelin receptor agonist, is the exception of the here tested compounds being an appetite enhancer currently undergoing clinical development. Hence, we demonstrated a conserved vertebrate neuropharmacology for many mammalian appetite-modulating agents and showed their lack of behavioral selectivity, which is a potential warning sign for neuronal side effects.
Fig. 2. Available appetite modulators trigger a pleiotropy of behaviors.
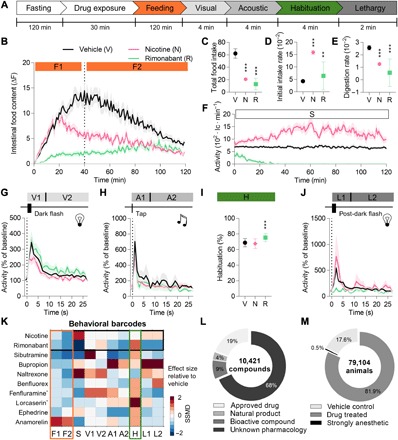
(A) Schematic of the multibehavior protocol used to test drug impact. Briefly, 2-hour-fasted larvae were pre-exposed to a drug for 30 min before multibehavioral profiling. Here, we tested many appetite-modulating drugs used in humans (4, 5). Each drug’s behavioral impact was condensed into a single, quantitative behavioral barcode, which is illustrated here for two classic anorectic drugs—nicotine and rimonabant—in detail (n ≥ 12). (B) After providing access to live prey, we quantified larvae’s intestinal food content for 2 hours and condensed the fluorescent traces into two feeding periods (F1 and F2). (C to E) Other feeding metrics can be extracted using post hoc, one-way ANOVA, Dunnett’s post test (**P < 0.01 and ***P < 0.001). (F) Simultaneously, larval locomotor activity was tracked and summarized in a single metric (S, spontaneous activity). (G) Following these 2 hours, we presented eight consecutive dark flashes to larvae and measured their activity. The triggered average response was condensed into two time points: visual periods 1 (V1, first 2 s) and 2 (V2, the following 26 s). (H) Next, we presented eight consecutive taps and measured larval kinematic response. Acoustic period 1 (A1) reflects the first 2 s of the triggered average, while A2 reflects the following 26 s. (I) Subsequently, a 3-min rest period preceded a sequence of 30 nonsequential taps with short ISI (2 s) used to quantify habituation (H). (J) Last, four dark flashes were presented identically as before in (G) to determine lethargy (L1 and L2), which is the activity ratio of the initial and post-dark flash triggered average. (K) All 10 behavioral metrics (F1, F2, S, V1, V2, A1, A2, H, L1, and L2) were acquired on a single well basis and normalized to on-plate vehicle controls (n ≥ 24). Each compound was tested in multiple animals (n ≥ 12), and their behavioral effect size and reproducibility were condensed using strictly standardized median difference (SSMD). Each square represents an SSMD value (red, higher than control; blue, lower than control) for a single behavioral metric, and jointly, they form a compound’s behavioral barcode. The black box indicates the barcodes for nicotine and rimonabant, shown in detail in (B) to (J); the orange box denotes feeding behavior; and the green box indicates habituation. *Barcodes shown for drugs tested at 100 μM. (L) Overview of all compounds tested in the high-throughput screen using the above protocol. Compounds with unknown pharmacology represent chemical structures with unknown biological activity. (M) Overview of all animals used in the high-throughput screen. Each compound was tested in multiple animals (n ≥ 6), and effects were quantified relative to on-plate vehicle controls (n ≥ 24). Sixty-two compounds were excluded in the absence of detectable activity in the last 2 min of the experiment (L1 + L2 = 0), potentially based on the strong anesthetic or lethal impact of the tested compound. Behavioral metrics: F, feeding; S, spontaneous activity; V, visual response; A, acoustic response; H, habituation; L, lethargy; 1 or 2, different time periods.
Multibehavioral profiles link compounds to their molecular mechanism of action independent of the underlying chemical structure
Motivated by these findings, we set out to screen for ideal psychoactive small molecules, that is, compounds that induce only their intended single behavioral change. To that end, we performed a high-throughput chemical screen to identify these putative selective bioactive compounds. We acquired quantitative multibehavioral barcodes for a total of 10,421 compounds, each individually tested in at least six animals (Fig. 2, L and M). Internal and external controls established screen quality and reproducibility using a standard statistical approach (Supplementary Text). This first large-scale multibehavioral dataset revealed a remarkable diversity in the impact that various compounds have on different behaviors (Fig. 3A) and enabled us to address four general questions in drug discovery and neuroscience.
Fig. 3. Diversity of drug-induced behavioral changes.
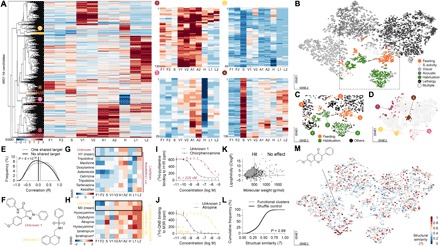
(A) Hierarchical clustering groups hit compounds with similar behavioral barcodes based on their correlation. Dendrogram color code localizes selective clusters shown at higher magnification. (B) tSNE groups hit compounds with similar barcodes using nonlinear probability distributions and preserve local distance metrics. All 4801 hits are shown in a 2D space. The tSNE map is false colored, with the primary behavior modulated for a given compound. The magnification of the rectangle is shown in (C). (D) tSNE map location of selected hierarchical clusters magnified in (A). (E) Histogram of the pairwise Pearson correlation (R) for compound barcodes sharing one or more targets, or compound barcodes with unknown target (two-tailed, two-sample Kolmogorov-Smirnov test; line depicts the median). (F) The chemical structure of two novel compounds with unknown target. PubChem compound identifier (CID): unknown 1, 1206526; unknown 2, 2836278. (G and H) Unknown compound 1 behavioral barcode showed high pairwise Pearson correlation with drugs targeting histamine receptor 1 (H1, R = 0.70 ± 0.13; mean ± SD), and unknown compound 2 showed high pairwise Pearson correlation with drugs targeting muscarinic acetylcholine receptor 3 (M3, R = 0.72 ± 0.15). All the relevant barcodes are shown for illustration, and the box shows the mean barcode for all H1 or M3 drugs relevant for correlation. The asterisk (*) depicts trans-tripolidine, l-hyoscyamine, and ipratropium bromide. (I and J) Competitive in vitro human receptor binding assays for compound unknown 1 and H1 receptor and for compound unknown 2 and M3 receptor with positive control, respectively (n = 4, mean ± SD). (K) Physiochemical properties of all tested compounds. Lines indicate the boundaries of Lipinski’s rule of five (26). (L) Cumulative histogram of pairwise structural similarities (2D Tanimoto coefficient, T) for compounds within behavioral clusters (fig. S3) or shuffle control (two-tailed, two-sample Kolmogorov-Smirnov test). (M) The tSNE map is falsely labeled with the pairwise structural similarity coefficient (T) for the illustrated example compound. Each dot represents a different compound (red, similar structures; blue, dissimilar structures). A Tanimoto coefficient of > 0.85 reflects very similar structures.
First, we tested whether compounds with a similar molecular target share similar behavioral phenotypes. A high similarity between multibehavioral barcodes from a drug with a known mode of action and a compound with an unknown target should predict the molecular target of the unknown compound. To address this hypothesis, we took advantage of the quantitative nature of the behavioral barcodes to form clusters with similar functional phenotypes. Two complementary algorithms [hierarchical clustering (Fig. 3A, left) and t-distributed stochastic neighbor embedding (tSNE) (Fig. 3, B to D)] segregated behavioral barcodes into compounds that selectively alter a single behavior. Molecules with multibehavioral phenotypes populated the transition space between major clusters [Fig. 3, A (right) and B, and fig. S3]. Within those, compounds triggered all combinatorial forms of behaviors, such as general loss- or gain-of-function effects. A subset of molecules caused more complex, multidimensional phenotypes, such as enhanced acoustic response and reduced habituation or reduced food intake and increased spontaneous activity [Fig. 3, A (right) and B, and fig. S3]. Barcodes of drugs that share one target or multiple targets correlated significantly better compared to compounds with unknown mechanisms (P = 6 × 10⁻²⁴; Fig. 3E), thereby confirming the assumption that drugs sharing molecular targets trigger similar behavioral consequences. Following this logic, we found two compounds with an unknown mechanism of action that had a strong correlation with known drugs targeting either histamine receptor 1 (H1) or muscarinic acetylcholine receptor 3 (M3), respectively (Fig. 3, F to H). This behavioral phenotype correlation suggested a shared mechanism. In vitro competitive binding assays confirmed an interaction of these two unknown compounds with the H1 or M3 receptor, respectively (Fig. 3, I and J). Thus, we identified two previously unidentified molecules binding human H1 and M3 receptor with nanomolar affinity in vitro as well as an in vivo behavioral phenotype. The measured binding affinities are in the nanomolar range, which is at least one order of magnitude stronger compared to compounds normally identified by in vitro–targeted high-throughput screens (micromolar to millimolar range; see also Fig. 4C) (21). In sum, a compound’s molecular target is a predictor for its multibehavioral impact in vivo.
Fig. 4. Identification of novel and selective appetite modulators.
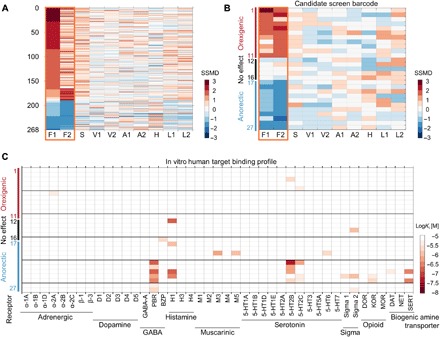
(A) Barcodes of all hits modulating feeding behavior selectively based on the SSMD threshold sorted by their effect size on feeding period 1 (F1). (B) Twenty-seven structurally novel compounds were selected based on the displayed behavioral barcodes and unique chemical structures (see fig. S5). All compounds were validated, and the complete validation data are shown in Fig. 5 and fig. S6. (C) Heatmap illustration of in vitro target binding profiles for all 27 compounds across 43 different human targets. All binding assays were validated with a positive control. Targets: adrenergic receptors (α-1A, α-1B, α-1D, α-2A, α-2B, β-1, and β-2); dopamine receptors (D1 to D5); γ-aminobutyric acid (GABA)–A receptor, peripheral benzodiazepine receptor (PBR), and allosteric benzodiazepine binding site on rat brain slices (BZP); histamine receptors (H1, H3, and H4); muscarinic receptors (M1 to M5); serotonin receptors (5-hydroxytryptamine, 5-HT1A, 5-HT1B, 5-HT1D, 5-HT1E, 5-HT2A, 5-HT2B, 5-HT2C, 5-HT3, 5-HT5A, 5-HT6, and 5-HT7); sigma receptors 1 and 2; opioid receptors, δ-opioid receptor (DOR), κ-opioid receptor (KOR), and μ-opioid receptors (MOR); and biogenic amine transporters dopamine transporter (DAT), norepinephrine transporter (NET), and serotonin transporter (SERT).
Second, we questioned how a compound’s chemical composition and structure influences its in vivo bioactivity and behavioral selectivity. We did not detect major differences in physiochemical properties between inactive and active compounds (Fig. 3K), although it should be mentioned that we intentionally biased our screening library toward drug-like molecules. To explore whether similar chemical structures caused related behavioral phenotypes, we computed structural similarity scores [two-dimensional (2D) Tanimoto similarity] for all molecules within a behavioral cluster and compared them to a shuffled control. We found that functional clusters were not enriched with similar chemical structures (P = 0.99; Fig. 3, L and M). Hence, a compound’s chemical structure is, at least in our hands, not a good predictor for its in vivo impact on vertebrate behavior.
The zebrafish CNS controls different behaviors by an autonomous neuronal circuitry
Third, we hypothesized that if two different behaviors are orchestrated by the same or overlapping neuronal circuitry, they should correlate with respect to their behavioral barcodes. For instance, a larva responding to visual stimuli quickly relative to other larvae may also respond more quickly to acoustic stimuli if both behaviors are controlled by the same neuronal circuitry. If a drug affects this shared circuit, we would expect both behaviors to be altered similarly. To quantitatively test this hypothesis, we investigated the correlations among all tested behaviors across all animals. The analysis from the behavioral barcodes of more than 10,000 control animals revealed strong linear correlation within a specific behavioral group, e.g., feeding periods F1 and F2 (Pearson correlation, R > 0.65; two-tailed, P < 1 × 10−250; fig. S4A); however, different behaviors, e.g., visual and acoustic response, did not correlate linearly at a meaningful level (Pearson correlation, R < 0.25; fig. S4A). The intervention with different small molecules did not reshuffle this interbehavioral interaction (fig. S4B). In line with this observation, 78% of all hits modulated a single behavior based on a standard statistical threshold (fig. S4C and Supplementary Text), of which the majority up-regulated a behavioral response relative to vehicle control (fig. S4D). Overall, the orthogonality of different behaviors in terms of drug response suggests that each neuronal circuit has unique features targetable by small molecules. Hence, the toolbox from which each separate circuit is built does not appear to be the same in the zebrafish CNS.
Novel appetite modulators are potent and selective for feeding behavior, and the majority are mechanistically independent of the main neurotransmitter systems
Last, the existence of ideal, behavior-selective small molecules has been questioned, particularly for appetite modulators. Current appetite-modulating drugs, which were or are used by humans, demonstrated a remarkable lack of behavioral selectivity in zebrafish (Fig. 2K). A significant advantage of the multibehavior strategy developed here is that it allows for the selection of hits not only based on the strength of their effect but also based on their selectivity. Our screen identified 373 orexigenic and 145 anorectic molecules based on a standard statistical threshold; however, only 194 oroxigenic and 74 anorectic molecules were selective for feeding behavior (Fig. 4A). The hit rate for selective orexigenic compounds and selective anorectic compounds was 1.8 and 0.7%, respectively. Consequently, the selectivity filter reduced the hit rate by roughly 50%, illustrating one advantage. Of these 268 selective appetite modulators, we selected, after inspection of the individual barcodes and the chemistry, 11 orexigenic and 11 anorectic candidate compounds with unique chemical structures for validation (Fig. 4B and fig. S5). In addition, we included five compounds with no significant phenotype as a negative control. To date, these candidate small molecules have no known biological activity and therefore represent novel intervention options for basic research with potential for clinical development. Dose-response studies confirmed their selective impact on feeding behavior over a dose range from 0.6 to 20 μM (fig. S6, A to C). Generally, the drug-induced orexigenic effect was comparable to doubling the fasting period and the magnitude of the anorectic effect to a reduction of fasting times by 50 to 75%. Further validation studies in two distinct zebrafish wild-type strains, TL and EK, confirmed the compounds’ efficacy and selectivity in two distinct genetic backgrounds (fig. S6, D and E). To identify the underlying molecular mechanisms, we tested these 22 candidate compounds for their binding affinity to 43 human neuronal targets using in vitro competitive binding assays (Fig. 4C). We found three noteworthy features. First, a few candidate compounds bound with nanomolar affinity to targets that are established regulators of feeding behavior in mammals [histamine receptor 1 (22), serotonin receptor 2B or C (5-HT2B or 5-HT2C) (23, 24), and PBR (25)], thereby independently validating our discovery strategy. Second, some compounds interacted with many targets, indicating the presence of polypharmacology. Third, most candidate molecules did not bind to any of the tested receptors with high affinity, suggesting that they act by nontested or unknown molecular mechanisms. Consequently, these 22 orexigenic and anorectic compounds represent unique pharmacological tools to selectively modulate feeding behavior in zebrafish.
Orexigenic and anorectic candidate compounds enable the selective control of appetite in zebrafish and mice
To further challenge the selectivity of these novel compounds, we chose four of these for more detailed characterization. These four molecules fulfill concepts of drug likeness (Fig. 5A) (26, 27). Orexigenic candidate (oC) compounds A and B doubled food intake, whereas the two anorectic candidate (aC) compounds C and D reduced food intake by more than 50% in zebrafish (Fig. 5, B to E). None of the candidate compounds modulated the responsiveness to visual (Fig. 5F) or acoustic (Fig. 5G) stimuli, spontaneous activity (Fig. 5H), habituation (Fig. 5I), and lethargy (Fig. 5J). aC compound D bound to PBR, 5-HT2B, and 5-HT2C receptor with nanomolar affinity (Fig. 5, K and L), whereas the other candidate small molecules did not bind to any of the 43 human neuronal targets with a millimolar affinity (Fig. 4C). Norfenfluramine, the active metabolite of the former anti-obesity drug fenfluramine, binds to 5-HT2B and 5-HT2C receptors with similar affinities to aC D (28). 5-HT2C receptor activity is considered the driver for fenfluramine’s anorectic effect and is the primary target of the recently approved anti-obesity agent lorcaserin (4, 5). To detect potential toxic and mutagenic small-molecule effects, we monitored zebrafish development under the exposure of candidate drugs in vivo using light microscopy from the single-fertilized cell stage to the 6 dpf behaving larvae. None of the candidates had a significant impact on embryological mortality, developmental defects, or temporal delays, or on the body length at 5 dpf, whereas EtOH exposure significantly reduced survival after hatching and led to lordosis as reported previously (Fig. 5, M and N) (29). As we were unable to detect an impact of the candidate compounds on normal vertebrate development, we tested for a drug impact on more subtle behavioral characteristics. These behaviors required the analysis of single fish at high temporal and spatial resolution and therefore are not suitable for high-throughput screening. First, we assessed thigmotaxis (or “wall loving”), which is a validated behavioral index for anxiety in animals. Anxiolytic drugs reduce thigmotaxis, whereas anxiogenic compounds enhance it in zebrafish larvae (30). Candidate compounds A to D did not modulate the thigmotaxic response in daylight compared to vehicle control, nor did they interfere with the characteristic reduction of thigmotaxis observed with the onset of darkness (Fig. 5O). Second, we assessed the impact of the candidate compounds on two sensitive visual behaviors: phototaxis and the optomotor response. Larval zebrafish are attracted by light and averse to darkness, and hence, perform positive phototaxis (31). Larvae treated with candidate compounds A to D executed phototaxis with similar precision to vehicle-treated animals and reduced their place preference during darkness accordingly (Fig. 5P). The optomotor response is an orienting behavior evoked by visual motion (32). A closed-loop setup presented a grating moving perpendicular to the body axes of an individual zebrafish. The stimulus elicits a turning behavior within the direction of the stimulus. We did not detect a significant impact of candidate compound on the correct execution or the turn angle used during the optomotor response (Fig. 5Q). Third, we quantified the responsiveness of larvae within a novel aversive behavioral paradigm. Larvae avoided the presence of noxious stimuli (here, mustard oil) but had no preference if presented a non-noxious stimulus (agar). This preference was not visually mediated as it was detectable during daylight and darkness. Larva treated with the candidate compounds avoided the noxious stimuli analogously to vehicle control (Fig. 5R). Fourth, larval zebrafish swam spontaneously in an open arena, and their locomotion exhibited a characteristic segmentation into an individual burst of locomotion, also called a swim bout. We traced larval swim locomotion in the presence of the candidate compounds, and subsequently performed detailed kinematic analysis. Neither larval average swim speed, bout length, bout duration, nor interbout duration was altered by the candidate compounds (Fig. 5S). Hence, all the candidate compounds selectively modulated feeding behavior in zebrafish larvae, while they showed no detectable impact on development and did not interfere with the execution of an array of behavioral tasks.
Fig. 5. “Ideal” candidate compounds’ appetite modulators identified in zebrafish.
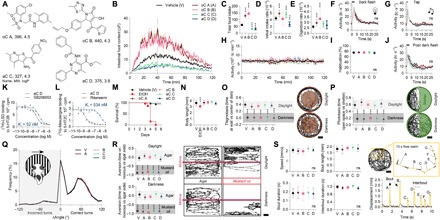
(A) Chemical structure of four compounds, two orexigenic candidates (oC) and two anorectic candidates (aC), with unknown biological activity to date. All structures fulfill Lipinski’s rule of five (26). Two-hour-fasted individual larval zebrafish (7 dpf) were pre-exposed for 30 min to candidate compounds before giving access to labeled food. MW, molecular weight. Subsequently, we quantified larval feeding behavior (B to E), arousal to visual (F) and acoustic (G) stimuli, spontaneous activity (H), habituation (I), and lethargy (J) (n = 48; one-way ANOVA, Dunnett’s post test, ***P < 0.001). ns, not significant. (K and L) Competitive in vitro human receptor binding assays for aC D and 5-HT2B or 5-HT2C receptor with positive control (n = 4, mean ± SD). cpm, counts per minute. (M and N) Developmental assay: Embryos were continuously exposed to drugs starting at 1 hpf, and survival rates were recorded until 6 dpf. Body length was recorded on day 5. EtOH (350 mM) served as positive control (n = 27; one-way ANOVA, Dunnett’s post test, ***P < 0.001). (O) Example locomotion trace of an individual larval zebrafish performing thigmotaxis (wall loving) in daylight and, to a lesser extent, in darkness. The time in the outer circle versus the inner circle was quantified as a thigmotaxic index in the presence of candidate compounds (n = 21; one-way ANOVA, Dunnett’s post test, ***P < 0.001). Scale bar, 10 mm. (P) The swimming path of individual larvae in the phototaxis assay during daylight and darkness in which one-half of the well is covered by a visible light–proof shelter. Phototaxis was quantified as the time in the open space versus that under the shelter with the treatment of the candidate compounds (n = 21; one-way ANOVA, Dunnett’s post test, ***P < 0.001). Scale bar, 10 mm. (Q) Turn angles triggered by perpendicular to the larvae’s body axes moving black stripes—the optomotor response—under the influence of candidate compounds. If larvae turned in the direction of the stimulus, this was quantified as a correct turn (n = 16; two-tailed, two-sample Kolmogorov-Smirnov test, P > 0.05). (R) Example swim traces of an individual larval zebrafish in an aversion experimental paradigm, where a noxious stimulus is located at one end of the swimming chamber. The time in either half of the tank was quantified as a preference index with treatment of the candidate compounds in daylight or darkness (n = 16; one-way ANOVA, Dunnett’s post test, ***P < 0.001). Scale bar, 20 mm. (S) Larval zebrafish swim in bouts, short bursts of motor activity, and these characteristic swim kinetics were quantified under the influence of the candidate compounds in a large arena (n = 20; one-way ANOVA, Dunnett’s post test, P > 0.05). Scale bar, 20 mm.
Next, we evaluated the translational potential of candidate compounds, and their generalized applicability to diverse vertebrate animals, by testing their efficacy in an adult mouse model. To that end, we followed the above logic to evaluate potency and selectivity on multiple mice behaviors. Acute systemic small-molecule administration into the peritoneum [100 mg/kg ip (intraperitoneally); n = 3] had no qualitatively detectable impact on alopecia, whisker loss, dermatitis, tremor, kyphosis, distended abdomen, tail stiffening, nesting, or diarrhea in mature mice. Initially, we focused the quantitative behavioral assessment in analogy to the zebrafish behavior screen. First, we measured the impact of candidate compounds (30 mg/kg ip) on the microstructure of food intake in undisturbed mice continuously (Fig. 6A). Mice had access to food ad libitum or were fasted for 16 hours before the experiment. These two complementary paradigms reflect distinct physiological states of appetite. oC compounds A and B increased food intake with distinct temporal dynamics in ad libitum fed mice (Fig. 6, B and C) but had no significant impact in 16-hour-fasted mice, probably due to an appetite ceiling effect (Fig. 6D). Anamorelin had a similar impact on food intake to the oC compounds. These effects originated from an increase in meal numbers and a reduction of the meal time (fig. S7A). oC compound A also increased food-seeking behavior (Fig. 6B). aC compounds C and D, on the other hand, reduced food intake in ad libitum fed and 16-hour-fasted mice with similar kinetics (Fig. 6, B to D) based on a smaller meal size (fig. S7C). Rimonabant induced a more potent anorectic effect in the dark phase compared to aC compounds; moreover, only rimonabant triggered compensatory food intake in the following light phase (fig. S7D). Second, we tracked mice locomotion to quantify their spontaneous activity. None of the candidate compounds had an impact on undisturbed mice locomotion, whereas hypoglycemia induced by insulin injection reduced locomotion (Fig. 6, E and F). Third, we presented short light flashes (5 s), to which mice did not show a detectable locomotion response independent of treatment (Fig. 6G). Fourth, we applied a single mechanical tap to the mice behavioral chamber, causing mice to freeze (Fig. 6H). Only rimonabant treatment modulated the response to the acoustic tap in mice as observed in zebrafish (Fig. 2K). Last, we wanted to further benchmark the behavioral selectivity of our compounds by selecting additional behaviors based on the previously observed problems with appetite modulators: Specifically, we considered glucose homeostasis, psychiatric effects, and nausea. First, blood glucose levels were not altered 30 min after candidate compound injection in mice, whereas insulin injection induced hypoglycemia (Fig. 6E). Blood glucose levels were similar across experimental groups before injection (fig. S7E). Second, we assessed thigmotaxis in mice, which is a behavioral index for anxiety. None of the candidate compounds modulated the thigmotaxis response, whereas rimonabant increased murine anxiety as reported previously (Fig. 6I) (20, 33). Third, we evaluated whether candidate compounds trigger nausea by measuring conditional taste aversion. Candidate compound–treated animals maintained a strong preference for conditioned saccharine, whereas LiCl-treated animals reduced the intake of this sweet-tasting fluid (Fig. 6J). Fluid intake was similar across experimental groups on the test day (Fig. 6J), as was saccharine intake on the conditioning day (fig. S7F). Hence, candidate compounds did not induce a conditioned taste aversion. In sum, all the candidate compounds selectively modulated feeding behavior in adult mice, while they showed no detectable impact on a series of complex mice behaviors.
Fig. 6. Orexigenic and anorectic candidate compounds selectively modulated food intake in mice.
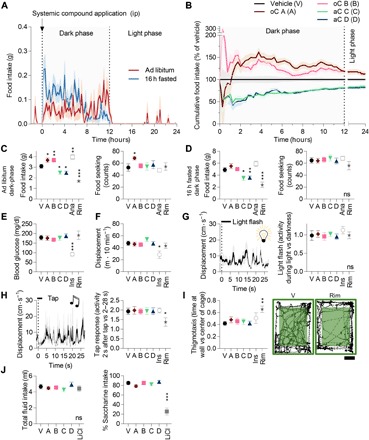
(A and B) Ad libitum fed or 16-hour-fasted mice received an intraperitoneal injection of candidate compounds (30 mg/kg), and their subsequent food intake was monitored continuously. Their cumulative food intake is shown relative to vehicle control in (B) (n = 10). ip, intraperitoneally. Summary characteristics of food intake and food-seeking behavior during the dark phase in ad libitum fed (C) or 16-hour-fasted (D) mice (n = 10; one-way ANOVA, Dunnett’s post test, *P < 0.05, **P < 0.01, and ***P < 0.001). Anamorelin (Ana) and rimonabant (Rim) served as positive controls. (E) Blood glucose levels measured 30 min after compound application (n = 10; one-way ANOVA, Dunnett’s post test, ***P < 0.001). Insulin (Ins) served as positive control. (F) Spontaneous locomotion of mice quantified 30 min after compound application (n = 10; one-way ANOVA, Dunnett’s post test, *P < 0.05). (G) Triggered average displacement response of mice to eight light flashes of 5-s duration and the corresponding light flash index after treatment with candidate compounds (n = 10). (H) Triggered average displacement response of mice to eight acoustic taps and the corresponding tap response index after treatment with candidate compounds (n = 10; one-way ANOVA, Dunnett’s post test, *P < 0.05). (I) Example locomotion trace of individual mice performing thigmotaxis (anxiolytic behavior) treated with vehicle (V) or rimonabant (rim). The time in the outer versus the inner square was quantified as a thigmotaxic index after treatment with candidate compounds (n = 10; one-way ANOVA, Dunnett’s post test, **P < 0.01). Scale bar, 10 cm. (J) Fluid intake and saccharine preference of mice measured on the test day of a conditioned taste aversion test. LiCl served as positive control (n = 8; one-way ANOVA, Dunnett’s post test, ***P < 0.001).
Overall, we demonstrated the existence of ideal, behavior-selective small molecules in two vertebrate species. In the context of appetite modulators, we found 268 previously unidentified compounds, and to date, have no described in vivo bioactivity. Twenty-two of these candidates were extensively validated, and their behavioral selectivity was confirmed in multiple follow-up studies. Furthermore, the majority of these did not bind to known receptors from main neurotransmitter systems. Four of these, two orexigenic and two anorectic candidate compounds, were benchmarked in a variety of sophisticated behavioral assays and were shown to exclusively modulate appetite in zebrafish and in mice. To further illustrate the generalizability of this unbiased psychoactive drug discovery strategy, we performed a similar analysis for compounds selective for habituation (Supplementary Text and fig. S7). In sum, we identified ideal, behavior-selective small molecules that exclusively promote or inhibit distinct vertebrate behaviors in two vertebrate species.
DISCUSSION
The large-scale chemical and multibehavior screen developed here proved to be a powerful and unbiased tool for (i) the analysis of links between a compound’s function, target, and structure; (ii) the identification of novel and ideal neuroactive compounds for different vertebrate behaviors; and (iii) the investigation of the interaction and interdependency of different vertebrate behaviors. We consider these findings to have major implications for drug discovery and neuroscience.
First, modern medicine relies on drugs to control disease progression, and the study of drug action has revealed many biological principles. Here, we developed an unbiased in vivo drug screening strategy to identify compounds modulating a clinically relevant behavior, namely, feeding. These chemical interventions are perturbances to the molecular mechanisms’ underlying behavior and are therefore invaluable tools for future in-depth mechanistic understanding. Identifying each individual compound’s in vivo mechanism is a heroic future challenge for neuropharmacology. These novel molecules, in addition to being selective pharmacological tools to the community, are defined chemical backbones for drug development targeting human disease. The conserved neurobiology and physiology among zebrafish, mice, and humans will simplify these translational ambitions (13, 14). Species differences need to be considered, but they exist between all animal model systems. Overall, these novel compounds establish the existence of ideal psychoactive small molecules, namely, compounds triggering only their intended, single behavioral change in vivo.
Second, the strength of phenotype screens is their superior ability to identify “first-in-class” drugs compared to target-based strategies (9). Traditionally, these screens only use effect size in their hit selection criteria. Here, we considered compound selectivity at the initial stage, which reduced the hit rate by ~50% compared to the standard effect size criterion and led to the selection of more specific in vivo phenotypes. This selectivity can arise either from the interaction of compounds with unknown molecular targets that are unique to a behavior or from systemic drug action balanced optimally across different mechanisms. Both are impossible to identify without a whole-organism approach. Taking the above into account, future strategies should combine a series of complex behaviors—e.g., sexual behavior, feeding, and social interactions—and systematically quantify the impact of a chemical or genetic intervention with unsupervised methods. If throughput is maintained at the scale established here, such a pipeline is applicable for combinatorial drug discovery, for the chemical rescue of disease-relevant monogenetic mutations, and for fragment-based chemical screens. In addition, these assays can serve as a standard drug safety control early in preclinical development and may prevent unexpected behavioral side effects. Ultimately, this multibehavioral strategy enables selection of more specific phenotypes, which may result in a more comprehensive understanding of in vivo drug mechanisms.
Third, diverse schools of thought aim to decode the organizational principles underlying brain function and its capability to control behavior. Here, we find that all tested zebrafish behaviors were decoupled from each other across thousands of control animals and a behavioral selectivity for numerous pharmacological interventions. This independence in behavior-generating output architecture favors a functional brain structure along orthogonal modules in zebrafish, which genetic studies supported even for goal-driven behaviors like feeding in distinct animal model systems (34–36). For instance, among the best-understood genetically defined brain circuits are the hypothalamic agouti-related peptide-secreting neurons, which have been studied extensively in the past 20 years and considered crucial for feeding behavior. On the other hand, their exclusivity to feeding behavior was recently demonstrated to be an oversimplification (37, 38), and these behavioral findings are more compatible with the concept of a distributed neuronal processing brain architecture, which may better mirror the complexity observed in the dense anatomical reconstruction of brain volumes, the diversity of secreted neuropeptides, and the dynamics of individual neurons’ gene expression (39, 40). Future work can contribute to the resolution of this ongoing discussion by exploiting the interaction of selective molecules with the in vivo complexity of an intact brain generating selective behavioral output.
In conclusion, our unbiased and large-scale behavioral findings jointly establish the advantages of multibehavioral screening for psychoactive compounds, propose a largely independent and modular organization of neural circuits that generate behavior in the larval zebrafish, and demonstrate the feasibility to control vertebrate behavior with novel, behavior-selective compounds.
MATERIALS AND METHODS
Zebrafish
Adult zebrafish (Danio rerio) from the mitfa−/− (nacre), TL, and EK strain were maintained on a 14-hour light/10-hour dark cycle at 28°C and fed three times daily with live Artemia and/or powder food (O.range, INVE Aquaculture, The Netherlands). All protocols and procedures involving zebrafish were approved by the Harvard University/Faculty of Arts and Sciences Standing Committee on the Use of Animals in Research and Teaching (Institutional Animal Care and Use Committee). If not stated differently, larvae from the mitfa−/− (nacre) strain were used in the experiments.
Zebrafish larvae production and standardized growth conditions
Larvae from bucket crosses were collected and pooled in blue water [density of > 5 ml per larva (pH 7.2); sodium bicarbonate buffer, methylene blue (1 g/liter), and instant ocean salt (0.2 g/liter)]. Live embryos were selected ~24 hours post-fertilization (hpf) and transferred to the automated growth system in 2-liter tanks (fig. S1). The automated growth system exchanged 50% of the larvae’s growth water [> 5 ml per larva (pH 7.2); sodium bicarbonate buffer and instant ocean salt (0.2 g/liter), continuously oxygenated] four times daily and fed the larvae starting at 4 dpf with a bolus of > 30 ml of fresh paramecium culture [optical density at 490 nm (OD490) ≥ 0.2] 10 min after each water exchange. The automated system was maintained at 28°C and at a 14-hour light/10-hour dark cycle.
Paramecium production and labeling
Protozoan pellets (Carolina Biological Supply, Burlington, USA) were dissolved in boiling larval growth water. After cooling, live paramecia and RotiGrow Plus (Reed Mariculture, Campbell, USA) were added to the protozoan water, and the culture was incubated for a minimum of 2 days at 28°C before use. All paramecium strains were cultured using this protocol and were originally obtained from Ward’s Science (Rochester, USA). Visual inspection of paramecium size and structure enabled us to distinguish among Paramecium caudatum, Paramecium bursaria, or Bdelloidea. If not stated differently, P. caudatum was used for all experiments. All paramecium cultures were visually inspected for purity before use with light microscopy. Paramecia were fluorescently labeled using previously described protocols (15).
Zebrafish imaging platform
The basic concept comes from the infrared (IR) macroscope described by Jordi et al. (15). All components were identical, except for the following changes, which were made to reduce cost and simplify construction, to improve the signal-to-noise ratio, and to enable diverse behaviors: (i) White light (LZ4, LED Engine, San Jose, USA) was filtered using an ultraviolet-IR (UV-IR) band-pass filter (HOYA, Tokyo, Japan). (ii) Fluorescent excitation light was generated using a single, cooled 740-nm light-emitting diode (LZ4, LED Engine), a lens (12° uniform spot, LED Engine), and a squared light diffuser (Thorlabs, Newton, USA). (iii) The new generation of IDS camera was used with significantly improved sensitivity in our hands in the 780- to 820-nm range (emission range of fluorophore) (IDS UI-3370CP-NIR, IDS, Obersulm, Germany). (iv) A push-tap solenoid (Guardian Electric 28P-I-12D, Allied Electronics, Texas, USA) enabled us to deliver acoustic stimuli. Four instruments were constructed to enable higher throughput. Emission light calibration was conducted using DiR dye (Molecular Probes, Eugene, USA) dissolved in dimethyl sulfoxide (DMSO) at different concentrations and recording fluorescent emission from the same probes for 100 ms on all the different behavioral imaging platforms. All image platforms showed very similar sensitivity for fluorescence detection.
Zebrafish homeostatic state experiment
Larvae (7 dpf) were collected from the automated system, washed to remove remaining paramecia, and transferred into petri dishes. Dead and malformed larvae were discarded upon visual identification. Larvae were randomly split into a fed group, a 2-hour-fasted group, and a 4-hour-fasted group. All groups were timed to enable simultaneous behavioral measurements. For the feeding assay, larval zebrafish were transferred to a single well of a flat-bottom 96-well plate (Falcon, VWR, USA) in 150 μl of larval growth water. Within 1 min before starting behavioral imaging, 50 μl of labeled paramecium culture [OD490nm > 0.5, > 500 paramecia per well; see Jordi et al. (15) for calibration] was added, the plate was transferred to the behavioral imaging platform, and the experiment was started. For all other behaviors, larval zebrafish were transferred to a single well of a flat-bottom 96-well plate in 200-μl larval growth water, subsequently transferred to the behavioral imaging platform, and each experiment was started.
Zebrafish high-throughput chemical screen
Larvae (7 dpf) were collected from the automated system 30 min after the last automatic paramecium supply, washed to remove remaining paramecia, and transferred into petri dishes. Dead and malformed larvae were discarded upon visual identification. Petri dishes were cooled at 4°C for 5 to 10 min to immobilize larvae. Two immobilized, randomly selected larval zebrafish were transferred to a single randomly selected well of a flat-bottom 96-well plate in 120 μl of larval growth water. Larvae were fasted for 2 hours at room temperature (23° to 24°C) within the multiwell plate. Subsequently, larvae were pre-exposed to 30 μl of compounds (final concentration of 10 μM in 0.15% DMSO, if not stated differently) for 30 min. Within 1 min before starting behavioral imaging, 50 μl of labeled paramecium culture (OD490nm > 0.5, > 500 paramecia per well) was added, the plate was transferred to the behavioral imaging platform, and the experiment was started. The following compound libraries were tested: DIVERSetE library (ChemBridge, San Diego, USA, ≥95% purity), Spectrum library (Microsource Discovery Systems, Gaylordsville, USA, ≥95% purity), Prestwick library (Prestwick Chemical, Illkirch, France, ≥95% purity), and Biomol Neurotransmitter library (BML-2810, Enzo Life Sciences, Farmingdale, USA, ≥95% purity). Individual compounds were reordered from suppliers. For the screen, each compound was tested in six animals. A subset of 530 compounds was tested in 12 or 18 animals because identical compounds were contained in multiple libraries. Lorcaserin (AdooQ Bioscience LLC, CA, USA), rimonabant-HCl (Sigma-Aldrich, MO, USA), and anamorelin (AdooQ) were acquired at >98% purity.
Validation experiments of zebrafish high-throughput screen and other multibehavioral experiments
Validation (Fig. 5 and figs. S6 and S7), preliminary dose response (fig. S2A), and appetite-modulating drug (Fig. 2) experiments were conducted similarly to above. Compounds and different doses were randomly distributed across validation plates, and experiments were repeated on at least three different days to acquire representative compound effects. One larva was tested individually for each compound and dose. Larvae were not cooled to simplify platting.
Zebrafish multibehavioral experiment
The experimental flow is graphically depicted in Fig. 2A. We collected a fluorescent image, required to measure intestinal paramecium content, with 100-ms exposure time every min for 2 hours and simultaneously used transmitted IR images to track in real time the spontaneous swimming activity of all zebrafish larvae at a camera frame rate of 10 Hz. After this initial 2-hour feeding experiment, eight dark flashes (750 ms, 30-s ISI) followed by eight taps (30-s ISI) were presented to larvae. This period was followed by a 3-min rest period, followed by the presentation of 30 taps with 2-s ISI (habituation). After habituation, four dark flashes (750 ms, 30-s ISI) were presented to the larvae before completion of the experiment.
Zebrafish screen data acquisition and behavioral barcoding
The principles for data acquisition represent the code presented by Jordi et al. (15) but were further optimized. The following adaptations were made, enabling the measurement of two larvae per well: Larval intestines were identified using intensity and size thresholds. This thresholding led to a number of particles per well, which were sorted by signal strength (area × mean intensity), and the top two were stored as intestinal traces. Kinematic traces were quantified as described by Kokel et al. (41), where the number of times an animal crosses any of three parallel imaginary lines is counted. We counted larval line crosses for each well at a frame rate of 10 Hz. Next, the data were preprocessed as follows on a well-by-well basis (Fig. 2): The fluorescence measurements were binned down to two time periods reflecting the accumulated fluorescence in the first 40 min (F1, feeding period 1) and the last 80 min of the experiment (F2, feeding period 2), respectively. Concurrent larval locomotion activity was condensed into one bin for the entire 2 hours (S, spontaneous locomotion). Next, we aligned the repeats of the initial eight dark flashes, the eight taps, and the four post-dark flashes to construct triggered averages, each 28 s in length, using an interpolation-based alignment method to generate a standard time base. These time traces were normalized to the period preceding a given stimulus (2 s) to account for differences in spontaneous locomotion. These traces were then condensed into two metrics for the visual response (V, visual) and the acoustic response (A, acoustic), the first comprising the initial 2 s of the response (period 1) and the second comprising the remaining 26 s (period 2). The ratio between the values for the initial and final dark flashes quantified animal’s lethargy (L1 and L2, lethargy periods 1 and 2). The 30-tap habituation stimulus was condensed into a single number by taking the ratio of the maximum response values of the last 15 taps to the first 15 taps (H, habituation). Next, the entire plate was normalized to the median of on-plate vehicle controls to yield a fold change with respect to the vehicle. After this final calculation on a per-plate basis, we calculated the SSMD for the values from each compound by matching its replicate wells across plates and their corresponding vehicle control wells. The statistical advantages and limitations of SSMD are extensively discussed elsewhere (42). This calculation was performed on the individual metrics coming from the feeding behavior (F1 and F2), spontaneous activity (S), visual response (V1 and V2), acoustic response (A1 and A2), habituation (H), and lethargy (L1 and L2). These 10 SSMD values per compound were termed a given compound’s barcode and were used for the clustering detailed below (43). For the calculation of confidence boundaries, we performed the same SSMD calculations for all vehicle-treated animals split into measurements of six animals analogously to the per-compound measurement outlined before. This entire process was performed in a blinded fashion; i.e., there was no a priori knowledge of compounds before hit determination. For the analysis of the candidates’ validation (Fig. 5 and figs. S6 and S7), preliminary dose response (fig. S2A), and anti-obesity drug (Fig. 2) experiments, we slightly modified the aforementioned process to enable measurement of a single larva per well: Fluorescent traces were not binned, and the activity traces were condensed to 1-min bins using the fluorescent reads as a common time base. For dark flash, tap, and post-dark flash, we performed trigger-average alignment as above. Habituation reflects the activity ratio of the mean of the last three taps and the initial three taps, if not indicated differently. Validation barcodes were constructed accordingly.
Compound structural similarity, physiochemical properties, and target annotation
Compounds from the Biomol Neurotransmitter, Spectrum, and Prestwick libraries were matched to their PubChem CID on the basis of the Chemical Abstracts Service (CAS) number, which was provided by the supplier. The ChemBridge library was annotated to CIDs by the vendor. PubChem was used to calculate pairwise structural similarity (2D Tanimoto coefficient) between all compounds and to transform CIDs into chemical structure line notations, i.e., simplified molecular input line entry system (SMILE) (44). Compound physiochemical properties were computed on the basis of compounds SMILE using Open Babel implemented in ChemMine (45). Targets were annotated to CIDs curated from publications and patents using the BindingDB (46). If no target was found, the ChEMBLdb was searched, followed by PDSPKi, and finally PubChem (47, 48). Of the 3334 known molecules, 2007 were assigned a single target. Cautionary notes: (i) Many molecules may have a known or unknown polypharmacological mechanism of action. For simplicity, here, the first identified target was used for annotation. (ii) Compound target annotation in many cases is based on in vitro or cellular screens; hence, a direct translation to in vivo may reflect an oversimplification. These and other obvious limitations must be considered when assessing the relevance of target annotation.
Clustering and correlation
Hierarchical clustering (distance metric—correlation; linkage—average), tSNE (perplexity = 25), and Pearson correlation analysis were performed in MATLAB (R2015a, The Mathworks, Massachusetts, USA) (49).
Receptor binding assay
In vitro binding assays were performed by the U.S. National Institute of Mental Health Psychoactive Drug Screening Program (48). Detailed descriptions of the method and data analysis can be found at https://pdspdb.unc.edu/pdspWeb/content/PDSP%20Protocols%20II%202013-03-28.pdf.
Zebrafish developmental assay
Fertilized embryos were collected following natural spawning and visually inspected, and three healthy randomly selected embryos were placed into a well of a standard flat-bottom six-well plate (VWR) filled with larvae’s growth water. Each well was treated with either DMSO, candidate compounds A to D (10 μM), or EtOH (350 mM) at 1 hpf. Six-well plates were maintained on a 14-hour light/10-hour dark cycle at 28°C. Every 12 hours, each embryo was inspected with a stereomicroscope and scored for survival until 6 dpf. At 5 dpf, images were acquired with a stereomicroscope, and body length was measured using ImageJ.
Zebrafish thigmotaxis assay
Larvae (7 dpf) were collected from the automated system, washed to remove remaining paramecia, and transferred into petri dishes. Larvae were fasted for 2 hours in a standard flat-bottom six-well plate before exposure to candidate compounds (10 μM) for 30 min. Subsequently, larval swimming behavior was tracked at 10 Hz by a camera (IDS UI-3370CP-NIR) positioned above the plate, which was illuminated with an IR light source from below. The camera had an IR filter mounted to avoid interference from visible light. Briefly, the tracking algorithm subtracted a 10-frame running-average background image, applied a size threshold to identify the fish, and extracted its coordinates, heading angle, etc. After recording 10 min of swimming behavior in daylight, the ambient light was shut off, and 10 min of swimming was recorded in darkness. For data analysis, each well was split into two equal-sized areas: border and center. The time periods each fish spent in an area based on its coordinates were summed, and the thigmotaxis index was calculated as follows: [Time(wall) − Time(center)]/Time(total).
Zebrafish phototaxis assay
The phototaxis experiment was executed identically to the thigmotaxis assay. The main difference was that one-half of the well was covered with an IR light–proof shelter (no visible light passes; McMaster, New Jersey, USA). For data analysis, each well was split into two equal-sized areas: shelter and open space. The time periods each fish spent in an area based on its coordinates were summed, and the phototaxis index was calculated as follows: [Time(open space) − Time(shelter)]/Time(total).
Zebrafish optomotor response
Larvae (7 dpf) were collected from the automated system, washed to remove remaining paramecia, and transferred into a petri dish. Larvae were fasted for 2 hours in the petri dish before exposure to candidate compounds (10 μM) for 30 min. Subsequently, their optomotor response was quantified using a closed-loop imaging system and code, as previously described (32).
Zebrafish aversion assay
Zebrafish larvae (7 dpf from the automated system) were fasted for 2 hours in a petri dish before exposure to candidate compounds (10 μM) for 30 min. Next, the larvae, including the drug, were transferred into a custom-built rectangular well with the following dimensions: 1.8 cm by 9.2 cm by 0.4 cm (w × l × h). A chamber at the width side allowed for the placement of a firm agar pad. One agar pad (2% agar in larvae’s growth water) contained mustard oil [noxious stimuli, 20% (v/v) allyl isothiocyanate; Sigma-Aldrich] and the other did not contain additives. After recording 10 min of swimming behavior in daylight, the ambient light was shut off and 10 min of swimming was recorded in darkness using the same setup and algorithm as for thigmotaxis and phototaxis. Aversion was quantified by splitting the rectangle into two equal-sized halves: noxious and agar side. The time periods each fish spent in an area based on its coordinates were summed, and the aversion index was calculated as follows: [Time(noxious) − Time(agar)]/Time(total).
Zebrafish free-swimming
Larvae (7 dpf) were collected from the automated system, washed to remove remaining paramecia, and transferred into a petri dish. Larvae were fasted for 2 hours in the petri dish before exposure to the candidate compounds (10 μM) for 30 min. Subsequently, larval free-swimming behavior was recorded for 10 min in daylight within a standard flat-bottom petri dish (diameter, 100 mm) using the algorithm outlined above for thigmotaxis and phototaxis. Extracted coordinates with associated time stamps were used to calculate average swim speed, bout length, and bout frequency.
Mice
Four-month-old male C57BL/6J mice (Charles River, Sulzfeld, Germany) were individually housed in wire-mesh hanging cages or in standard mice cages at room temperature (21° ± 1°C) and at an artificial 12-hour light/12-hour dark cycle. Animals were able to see, hear, and smell their conspecifics in neighboring cages and were not socially isolated. Water, food (mice chow-3436, Kliba Nafag, Kaiseraugst, Switzerland), and bedding were provided ad libitum, if not indicated differently. All procedures for mice handling and experimental interventions were according to Swiss Animal Welfare laws, approved by the “Kantonales Veterinäramt Zürich,” and conform to the principles of UK regulations. Animals were adapted to novel housing situations and feeding schedules at least for 1 week. All experiments were conducted three times with saline injections before drug administration to habituate the animals to the experimental procedure.
Mice compound application
Individual compounds (candidate compounds, rimonabant, and anamorelin) were obtained from suppliers at a purity of > 95% and dissolved in DMSO (Sigma-Aldrich). Compounds were injected intraperitoneally and diluted in 0.9% NaCl [maximum, 8% DMSO; maximum, 250 μl per 10 g of body weight (BW)] at a concentration of 30 mg/kg, if not stated differently. LiCl (0.15 M, Sigma-Aldrich) and insulin (1 U/kg; Humalog, Lilly, IN, USA) were dissolved in 0.9% NaCl directly (no DMSO; maximum, 250 μl per 10 g of BW).
Mice feeding behavior
Ad libitum fed or 16-hour-fasted mice received an intraperitoneal injection of candidate compounds within 15 min before dark onset. Food was made available at dark onset to the 16-hour-fasted mice. Food intake was measured continuously in undisturbed mice using an automated system (BioDAQ, Research Diets, NJ, USA). This system measures food hopper weight (±0.01 g) at 1-Hz resolution. The microstructure of feeding was analyzed using proprietary software (BioDAQ Monitoring Software) as follows: Absolute food hopper weight changes smaller than 0.02 g within a 5-s time interval were counted as food-seeking bouts. Absolute food hopper weight changes of 0.02 g or larger represent a meal and were summed into a single meal based on a 10-min intermeal interval.
Mice blood glucose
Three-hour-fasted mice received a tail cut for immediate blood glucose measurement (Breeze 2, Bayer AG, Leverkusen, Germany). Subsequently, candidate compounds were injected intraperitoneally, and mice were returned to their home cage for 30 min before a second blood glucose measurement was performed as described before.
Mice kinematic measurement
Three-hour-fasted mice were injected intraperitoneally with a candidate compound and were placed into a clear plastic chamber (58 cm by 38 cm by 20 cm) 30 min after injection. Subsequently, mice displacement was tracked online at 16 Hz by a camera (Logitech C930e HD) positioned above the chamber that was illuminated with an IR light source from below. The camera had an IR filter mounted to avoid interference from visible light. Briefly, the tracking algorithm subtracted a 10-frame running-average background image, applied a size threshold to identify the mouse (minimum motion detected was 5 mm), and extracted its coordinates. Extracted coordinates with linked time stamps were used to calculate displacement. Mice behavior was recorded for 15 min in complete darkness, and the final 10 min were analyzed.
Mice tap and white light response
Three-hour-fasted mice were injected intraperitoneally with a candidate compound and were tracked in complete darkness 30 min after injection as outlined above. After recording undisturbed behavior for 15 min, eight taps (75 to 85 dB) were applied to the mouse cage with an ISI of 30 s. We aligned the repeats of the eight taps to a triggered average using an interpolation-based alignment method to generate a standard time base. These time traces were normalized to the period preceding a given stimulus (2 s) to account for differences in spontaneous locomotion, and the tap response index was calculated as follows: median displacement (time period of 2 to 28 s after the tap)/median displacement (time period of 0 to 2 s immediately after the tap). The response of mice to white light flashes was tested similarly to the tap response. Instead of taps, eight periods of 5-s white light flashes (300 lux, UV, and IR light filtered) were repeated every 30 s. The flash response index was calculated as follows: median displacement (time period of light)/median displacement (time period of darkness).
Mice thigmotaxis assay
Three-hour-fasted mice were injected intraperitoneally with a candidate compound and were tracked in complete darkness for 30 min after injection with the apparatus outlined above. For data analysis, the cage was split into two equal-sized areas: border and center square. The time periods that each mouse spent in an area based on its coordinates were summed, and the thigmotaxis index was calculated as follows: [Time(wall) − Time(center)]/Time(total).
Mice conditioned taste aversion test
Fourteen-hour water-deprived mice received access to 0.15% saccharin (Sigma-Aldrich) solution for 2 hours on the conditioning day. Next, candidate compounds were injected intraperitoneally, saccharine was removed, and water access was provided for 8 hours. On the subsequent test day, 14-hour water-deprived animals received simultaneous access to water and saccharine, and their fluid intake was measured for 6 hours.
Statistics
All experiments were randomized, and data analysis was performed blindly. Statistical tests were used as appropriate and performed using GraphPad Prism 7.02 (GraphPad Software, California, USA) or MATLAB. Data are presented as mean ± SEM, if not indicated differently.
Supplementary Material
Acknowledgments
We thank A. Schier, T. Lutz, P. Kehayova, S. Breitler, and M. Haesemeyer for inputs to the manuscript; E. Soucy and R. Johnson for input on data analysis; J. Miller and her team for fish care; and S. Benz and her team for mice care. We thank the U.S. NIMH PDSP for performing binding assays. Funding: J.J. was funded by an SNF Advanced Postdoc Mobility, a Bridge fellowship, and a grant from the Holcim Foundation. A.J.R. was funded by NIH grant T32 HL007208. R.T.P. was funded by NIH grants R01MH086867 and R01GM088040 and the Charles and Ann Sanders MGH Research Scholar Award. F.E. received funding from the National Institutes of Health’s Brain Initiative U19NS104653, NIH grants R24 NS086601 and R43OD024879, and Simons Foundation grants SCGB542973 and 325207. Author contributions: J.J. conceived the project, built all equipment, contributed to experiments, and led data analysis. D.G.-N. performed data analysis. A.D.B., S.P., and K.B. executed the chemical screen. K.H. developed the avoidance assay. J.J., D.G.-N., A.J.R., T.A.L., R.T.P., and F.E. interpreted the data. J.J. wrote the manuscript with the support of F.E. All authors contributed to the manuscript and approved the final version, and all authors qualifying for authorship are listed. Competing interests: J.J. and F.E. are planning to submit a patent application related to this work through the University of Zurich. All other authors declare that they have no competing interests. Data and materials availability: All data needed to evaluate the conclusions in the paper are present in the paper and/or the Supplementary Materials. Additional data related to this paper may be requested from the authors.
SUPPLEMENTARY MATERIALS
Supplementary material for this article is available at http://advances.sciencemag.org/cgi/content/full/4/10/eaav1966/DC1
Supplementary Text
Fig. S1. Automated system to provide a constant and optimal environment for zebrafish growth and development.
Fig. S2. Zebrafish screen quality.
Fig. S3. tSNE maps.
Fig. S4. Behavioral interactions.
Fig. S5. Candidate structure.
Fig. S6. Validation of novel candidate compounds.
Fig. S7. Orexigenic and anorectic candidate compound impact on mice behaviors.
Fig. S8. Characterization of novel and selective regulators of nonassociative learning.
Table S1. Zebrafish screen statistics with different SSMD cutoffs.
REFERENCES AND NOTES
- 1.Apovian C. M., The obesity epidemic—Understanding the disease and the treatment. N. Engl. J. Med. 374, 177–179 (2016). [DOI] [PubMed] [Google Scholar]
- 2.Morton G. J., Meek T. H., Schwartz M. W., Neurobiology of food intake in health and disease. Nat. Rev. Neurosci. 15, 367–378 (2014). [DOI] [PMC free article] [PubMed] [Google Scholar]
- 3.Richard D., Cognitive and autonomic determinants of energy homeostasis in obesity. Nat. Rev. Endocrinol. 11, 489–501 (2015). [DOI] [PubMed] [Google Scholar]
- 4.Rodgers R. J., Tschöp M. H., Wilding J. P. H., Anti-obesity drugs: Past, present and future. Dis. Model. Mech. 5, 621–626 (2012). [DOI] [PMC free article] [PubMed] [Google Scholar]
- 5.Adan R., Mechanisms underlying current and future anti-obesity drugs. Trends Neurosci. 36, 133–140 (2013). [DOI] [PubMed] [Google Scholar]
- 6.Christensen R., Kristensen P. K., Bartels E. M., Bliddal H., Astrup A., Efficacy and safety of the weight-loss drug rimonabant: A meta-analysis of randomised trials. Lancet 370, 1706–1713 (2007). [DOI] [PubMed] [Google Scholar]
- 7.Giacomini K. M., Krauss R. M., Roden D. M., Eichelbaum M., Hayden M. R., Nakamura Y., When good drugs go bad. Nature 446, 975–977 (2007). [DOI] [PubMed] [Google Scholar]
- 8.Lounkine E., Keiser M. J., Whitebread S., Mikhailov D., Hamon J., Jenkins J. L., Lavan P., Weber E., Doak A. K., Côté S., Shoichet B. K., Urban L., Large-scale prediction and testing of drug activity on side-effect targets. Nature 486, 361–367 (2012). [DOI] [PMC free article] [PubMed] [Google Scholar]
- 9.Swinney D. C., Anthony J., How were new medicines discovered? Nat. Rev. Drug Discov. 10, 507–519 (2011). [DOI] [PubMed] [Google Scholar]
- 10.White J. K., Gerdin A. K., Karp N. A., Ryder E., Buljan M., Bussell J. N., Salisbury J., Clare S., Ingham N. J., Podrini C., Houghton R., Estabel J., Bottomley J. R., Melvin D. G., Sunter D., Adams N. C.; Sanger Institute Mouse Genetics Project, Tannahill D., Logan D. W., Macarthur D. G., Flint J., Mahajan V. B., Tsang S. H., Smyth I., Watt F. M., Skarnes W. C., Dougan G., Adams D. J., Ramirez-Solis R., Bradley A., Steel K. P., Genome-wide generation and systematic phenotyping of knockout mice reveals new roles for many genes. Cell 154, 452–464 (2013). [DOI] [PMC free article] [PubMed] [Google Scholar]
- 11.Jordi J., Herzog B., Camargo S. M. R., Boyle C. N., Lutz T. A., Verrey F., Specific amino acids inhibit food intake via the area postrema or vagal afferents. J. Physiol. 591, 5611–5621 (2013). [DOI] [PMC free article] [PubMed] [Google Scholar]
- 12.Jordi J., Herzog B., Lutz T. A., Verrey F., Novel antidiabetic nutrients identified by in vivo screening for gastric secretion and emptying regulation in rats. Am. J. Physiol. Regul. Integr. Comp. Physiol. 307, 78 (2014). [DOI] [PubMed] [Google Scholar]
- 13.Stewart A., Braubach O., Spitsbergen J., Gerlai R., Kalueff A. V., Zebrafish models for translational neuroscience research: From tank to bedside. Trends Neurosci. 37, 264–278 (2014). [DOI] [PMC free article] [PubMed] [Google Scholar]
- 14.Friedrich R. W., Jacobson G. A., Zhu P., Circuit neuroscience in zebrafish. Curr. Biol. 20, R371–R381 (2010). [DOI] [PubMed] [Google Scholar]
- 15.Jordi J., Guggiana-Nilo D., Soucy E., Song E. Y., Lei Wee C., Engert F., A high-throughput assay for quantifying appetite and digestive dynamics Am. J. Physiol. Regul. Integr. Comp. Physiol. 309, R345–R357 (2015). [DOI] [PMC free article] [PubMed] [Google Scholar]
- 16.Thomsen W. J., Grottick A. J., Menzaghi F., Reyes-Saldana H., Espitia S., Yuskin D., Whelan K., Martin M., Morgan M., Chen W., Al-Shamma H., Smith B., Chalmers D., Behan D., Lorcaserin, a novel selective human 5-Hydroxytryptamine2C agonist: In vitro and in vivo pharmacological characterization. J. Pharmacol. Exp. Ther. 325, 577–587 (2008). [DOI] [PubMed] [Google Scholar]
- 17.Serafine K. M., Rice K. C., France C. P., Directly observable behavioral effects of lorcaserin in rats. J. Pharmacol. Exp. Ther. 355, 381–385 (2015). [DOI] [PMC free article] [PubMed] [Google Scholar]
- 18.Zhang G., Wu X., Zhang Y.-M., Liu H., Jiang Q., Pang G., Tao X., Dong L., Stackman R. W. Jr, Activation of serotonin 5-HT2C receptor suppresses behavioral sensitization and naloxone-precipitated withdrawal symptoms in morphine-dependent mice. Neuropharmacology 101, 246–254 (2016). [DOI] [PMC free article] [PubMed] [Google Scholar]
- 19.Pogorelov V. M., Rodriguiz R. M., Cheng J., Huang M., Schmerberg C. M., Meltzer H. Y., Roth B. L., Kozikowski A. P., Wetsel W. C., 5-HT2C agonists modulate schizophrenia-like behaviors in mice. Neuropsychopharmacology 42, 2163–2177 (2017). [DOI] [PMC free article] [PubMed] [Google Scholar]
- 20.Bifulco M., Grimaldi C., Gazzerro P., Pisanti S., Santoro A., Rimonabant: Just an antiobesity drug? Current evidence on its pleiotropic effects. Mol. Pharmacol. 71, 1445–1456 (2007). [DOI] [PubMed] [Google Scholar]
- 21.Rees D. C., Congreve M., Murray C. W., Carr R., Fragment-based lead discovery. Nat. Rev. Drug Discov. 3, 660–672 (2004). [DOI] [PubMed] [Google Scholar]
- 22.Masaki T., Chiba S., Yasuda T., Noguchi H., Kakuma T., Watanabe T., Sakata T., Yoshimatsu H., Involvement of hypothalamic histamine H1 receptor in the regulation of feeding rhythm and obesity. Diabetes 53, 2250–2260 (2004). [DOI] [PubMed] [Google Scholar]
- 23.Voigt J.-P., Fink H., Serotonin controlling feeding and satiety. Behav. Brain Res. 277, 14–31 (2015). [DOI] [PubMed] [Google Scholar]
- 24.Tecott L. H., Serotonin and the orchestration of energy balance. Cell Metab. 6, 352–361 (2007). [DOI] [PubMed] [Google Scholar]
- 25.do Rego J.-C., Orta M.-H., Leprince J., Tonon M. C., Vaudry H., Costentin J., Pharmacological characterization of the receptor mediating the anorexigenic action of the octadecaneuropeptide: Evidence for an endozepinergic tone regulating food intake. Neuropsychopharmacology 32, 1641–1648 (2006). [DOI] [PubMed] [Google Scholar]
- 26.Lipinski C. A., Lombardo F., Dominy B. W., Feeney P. J., Experimental and computational approaches to estimate solubility and permeability in drug discovery and development settings. Adv. Drug Deliv. Rev. 46, 3–26 (2001). [DOI] [PubMed] [Google Scholar]
- 27.Leeson P. D., Springthorpe B., The influence of drug-like concepts on decision-making in medicinal chemistry. Nat. Rev. Drug Discov. 6, 881–890 (2007). [DOI] [PubMed] [Google Scholar]
- 28.Rothman R. B., Baumann M. H., Savage J. E., Rauser L., McBride A., Hufeisen S. J., Roth B. L., Evidence for possible involvement of 5-HT2B receptors in the cardiac valvulopathy associated with fenfluramine and other serotonergic medications. Circulation 102, 2836–2841 (2000). [DOI] [PubMed] [Google Scholar]
- 29.Tsedensodnom O., Vacaru A. M., Howarth D. L., Yin C., Sadler K. C., Ethanol metabolism and oxidative stress are required for unfolded protein response activation and steatosis in zebrafish with alcoholic liver disease. Dis. Model. Mech. 6, 1213–1226 (2013). [DOI] [PMC free article] [PubMed] [Google Scholar]
- 30.Schnörr S. J., Steenbergen P. J., Richardson M. K., Champagne D. L., Measuring thigmotaxis in larval zebrafish. Behav. Brain Res. 228, 367–374 (2012). [DOI] [PubMed] [Google Scholar]
- 31.Burgess H. A., Schoch H., Granato M., Distinct retinal pathways drive spatial orientation behaviors in zebrafish navigation. Curr. Biol. 20, 381–386 (2010). [DOI] [PMC free article] [PubMed] [Google Scholar]
- 32.Huang K.-H., Ahrens M. B., Dunn T. W., Engert F., Spinal projection neurons control turning behaviors in zebrafish. Curr. Biol. 23, 1566–1573 (2010). [DOI] [PMC free article] [PubMed] [Google Scholar]
- 33.Bambico F. R., Cassano T., Dominguez-Lopez S., Katz N., Walker C. D., Piomelli D., Gobbi G., Genetic deletion of fatty acid amide hydrolase alters emotional behavior and serotonergic transmission in the dorsal raphe, prefrontal cortex, and hippocampus. Neuropsychopharmacology 35, 2083–2100 (2010). [DOI] [PMC free article] [PubMed] [Google Scholar]
- 34.Carter M. E., Soden M. E., Zweifel L. S., Palmiter R. D., Genetic identification of a neural circuit that suppresses appetite. Nature 503, 111–114 (2013). [DOI] [PMC free article] [PubMed] [Google Scholar]
- 35.Jennings J. H., Rizzi G., Stamatakis A. M., Ung R. L., Stuber G. D., The inhibitory circuit architecture of the lateral hypothalamus orchestrates feeding. Science 341, 1517–1521 (2013). [DOI] [PMC free article] [PubMed] [Google Scholar]
- 36.Pool A.-H., Kvello P., Mann K., Cheung S. K., Gordon M. D., Wang L., Scott K., Four GABAergic interneurons impose feeding restraint in drosophila. Neuron 83, 164–177 (2013). [DOI] [PMC free article] [PubMed] [Google Scholar]
- 37.Dietrich M. O., Zimmer M. R., Bober J., Horvath T. L., Hypothalamic Agrp neurons drive stereotypic behaviors beyond feeding. Cell 160, 1222–1232 (2015). [DOI] [PMC free article] [PubMed] [Google Scholar]
- 38.Dietrich M. O., Bober J., Ferreira J. G., Tellez L. A., Mineur Y. S., Souza D. O., Gao X. B., Picciotto M. R., Araújo I., Liu Z.-W., Horvath T. L., AgRP neurons regulate development of dopamine neuronal plasticity and nonfood-associated behaviors. Nat. Neurosci. 15, 1108–1110 (2012). [DOI] [PMC free article] [PubMed] [Google Scholar]
- 39.Morgan J. L., Berger D. R., Wetzel A. W., Lichtman J. W., The fuzzy logic of network connectivity in mouse visual thalamus. Cell 165, 192–206 (2016). [DOI] [PMC free article] [PubMed] [Google Scholar]
- 40.Henry F. E., Sugino K., Tozer A., Branco T., Sternson S. M., Cell type-specific transcriptomics of hypothalamic energy-sensing neuron responses to weight-loss. eLife 4, e09800 (2015). [DOI] [PMC free article] [PubMed] [Google Scholar]
- 41.Kokel D., Bryan J., Laggner C., White R., Cheung C. Y. J., Mateus R., Healey D., Kim S., Werdich A. A., Haggarty S. J., Macrae C. A., Shoichet B., Peterson R. T., Rapid behavior-based identification of neuroactive small molecules in the zebrafish. Nat. Chem. Biol. 6, 231–237 (2010). [DOI] [PMC free article] [PubMed] [Google Scholar]
- 42.Zhang X. D., A new method with flexible and balanced control of false negatives and false positives for hit selection in RNA interference high-throughput screening assays. J. Biomol. Screen. 12, 645–655 (2007). [DOI] [PubMed] [Google Scholar]
- 43.Kokel D., Rennekamp A. J., Shah A. H., Liebel U., Peterson R. T., Behavioral barcoding in the cloud: Embracing data-intensive digital phenotyping in neuropharmacology. Trends Biotechnol. 30, 421–425 (2012). [DOI] [PMC free article] [PubMed] [Google Scholar]
- 44.Kim S. Thiessen P. A., Bolton E. E., Chen J., Fu G., Gindulyte A., Han L., He J., He S., Shoemaker B. A., Wang J., Yu B., Zhang J., Bryant S. H., PubChem substance and compound databases. Nucleic Acids Res. 44, D1202–D1213 (2016). [DOI] [PMC free article] [PubMed] [Google Scholar]
- 45.Backman T. W. H., Cao Y., Girke T., ChemMine tools: An online service for analyzing and clustering small molecules. Nucleic Acids Res. 39, W486–W491 (2011). [DOI] [PMC free article] [PubMed] [Google Scholar]
- 46.Liu T., Lin Y., Wen X., Jorissen R. N., Gilson M. K., BindingDB: A web-accessible database of experimentally determined protein–ligand binding affinities. Nucleic Acids Res. 35, D198–D201 (2007). [DOI] [PMC free article] [PubMed] [Google Scholar]
- 47.Bento A. P., Gaulton A., Hersey A., Bellis L. J., Chambers J., Davies M., Krüger F. A., Light Y., Mak L., McGlinchey S., Nowotka M., Papadatos G., Santos R., Overington J. P., The ChEMBL bioactivity database: An update. Nucleic Acids Res. 42, D1083–D1090 (2014). [DOI] [PMC free article] [PubMed] [Google Scholar]
- 48.Besnard J., Ruda G. F., Setola V., Abecassis K., Rodriguiz R. M., Huang X.-P., Norval S., Sassano M. F., Shin A. I., Webster L. A., Simeons F. R. C., Stojanovski L., Prat A., Seidah N. G., Constam D. B., Bickerton G. R., Read K. D., Wetsel W. C., Gilbert I. H., Roth B. L., Hopkins A. L., Automated design of ligands to polypharmacological profiles. Nature 492, 215–220 (2012). [DOI] [PMC free article] [PubMed] [Google Scholar]
- 49.van der Maaten L., Hinton G., Visualizing Data using t-SNE. J. Mach. Learn. Res. 9, 2579–2605 (2008). [Google Scholar]
- 50.Burgess H. A., Granato M., Modulation of locomotor activity in larval zebrafish during light adaptation. J. Exp. Biol. 210, 2526–2539 (2007). [DOI] [PubMed] [Google Scholar]
- 51.Burgess H. A., Granato M., Sensorimotor gating in larval zebrafish. J. Neurosci. 27, 4984–4994 (2007). [DOI] [PMC free article] [PubMed] [Google Scholar]
- 52.Best J. D., Berghmans S., Hunt J. J. F. G., Clarke S. C., Fleming A., Goldsmith P., Roach A. G., Non-associative learning in larval zebrafish. Neuropsychopharmacology 33, 1206–1215 (2007). [DOI] [PubMed] [Google Scholar]
- 53.Budick S. A., O’Malley D. M., Locomotor repertoire of the larval zebrafish: Swimming, turning and prey capture. J. Exp. Biol. 203, 2565–2579 (2000). [DOI] [PubMed] [Google Scholar]
- 54.Rihel J., Prober D. A., Arvanites A., Lam K., Zimmerman S., Jang S., Haggarty S. J., Kokel D., Rubin L. L., Peterson R. T., Schier A. F., Zebrafish behavioral profiling links drugs to biological targets and rest/wake regulation. Science 327, 348–351 (2010). [DOI] [PMC free article] [PubMed] [Google Scholar]
- 55.Wolman M. A., Jain R. A., Liss L., Granato M., Chemical modulation of memory formation in larval zebrafish. Proc. Natl. Acad. Sci. U.S.A. 108, 15468–15473 (2011). [DOI] [PMC free article] [PubMed] [Google Scholar]
Associated Data
This section collects any data citations, data availability statements, or supplementary materials included in this article.
Supplementary Materials
Supplementary material for this article is available at http://advances.sciencemag.org/cgi/content/full/4/10/eaav1966/DC1
Supplementary Text
Fig. S1. Automated system to provide a constant and optimal environment for zebrafish growth and development.
Fig. S2. Zebrafish screen quality.
Fig. S3. tSNE maps.
Fig. S4. Behavioral interactions.
Fig. S5. Candidate structure.
Fig. S6. Validation of novel candidate compounds.
Fig. S7. Orexigenic and anorectic candidate compound impact on mice behaviors.
Fig. S8. Characterization of novel and selective regulators of nonassociative learning.
Table S1. Zebrafish screen statistics with different SSMD cutoffs.