
Figure 1.
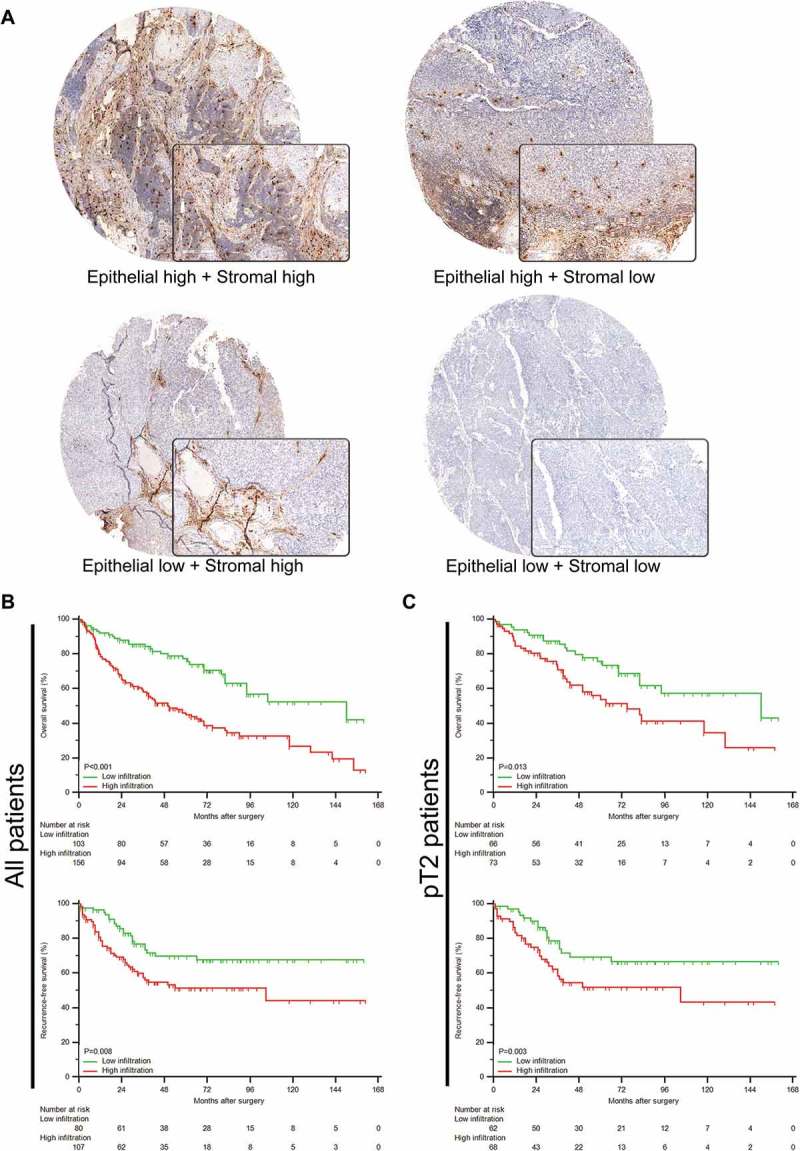
Evaluation of TIMs by immunohistochemistry in MIBC patients. (A) Representative immunohistochemistry images of TIMs infiltration in different tumor tissue compartments. Right bottom pictures showed 200X magnification. (B-C) Kaplan-Meier analyses of OS (top) and RFS (bottom) in all (B) and (C) pT2 patients according to TIMs infiltration in tumor stromal area.