. 2018 Oct 15;7:e39440. doi: 10.7554/eLife.39440

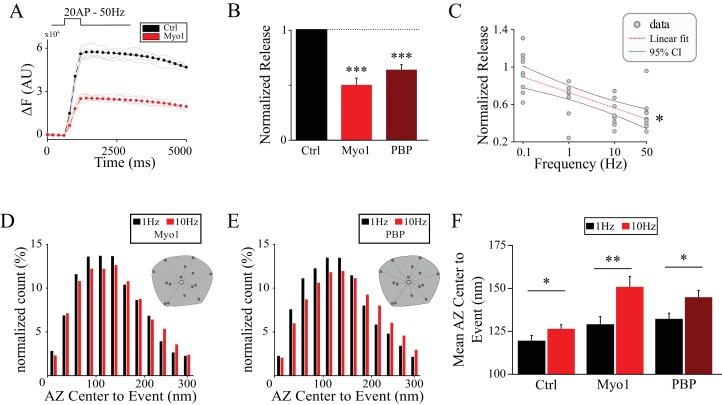
Figure 2. Myosin V controls release site refilling during high-frequency stimulation.

(A) Examples of vGlut1-pHluorin responses at single hippocampal boutons to 20 stimuli trains at 50 Hz for Ctrl (black) and Myo1 (red). (B) Ratio of vGlut1-pHluorin responses in (A) at individual boutons for Myo1 or PBP normalized to the control. (C) Effect of myosin inhibition with Myo1 on the amplitude of vGlut1-pHluorin responses to 20 stimuli trains at individual boutons as a function of the train frequency, averaged across all boutons in the movie and normalized to a control at a corresponding frequency. (D–E) Effect of myosin inhibition with Myo1 (D) or PBP (E) on the distribution of distances of release events to AZ center evoked at 1 Hz vs 10 Hz. (F) Analysis of data in (D,E) showing a mean distance of release events to the AZ center per bouton at 1 Hz or 10 Hz for Ctrl, Myo1 and PBP, respectively. ***=P < 0.001, **=P < 0.01, *=P < 0.05, two-sample t-test; ns – not significant.

Figure 2.

Figure 2—figure supplement 1. Controls for vesicle release measurements during high-frequency stimulation.

Figure 2—figure supplement 1.

(A) vGlut1-pHluorin responses evoked by a high-frequency train (experiment in Figure 2A,B) in the presence of 0.5% DMSO normalized to the control value. (B) LaSEM of hippocampal boutons in culture showing that no significant changes in the AZ size were detected as a result of myosin V inhibition with Myo1 (20 min) during a sustained depolarization with 55 mM KCl (10 min). (C,D,E) Myosin V inhibition does not affect endocytosis dynamics. (C) Sample (grey) and average (black) bouton fluorescence decay after 20 stimuli at 50 Hz in control conditions. Quantification of the data in (C) shows no significant changes in the exponential component of fluorescence decay time (τ1) between Ctrl, Myo and PBP (D), or in the total fluorescence decay time including the initial plateau (τ2) (E). (F, G, H) Analysis of synaptic responses to five consecutive bursts of 20 stimuli at 50 Hz separate by 20 s. Change in synaptic response in two consecutive bursts, measured for each two consecutive bursts and averaged. No significant differences were observed between Ctrl, Myo1, or PBP (F). (A) mplitude of synaptic responses to each of five consecutive bursts in the presence of Myo1 (G) or PBP (H) normalized to control.