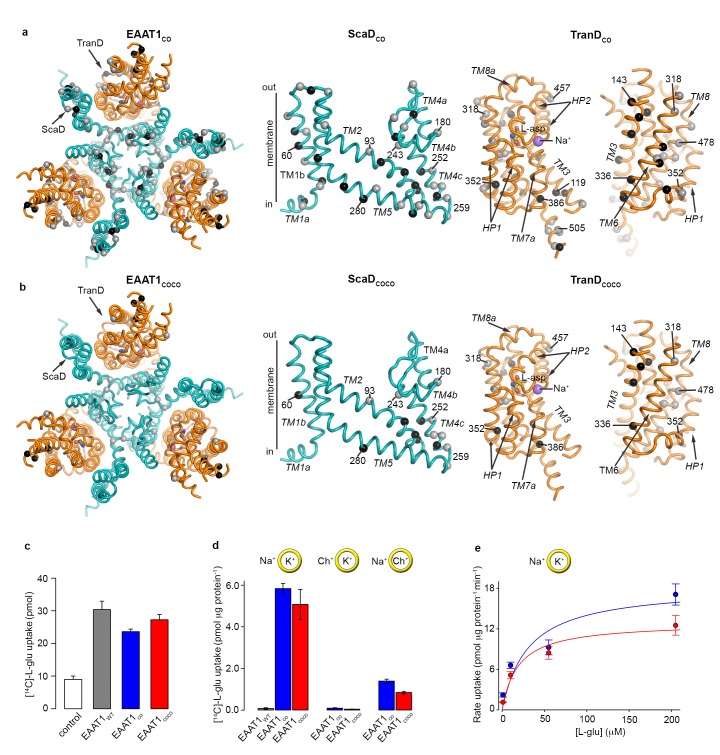
Figure 1. | EAAT1 consensus mutants.
(a-b) Residues exchanged for consensus amino acids in EAAT1CO (a) and EAAT1COCO (b) are mapped into the structure of the EAAT1CRYST (PDB 5LLM) trimer viewed from the extracellular medium (left panel), as well as the scaffold (cyan) and the transport (orange) domains viewed from the membrane. These domains are depicted separately for clarity of display, including two views of the transport domain separated ~ 180° from each other, showing its interface with the scaffold domain (left) and the membrane (right), respectively. Spheres correspond to the alpha carbon atoms of residues that were exchanged by conservative (grey) and non-conservative (black) consensus mutations. (c–d), Radioactive L-glutamate uptake in HEK293 cells expressing the transporters (c), including control cells transfected with a vector lacking EAAT1 genes, and in liposomes with purified reconstituted transporters (d). EAAT1WT data in (d) was originally published in ref. (29). Yellow circles depict the liposomal bilayer separating sodium- (Na+), potassium- (K+), and choline-based (Ch+) solutions. (e), Rate of L-glutamate uptake by purified EAAT1CO (blue) and EAAT1COCO (red) reconstituted in liposomes, as a function of L-glutamate concentration. Solid lines indicate Michaelis-Menten fits to the data with Km values 30.7 ± 25.6 and 18.8 ± 8.3 μM, and Vmax values 18.3 ± 4.3 and 12.8 ± 1.4 pmol μg−1 min−1 for EAAT1CO (blue) and EAAT1COCO (red), respectively. Plots in c–e) depict an average of at least three independent experiments performed with duplicate measurements, and error bars represent s.e.m.


