. 2018 Oct 18;7:e40110. doi: 10.7554/eLife.40110

Figure 4. | Temperature-induced HDX changes.

(a-b) Changes in deuterium incorporation induced by pre-pulses at nearly the T50-SEC of EAAT1CO (50°C) (a), and EAAT1COCO (40°C) (b), respectively, measured after 1 hr at 20°C. The changes are mapped into the structure of the EAAT1CRYST (PDB 5LLM) trimer viewed from the extracellular medium (upper panel), as well as the scaffold (ScaD) and the transport (TranD) domains viewed from the membrane (lower panel), respectively. These domains are depicted separately for clarity of display, and black lines indicate the approximate position of some peptides in the structure, and the substrate (Asp). In the trimeric depiction, arrows point to the interface between protomers. The color code representing the change in deuterium incorporation is depicted in a scale bar (a). Positive values represent increase in deuterium uptake at 50°C (EAAT1CO) and 40°C (EAAT1COCO) over the reference temperature (20°C), respectively.

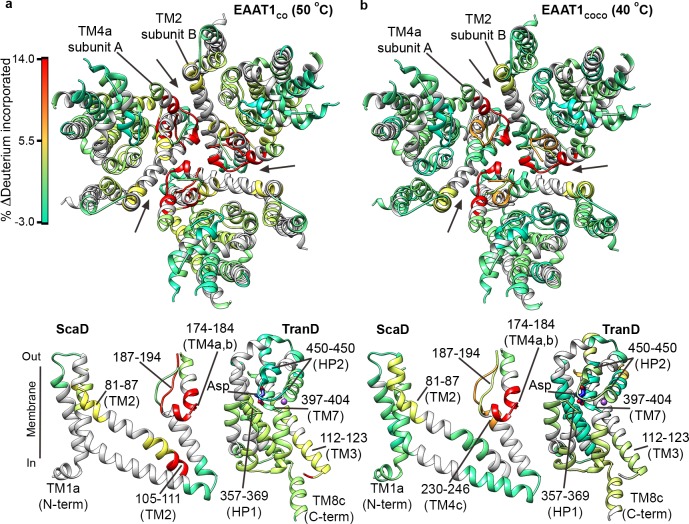
Figure 4.

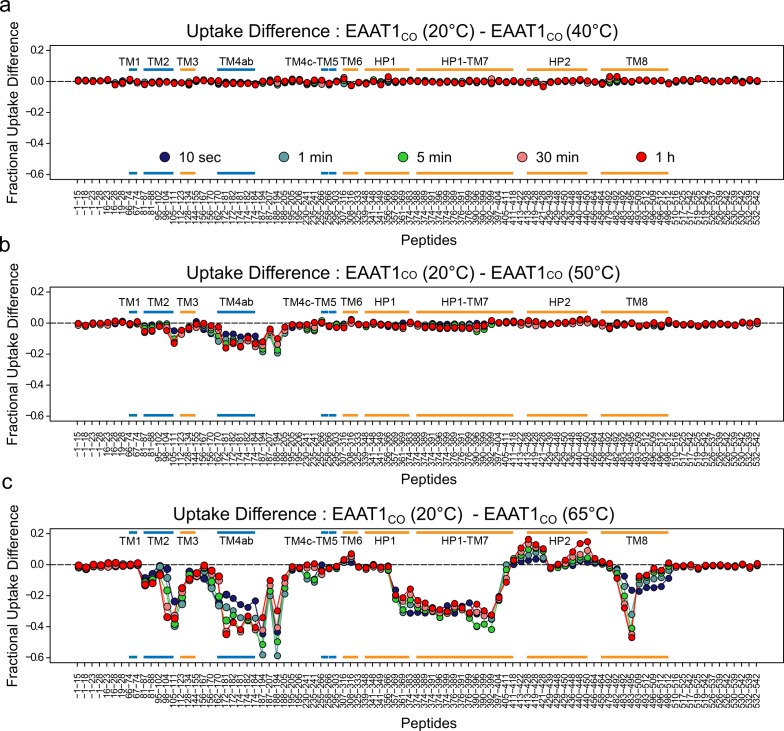
Figure 4—figure supplement 1. | Temperature-induced changes in EAAT1CO HDX pattern.

Figure 4—figure supplement 1.

(a-c) Difference in fractional deuterium uptake between the reference pre-pulse temperature (20°C) and 40°C (a), 50°C (b), or 65°C (c) plotted as a function of the peptide position in the protein sequence. The color code of the MS data acquired from 10 s up to 1 hr is indicated in (a). All identified peptides are plotted. Each point corresponds to the difference in the average fractional uptake value obtained from three independent replicates. Negative differences indicate increase HDX at the test pre-pulse temperature compared to the reference. Small color bars indicate the helical region of the TranD (orange) and ScaD (blue).
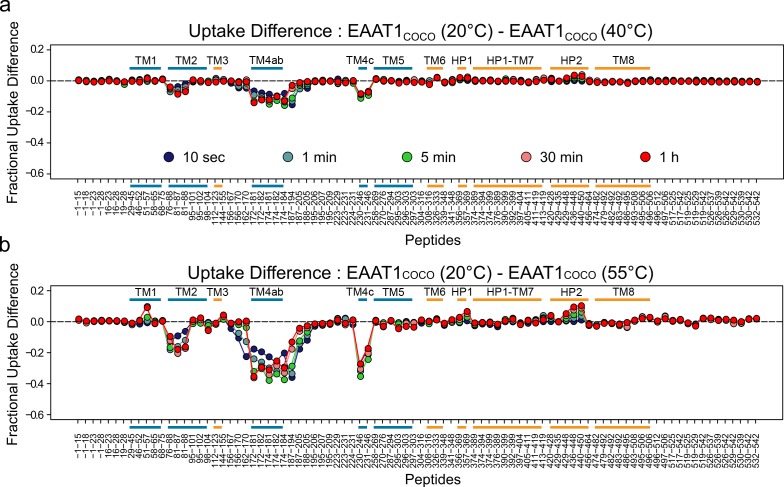
Figure 4—figure supplement 2. | Temperature-induced changes in EAAT1COCO HDX pattern.

Figure 4—figure supplement 2.

(a-b) Difference in fractional deuterium uptake between the reference pre-pulse temperature (20°C), and 40 (a) or 50°C (b) plotted as a function of the peptide position in the protein sequence. The color code of the MS data acquired from 10 s up to 1 hr is indicated in (a). All identified peptides are plotted. Each point corresponds to the difference in the average fractional uptake value obtained from three independent replicates. Negative differences indicate increase HDX at the test pre-pulse temperature compared to the reference. Small color bars indicate the helical region of the TranD (orange) and ScaD (blue).