Abstract
Both mitochondria and lysosomes are essential for maintaining cellular homeostasis, and dysfunction of both organelles has been observed in multiple diseases1–4. Mitochondria are highly dynamic and undergo fission and fusion to maintain a functional mitochondrial network, which drives cellular metabolism 5. Lysosomes similarly undergo constant dynamic regulation by the RAB7 GTPase 1, which cycles from an active GTP-bound state into an inactive GDP-bound state upon GTP hydrolysis. Here we have identified the formation and regulation of mitochondria–lysosome membrane contact sites using electron microscopy, structured illumination microscopy and high spatial and temporal resolution confocal live cell imaging. Mitochondria–lysosome contacts formed dynamically in healthy untreated cells and were distinct from damaged mitochondria that were targeted into lysosomes for degradation 6,7. Contact formation was promoted by active GTP-bound lysosomal RAB7, and contact untethering was mediated by recruitment of the RAB7 GTPase-activating protein TBC1D15 to mitochondria by FIS1 to drive RAB7 GTP hydrolysis and thereby release contacts. Functionally, lysosomal contacts mark sites of mitochondrial fission, allowing regulation of mitochondrial networks by lysosomes, whereas conversely, mitochondrial contacts regulate lysosomal RAB7 hydrolysis via TBC1D15. Mitochondria–lysosome contacts thus allow bidirectional regulation of mitochondrial and lysosomal dynamics, and may explain the dysfunction observed in both organelles in various human diseases.
Main Text
Mitochondrial fission has multiple roles including mitochondrial biogenesis and mitochondrial DNA synthesis5,8, and is regulated by the GTPase dynamin-related protein (Drp1), endoplasmic reticulum (ER), dynamin-2 and actin9–16. In contrast, lysosomal dynamics are regulated by GTP-bound active Rab7, which is recruited to late endosomal/lysosomal membranes but dissociates upon Rab GAP (GTPase-activating protein)-mediated GTP hydrolysis to become inactive, GDP-bound, and cytosolic1,17. Contact sites between mitochondria and lysosomes could thus provide a potential cellular mechanism for simultaneously regulating these dynamics.
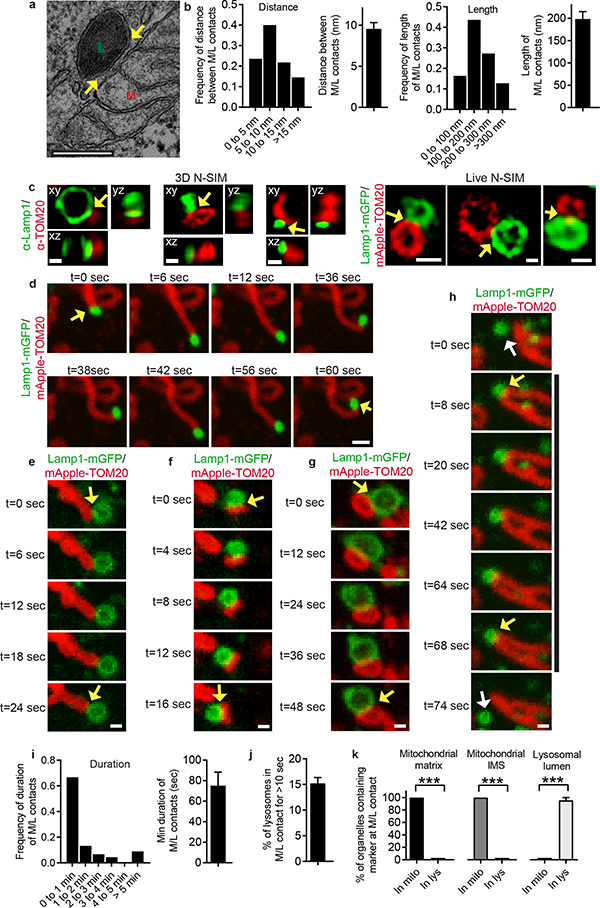
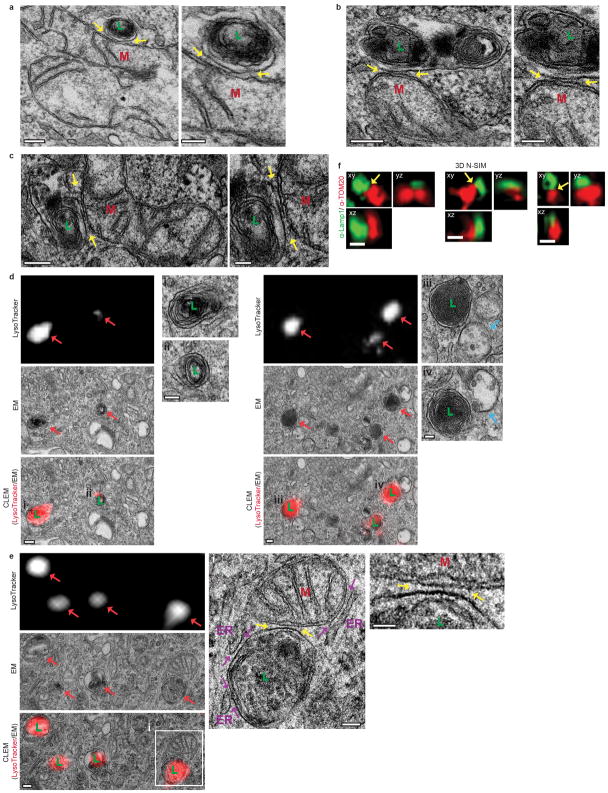
Contacts between mitochondria and melanosomes, multi-vesicular bodies and yeast vacuoles have been previously studied7,18–20. Here, we identified contact sites between mitochondria and lysosomes in mammalian cells by performing electron microscopy (EM) on untreated HeLa cells. Mitochondria and lysosomes formed contacts (Fig. 1a and Extended Data Fig. 1a–c, yellow arrows) with an average distance between membranes of 9.57 ± 0.76 nm consistent with other contact sites21,22, and contact length of 198.33 ± 16.73 nm (n = 55 contacts from 20 cells) (Fig. 1b). Using correlative and light electron microscopy (CLEM), we confirmed that lysosomes/late endosomes positive for the acidic organelle label LysoTracker Red contained ultrastructure electron-dense lumens with irregular content and/or multilamellar membrane sheets (Extended Data Fig. 1d) and could simultaneously contact mitochondria and ER (Extended Data Fig. 1e). 3D super-resolution structured illumination microscopy (N-SIM) of endogenous Lamp1 on late endosomal/lysosomal membranes, and TOM20 on outer mitochondrial membranes further demonstrated that mitochondria-lysosome contacts spanned >200nm in the z-plane (n = 210 examples from 26 cells) (Fig. 1c (left) and Extended Data Fig. 1f).
Figure 1. Mitochondria and lysosomes form stable membrane contact sites.
a,b, Representative electron microscopy image of mitochondria (M) and lysosome (L) contact (yellow arrow) in untreated HeLa cells and quantification of distance between contact membranes and length of contact (n=55 examples from 20 cells). c, Representative structured illumination microscopy (N-SIM) images of mitochondria-lysosome contacts (yellow arrows) in fixed HeLa cells stained for endogenous Lamp1 (lysosome) and TOM20 (mitochondria) and imaged in Z-stacks showing contacts extending >200nm in the Z-plane (3D N-SIM; left; n=210 examples from 26 cells) and in living HeLa cells expressing Lamp1-mGFP and mApple-TOM20 (Live N-SIM; right; n=43 examples from 10 cells). d–h, Representative time-lapse confocal images of stable mitochondria-lysosome contacts (yellow arrows) in living HeLa cells expressing Lamp1-mGFP (lysosomes) and mApple-TOM20 (mitochondria) (n=67 examples from 23 cells). White arrows in h mark lysosomes before or after contact tethering to mitochondria i,j, Quantitation of duration of mitochondria-lysosome contacts and percent of lysosomes contacting mitochondria (for >10 sec) from confocal time lapse images (n=45 examples from 10 cells). k, Quantification of percent of mitochondria (TOM20) or lysosomes (Lamp1) positive for mitochondrial intermembrane space protein (SMAC-EGFP; n=57 examples from 12 cells), mitochondrial matrix protein (mito-BFP; n=104 events from 23 cells) or lysosomal lumen marker (pulse-chased dextran; n=66 events from 18 cells) at mitochondria-lysosome contacts in living HeLa cells. Data are means ± SEM. (***P<0.0001, unpaired two-tailed t test). Scale bars, 200 nm, a; 500nm, c (3D N-SIM); 500 nm, c (Live N-SIM; left, right); 100 nm, c (Live N-SIM; middle); 1 μm, d; 0.5 μm, e–h.
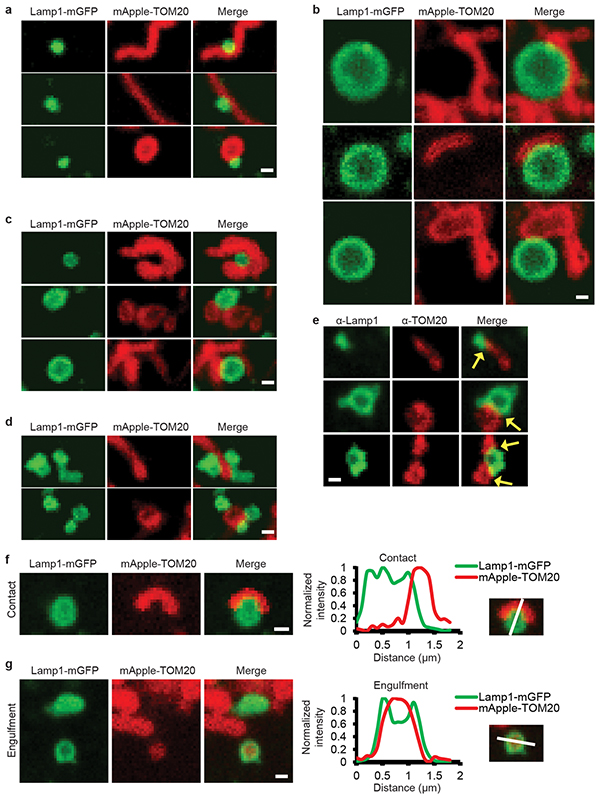
We next examined mitochondria-lysosome contacts in live cells using super-resolution N-SIM, and found that vesicles positive for LAMP1 labelled with mGFP (LAMP1–mGFP) and mitochondria expressing TOM20 labelled with mApple (mApple–TOM20) formed contacts in living HeLa cells (Fig. 1c (right)). Using confocal microscopy at high spatial and temporal resolutions, mitochondria were found to contact both small (vesicle diameter < 0.5μm) and larger (vesicle diameter > 1μm) Lamp1 vesicles (Extended Data Fig. 2a,b), and Lamp1 vesicles could simultaneously contact multiple mitochondria (Extended Data Fig. 2c) and vice versa (Extended Data Fig. 2d). We also observed multiple examples of mitochondria-lysosome contacts stained for endogenous Lamp1 and TOM20 under confocal microscopy (n = 341 examples from 25 cells) (Extended Data Fig. 2e).
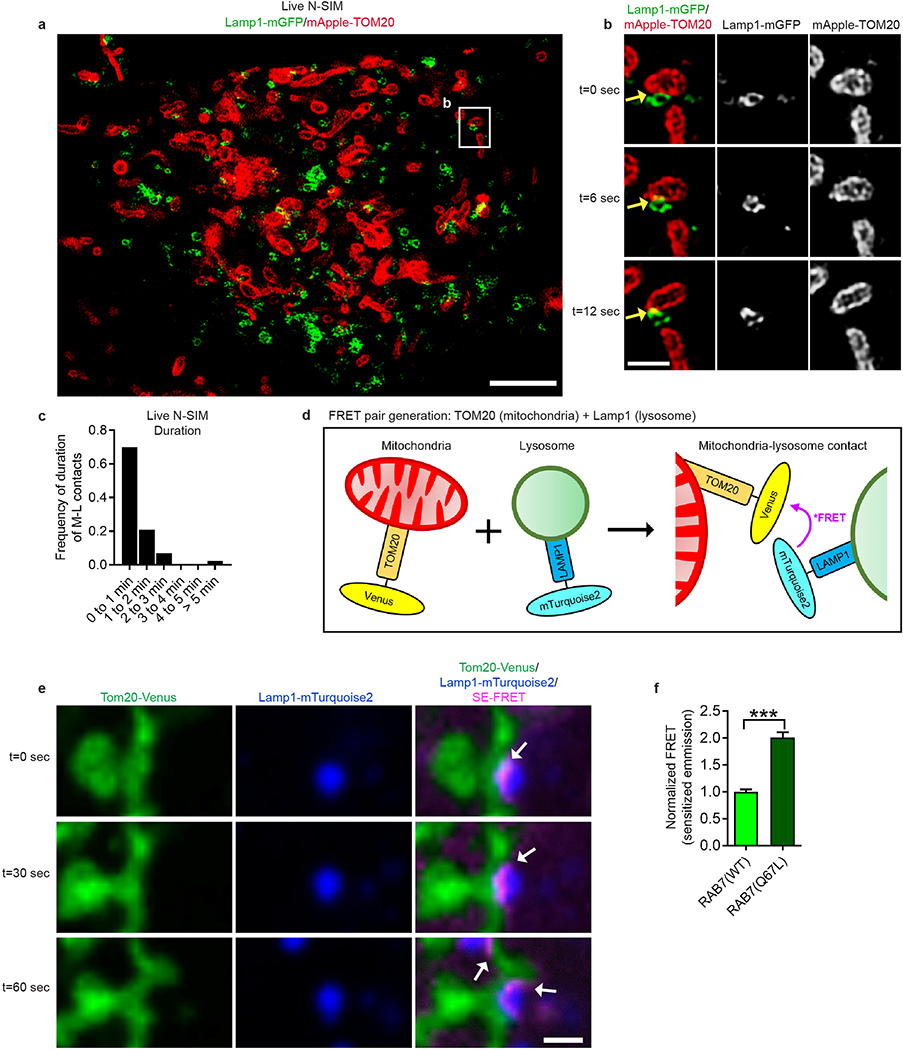
Lamp1 vesicles and mitochondria remained in stable contacts over time (Fig. 1d–g, yellow arrows; Video 1), with Lamp1 vesicles approaching mitochondria to form stable contacts (Fig. 1h, yellow arrows), but eventually leaving mitochondria (white arrow) without engulfing mitochondria (Extended Data Fig. 2f,g). By confocal microscopy and live cell N-SIM, contacts lasted for ≥ 10 sec (Fig. 1i and Extended Data Fig. 3a–c), with ~15% of Lamp1 vesicles in the cell contacting mitochondria at any given time (Fig. 1j). Furthermore, sensitized emission fluorescence resonance energy transfer (SE-FRET) was observed between TOM20-Venus (outer mitochondrial membrane) and Lamp1-mTurquoise2 (lysosomal membrane) at mitochondria-lysosome contacts (Extended Data Fig. 3d,e) further confirming the formation of these contacts in living cells (Extended Data Fig. 3e).
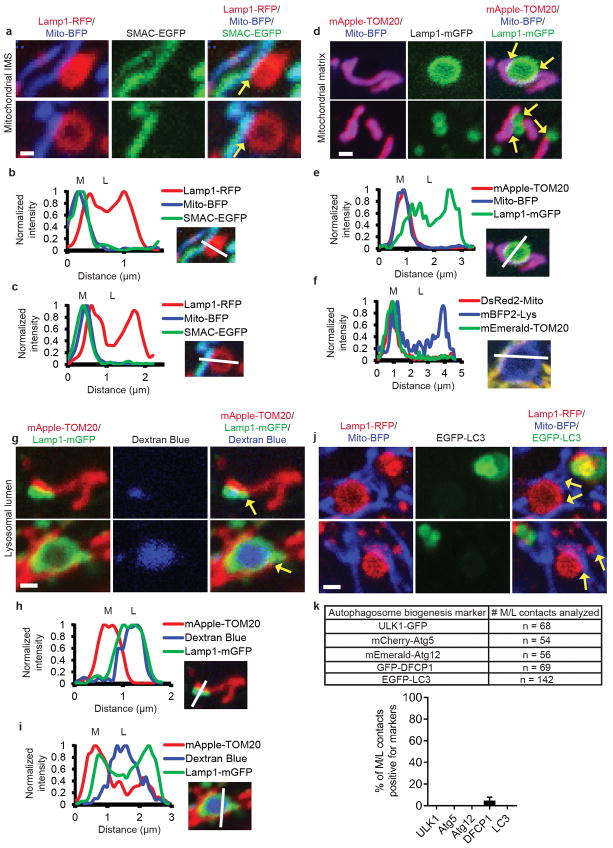
Next, we analyzed whether mitochondria-lysosome contacts represented sites of bulk protein transfer or mitochondrial degradation either directly through mitochondrial-derived vesicles (MDVs) fusing with lysosomes7 or indirectly through mitophagy6. Intermembrane space mitochondrial proteins and mitochondrial matrix proteins (Fig. 1k and Extended Data Fig. 4a–f) were not bulk transferred into lysosomes, and conversely, lysosomal luminal content marked by dextran was not bulk transferred into mitochondria (Fig. 1k and Extended Data Fig. 4g–i). Moreover, mitochondria in contact with lysosomes were significantly larger in size (>500 nm) than MDVs (~100 nm)7 and contained mitochondrial matrix proteins (Fig. 1k and Extended Data Fig. 4d–f), distinct from previously described Tom20-positive MDVs23. Mitochondria contacting lysosomes also did not undergo mitophagy, as they were not engulfed by LC3-positive autophagosomes (Extended Data Fig. 4j) or positive for autophagosome biogenesis markers (Extended Data Fig. 4k), suggesting that mitochondria-lysosome contacts do not lead to bulk transfer of organelle luminal content or bulk mitochondrial degradation.
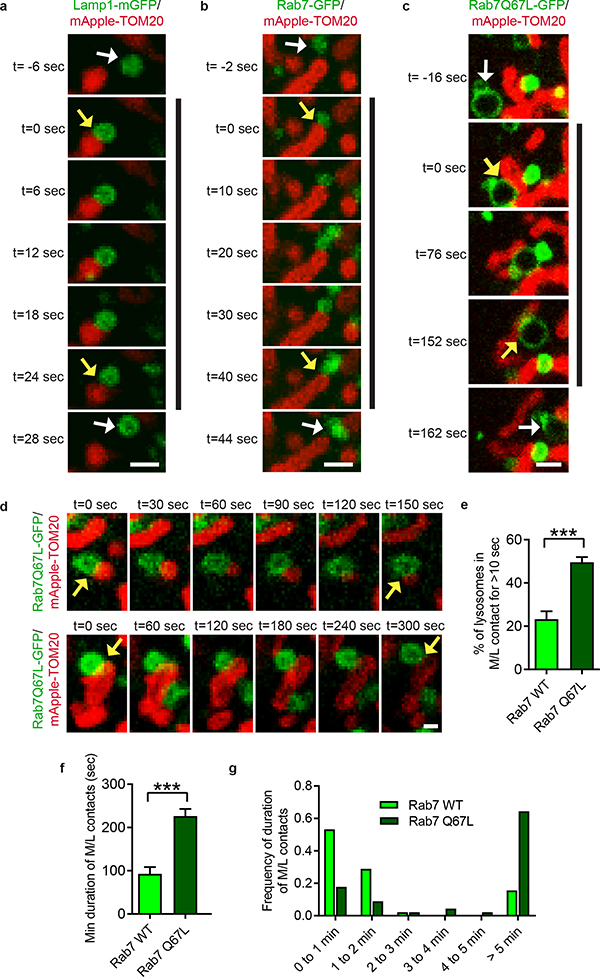
We then investigated whether mitochondria-lysosome contacts might be modulated by the lysosomal regulator Rab7 GTPase1. In contrast to Lamp1-mGFP (Fig. 2a; Video 2) or wild-type Rab7-GFP (Fig. 2b), expression of constitutively active GTP-bound mutant Rab7 Q67L-GFP which localized to lysosomal membranes (Fig. 2c,d; Video 3) dramatically increased the percentage of lysosomes forming stable contacts with mitochondria (Fig. 2e), and mitochondria-lysosome contact duration (n = 45 events per condition) (Fig. 2f,g). Rab7 Q67L further resulted in a 2-fold increase in TOM20/Lamp1 mitochondria-lysosome FRET intensity compared to wild-type Rab7 (n = 200 cells per condition) (Extended Data Fig. 3f), suggesting that GTP-bound Rab7 promotes contact formation while Rab7 GTP hydrolysis may be required for mitochondria-lysosome contact untethering.
Figure 2. Rab7 GTP hydrolysis promotes mitochondria-lysosome contact untethering.
a–c, Representative time-lapse images of lysosome in cytosol (white arrow; top panel) approaching mitochondria to form a stable contact (yellow arrows; black line) before leaving mitochondria (white arrow; bottom panel) in living HeLa cells expressing mApple-TOM20 (mitochondria) and lysosomal markers Lamp1-mGFP (a), Rab7-GFP (b) or constitutively active GTP-bound Rab7 Q67L - GFP mutant unable to undergo GTP hydrolysis (c) (n=45 events from 9 cells per condition). d, Representative time-lapse images of mitochondria-lysosome contacts (yellow arrows) for >150 seconds in Rab7Q67L-GFP cells (n=45 events from 9 cells per condition). e–g, Rab7 Q67L mutant leads to increased percentage of lysosomes in contacts (n=12 cells per condition), and increased minimum duration of mitochondria-lysosome contacts (n=45 events from 9 cells per condition). Data are means ± SEM. (***P<0.0001, unpaired two-tailed t test). Scale bars, 1 μm, a–c; 0.5 μm, d.
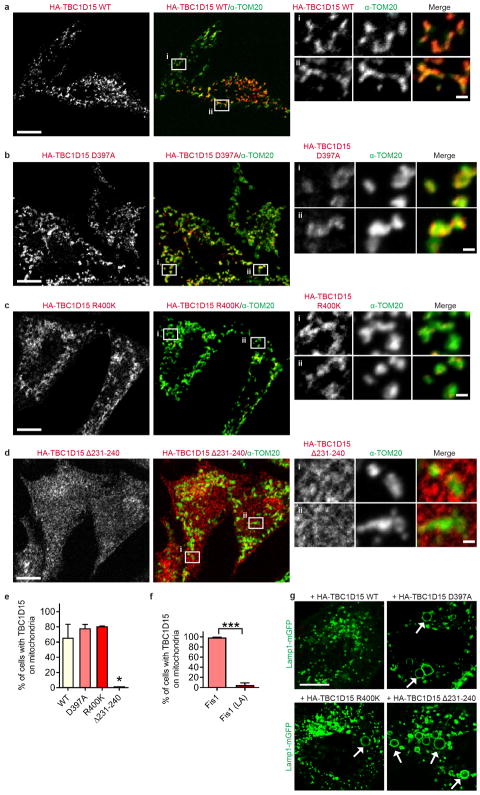
We thus examined how Rab7 GTP hydrolysis might be regulated at mitochondria-lysosome contacts. TBC1D15 is a Rab7-GAP recruited to mitochondria by the mitochondrial protein Fis124,25 to drive Rab7 GTP hydrolysis26,27, potentially allowing mitochondria to regulate both contact untethering and lysosomal Rab7 hydrolysis via TBC1D15. Consistent with previous studies24,25, TBC1D15 mitochondrial localization was dependent on Fis1 binding (Extended Data Fig. 5a,d,e,f) but not inhibited by mutants lacking GAP activity (D397A and R400K in the TBC domain)25 (Extended Data Fig. 5b,c,e). Moreover, expression of mutant TBC1D15 could induce abnormally large lysosomes (Extended Data Fig. 5g), characteristic of inhibiting Rab7 GTP hydrolysis.
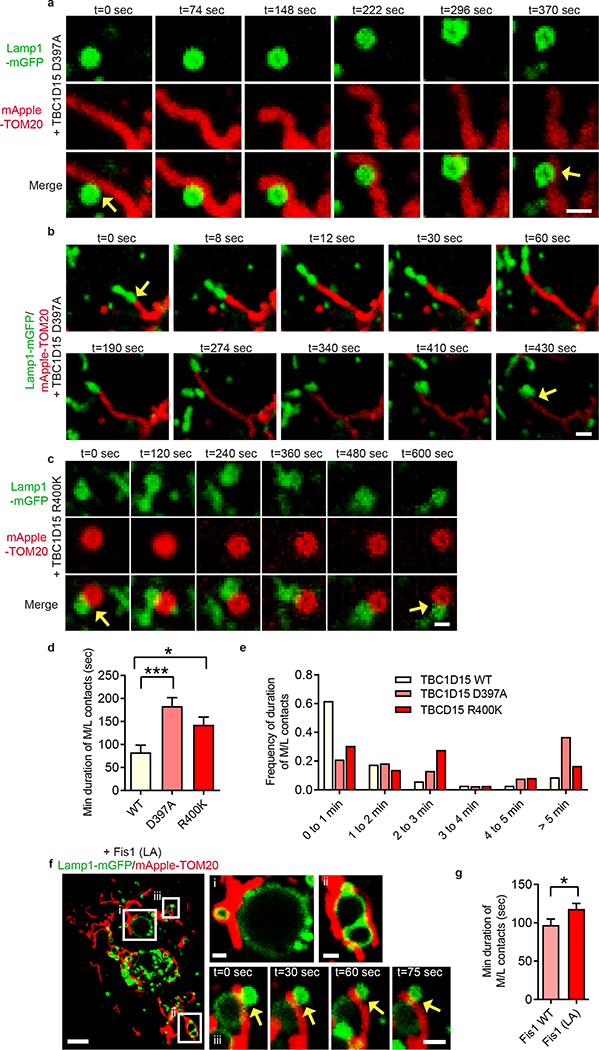
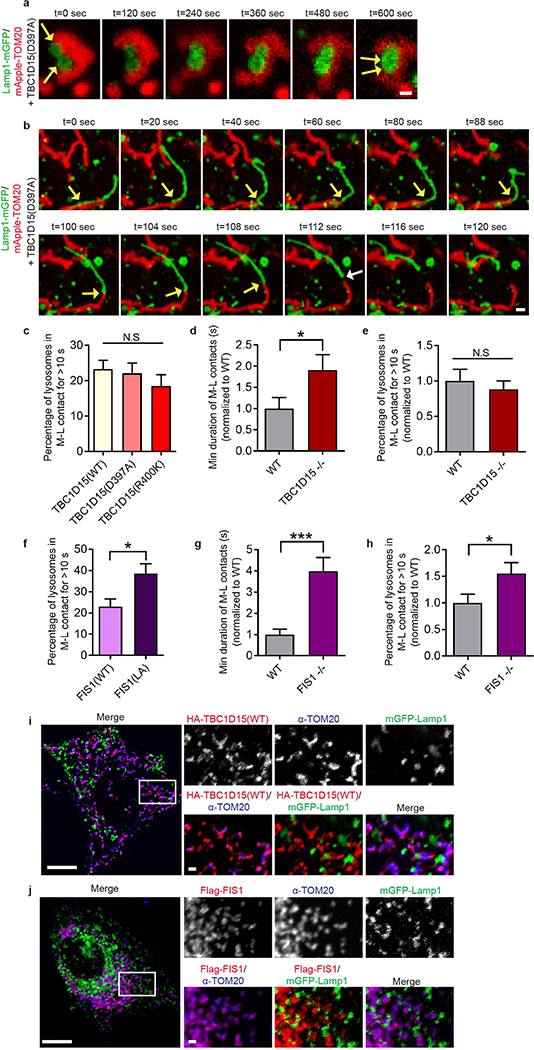
Using live cell time-lapse imaging, we found that the GAP mutants TBC1D15 D397A (Fig. 3a,b and Extended Data Fig. 6a,b; Video 4) and TBC1D15 R400K (Fig. 3c) dramatically increased mitochondria-lysosome contact duration compared to wild-type TBC1D15 (n = 34–38 events per condition) (Fig. 3d,e) but did not alter the percentage of lysosomes forming contacts with mitochondria (Extended Data Fig. 6c). TBC1D15 −/− HCT116 cells generated using TALENs and previously characterized24 also showed a similar increase in contact duration, but no change in contact formation (Extended Data Fig. 6d,e), suggesting that Rab7 GTP hydrolysis by TBC1D15 does not regulate contact formation but rather, contact duration by promoting contact untethering upon GTP hydrolysis.
Figure 3. Mitochondrial recruitment of TBC1D15, a RAB7 GAP, by FIS1 drives RAB7 GTP hydrolysis to promote mitochondria–lysosome contact untethering.
a–e, Representative time-lapse images of stable mitochondria-lysosome contacts (yellow arrows) for >300 sec in living HeLa cells expressing mApple-TOM20 (mitochondria), Lamp1-mGFP (lysosome) and TBC domain mutants TBC1D15 D397A or R400K lacking GAP activity, which increase the minimum duration of mitochondria-lysosome contacts compared to wild-type TBC1D15 (n=34 events from 12 cells, wild-type; n=38 events from 10 cells, D397A; n=36 events from 11 cells, R400K) (*P = 0.0404, ***P = 0.0002, ANOVA with Tukey’s post-hoc test (d)). f,g, Fis1 (LA) mutant (unable to recruit TBC1D15 to mitochondria) leads to increased minimum duration of mitochondria-lysosome contacts compared to wild-type Fis1 (n=45 events from 9 cells per condition) (*P = 0.049, unpaired two-tailed t test). Data are means ± SEM. Scale bars, 1 μm, a, b; 0.5 μm, c, 5 μm, f; 1 μm, f (insets).
Contact untethering was further dependent on TBCD15’s mitochondrial localization, as expression of a Fis1 (LA) mutant unable to recruit TBC1D15 to mitochondria25 (Extended Data Fig. 5f) also induced abnormally enlarged lysosomes which contacted mitochondria (Fig. 3f, panels i and ii), resulting in increased mitochondria-lysosome contact duration (Fig. 3f, panel iii and Fig. 3g) and number (Extended Data Fig. 6f). Consistent with these findings, Fis1 −/− HCT116 cells24 also showed similar increases in contact duration and number (Extended Data Fig. 6g,h). However, neither TBC1D15, Fis1 nor Rab7 localization was restricted to or concentrated at mitochondria-lysosome contact sites (Fig. 2b and Extended Data Fig. 6i,j). Taken together, these results suggest that Rab7 GTP hydrolysis is regulated at mitochondria-lysosome contacts by the GAP activity of TBC1D15, which is recruited to mitochondria by Fis1. Inhibition of Rab7 GTP hydrolysis leads to both defective lysosomal morphology as well as mitochondria-lysosome contacts, which are unable to untether, and consequently remain in contact for longer duration.
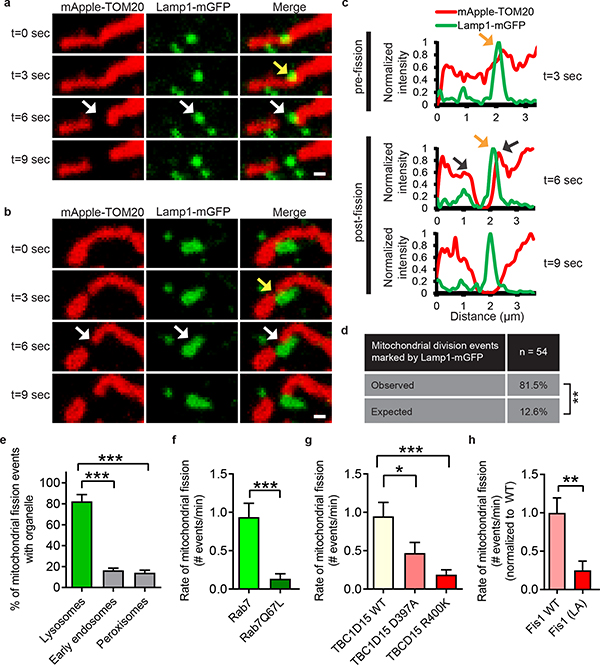
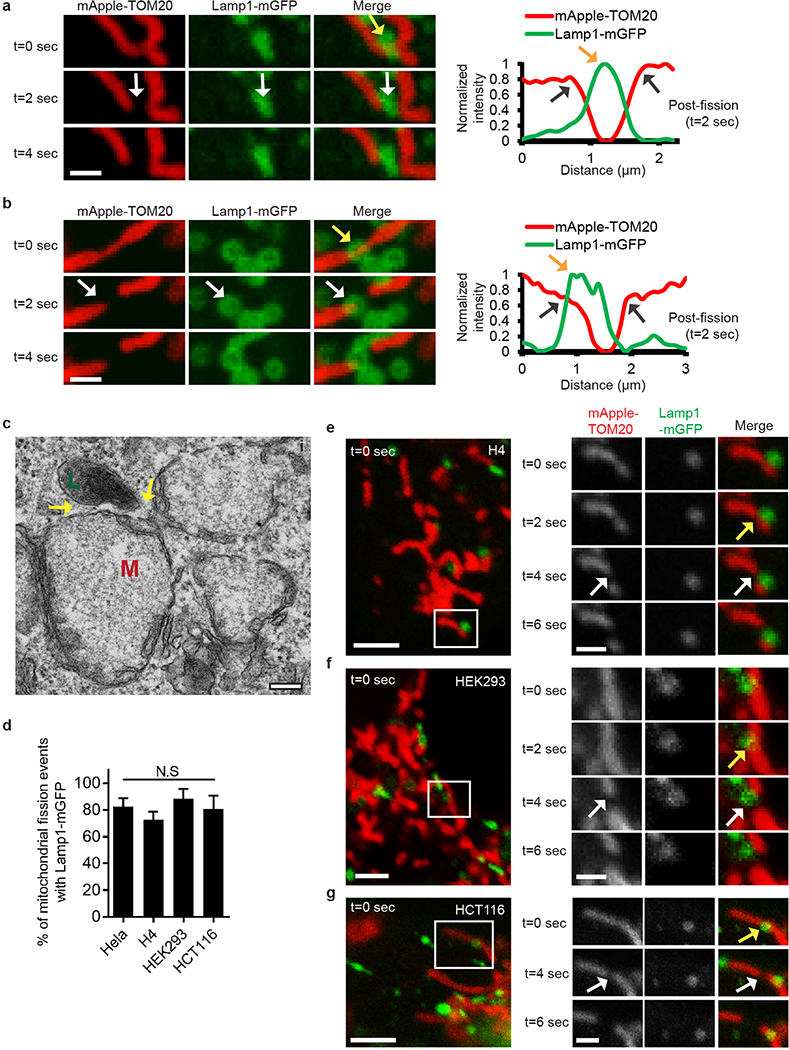
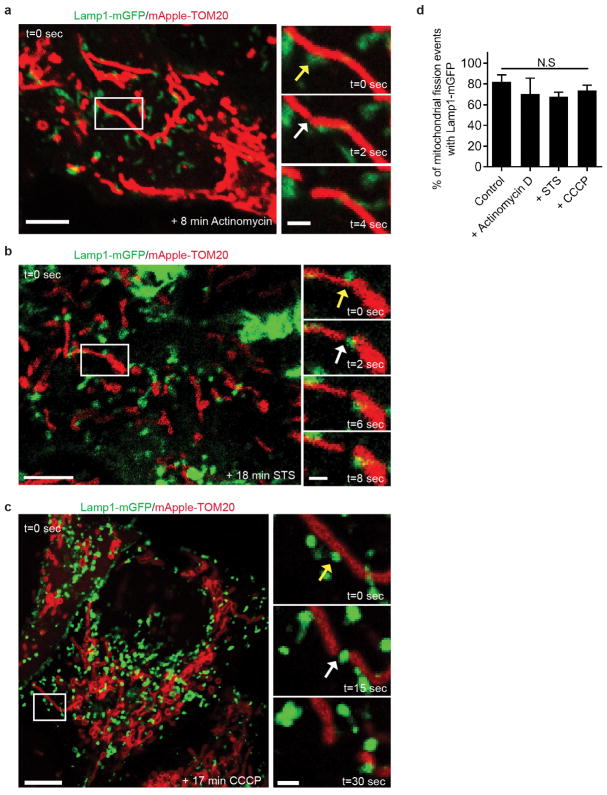
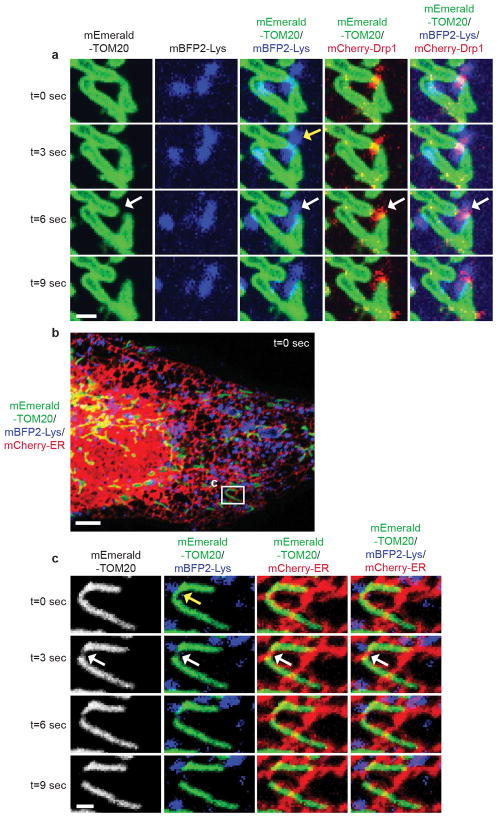
Finally, we examined whether mitochondria-lysosome contacts also regulate mitochondrial dynamics. Mitochondria underwent fission events at 1.44 events/min on average in live HeLa cells by time-lapse confocal microscopy. Surprisingly, sites of mitochondrial fission were predominantly marked by a Lamp1 vesicle (yellow arrows) followed by a fission event (white arrows) (Fig. 4a–c; Extended Data Fig. 7a–c and Videos 5, 6). Lamp1 vesicles contacted mitochondria at 81.5% of mitochondrial fission sites (n = 44/54 events from 18 cells), which was significantly greater than expected by random chance (12.6%) (Fig. 4d) and greater than the percentage of contacts made by other vesicles such as early endosomes (GFP–EEA1) or peroxisomes (mEmerald–peroxisome) (< 20% of fission events) (Fig. 4d). Lamp1 vesicles also localized to mitochondrial fission events at similar rates in other cell types including H4 neuroglioma, HEK293 and HCT116 cells (Extended Data Fig. 7d–g) and upon induction of mitochondrial fragmentation using Actinomycin D, STS or CCCP (Extended Data Fig. 8a–d). Mitochondrial fission events marked by lysosomes were also positive for mCherry-Drp1 oligomerization (Extended Data Fig. 9a) and ER tubules labelled with the endoplasmic reticulum markers mCherry–ER (100%; n = 54/54 events from 16 cells; Extended Data Fig. 9b,c), BFP-KDEL (100%; n = 24/24 events from 13 cells) or GFP-sec61β (100%; n = 11/11 events from 11 cells), demonstrating that mitochondria-lysosome contacts mark the site of Drp1 and ER-positive mitochondrial fission events.
Figure 4. Mitochondria–lysosome contacts mark sites of mitochondrial fission regulated by RAB7 GTP hydrolysis.
a,b, Representative time-lapse images of lysosomes contacting mitochondria at the site of mitochondrial division (yellow arrow) prior to fission (white arrows) in living HeLa cells expressing Lamp1-mGFP (lysosomes) and mApple-TOM20 (mitochondria) (n=62 events from 23 cells). c, Linescan corresponding to Fig. 4a showing a lysosome contacting mitochondria pre-fission (yellow arrow; top panel) and remaining in contact post-fission (yellow arrow; middle panel) after the mitochondria has divided into two daughter mitochondria (grey arrows; middle panel). d, Percentage of mitochondrial division events marked by Lamp1 vesicles in living HeLa cells expressing Lamp1-mGFP (lysosomes) and mApple-TOM20 (mitochondria) (n=54 events from 18 cells, ***P < 0.0001, Fisher’s exact test). Significantly more events were marked by Lamp1 vesicles (81.5%) than expected by random chance (12.6%), or by early endosomes (GFP-EEA1) (n=45 events from 17 cells), or peroxisomes (mEmerald-peroxisomes) (n=49 events from 17 cells; ***P<0.0001). e–g, Rab7Q67L GTP-hydrolysis deficient mutant (n=10 cells, Rab7; n=13 cells, Rab7Q67L; ***P = 0.0008), TBC1D15 GAP mutants (D397A or R400K) (n=13 cells per condition; *P = 0.451, ***P = 0.001) or Fis1 (LA) mutant (unable to bind TBC1D15) (n=19 cells, Fis1 WT; n=18 cells, Fis1 (LA); **P = 0.0027) lead to decreased rates of mitochondrial fission events (n ≥ 10 cells per condition). Data are means ± SEM. (ANOVA with Tukey’s post-hoc test (d,f), unpaired two-tailed t test (e,g)). Scale bars, 0.5 μm, a, b.
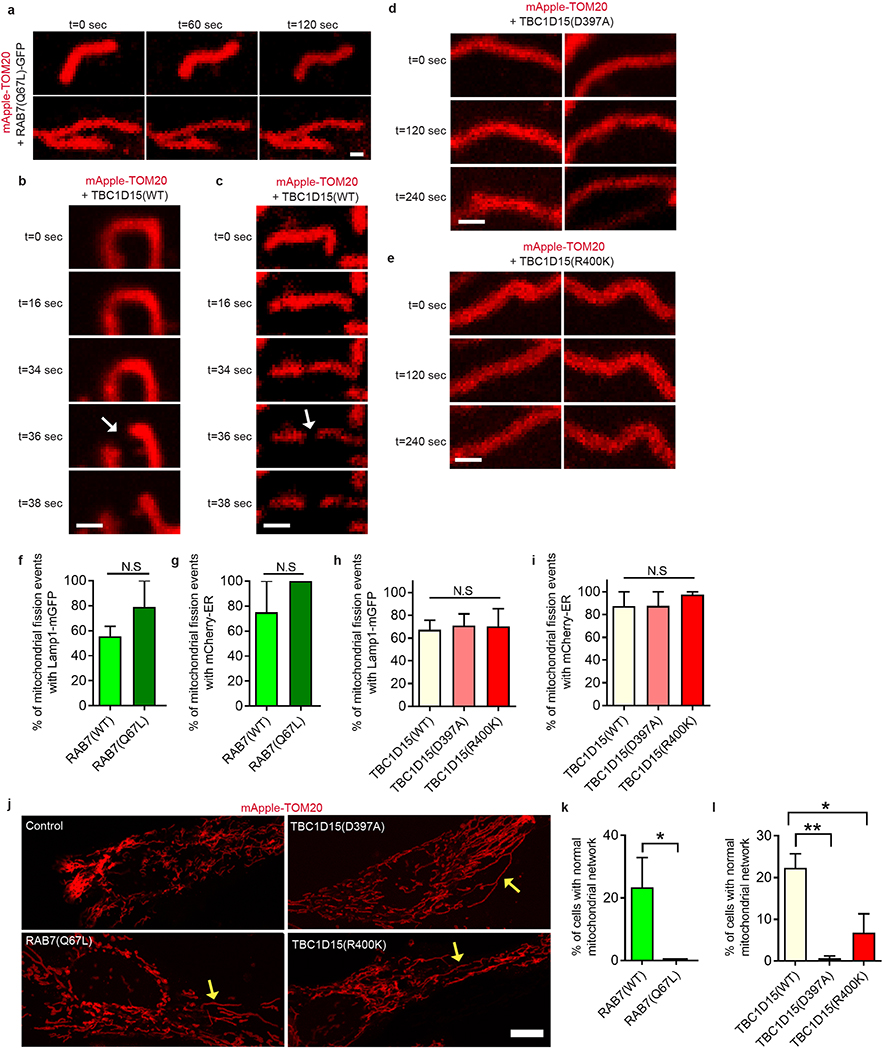
As Rab7 GTP hydrolysis regulated mitochondria-lysosome contacts, we asked whether it also regulated mitochondrial fission. Rab7 Q67L dramatically reduced the rate of mitochondrial fission (Fig. 4e) resulting in mitochondria, which did not undergo fission over time (Extended Data Fig. 10a). In addition, both the GAP mutants TBC1D15(D397A) and TBC1D15(R400K) (Fig. 4f and Extended Data Fig. 10b–e) and Fis1 (LA), which disrupts TBC1D15 mitochondrial recruitment (Fig. 4g) dramatically reduced mitochondrial fission rates. However, of these few fission events which occurred, the percent of mitochondrial fission marked by lysosomes or ER were not altered by Rab7Q67L (Extended Data Fig. 10f,g) or TBC1D15 mutants (Extended Data Fig. 10h,i), further confirming that the majority of fission events are positive for lysosomes and ER. Moreover, inhibition of Rab7 GTP hydrolysis by Rab7Q67L or TBC1D15 GAP mutants reduced the percentage of cells with normal mitochondrial networks that were not hypertethered or overly elongated (Extended Data Fig. 10j–l). Thus, mitochondrial TBC1D15 recruited by Fis1 promotes Rab7 GTP hydrolysis at mitochondria-lysosome contacts to regulate both lysosomal morphology and mitochondrial fission.
In summary, we propose that regulation of mitochondria-lysosome contacts occurs in two steps: 1. Formation and stabilization of contacts promoted by lysosomal GTP-bound Rab7; followed by 2. Contact untethering by TBC1D15, a RAB7 GAP recruited to mitochondria by FIS1, which drives RAB7 GTP hydrolysis at contact sites and results in dissociation of GDP-bound RAB7 from the membrane, which can no longer maintain stable contacts, which can no longer maintain stable contacts.
In addition, our work suggests that mitochondria-lysosome contacts regulate at least two important aspects of mitochondrial and lysosomal dynamics. First, lysosomal Rab7 hydrolysis is regulated by mitochondrial TBC1D15/Rab7-GAP, providing a mechanism for mitochondria to modulate lysosomal dynamics by shutting down active Rab7, which regulates lysosomal transport, fusion and maturation1. Of note, the distance between TBC1D15’s mitochondrial Fis1 binding site25 and its TBC/GAP domain for driving lysosomal Rab7 GTP hydrolysis is sufficient to span the ~10nm distance between membranes at mitochondria-lysosome contact sites. This ability to regulate Rab GTP/GDP cycling on the opposing membrane of a target organelle may be similar to that proposed for GEF activation of Golgi-localized Rab GTPase Ypt1p by the TRAPPI complex on ER-derived COPII-coated vesicles28.
Second, mitochondria-lysosome contacts mark sites of mitochondrial fission, conversely allowing lysosomal RAB7 to regulate mitochondrial dynamics. Previous studies examining TBC1D15’s role on mitochondrial morphology at steady state 24,25 and Fis1’s role in regulating mitochondrial fission machinery have been controversial. While our data suggest that both TBC1D15 and Fis1 indirectly regulate mitochondrial fission events via lysosomal Rab7 GTP hydrolysis, further work examining their mechanistic role in this process will be important As membrane contact sites mediate multiple forms of interorganellar communication22,29, we predict that mitochondria-lysosome contacts also function as platforms for metabolic exchanges between the two organelles. Thus, future studies examining additional roles and protein tethers involved at these contacts will provide valuable insight into cellular organization and the pathogenesis of multiple diseases linked to both mitochondrial and lysosomal dysfunction2–4,30.
Methods
Reagents
The following plasmids were obtained from Addgene: LAMP1-mGFP was a gift from Esteban Dell’Angelica (Addgene #34831)31, Lamp1-RFP was a gift from Walther Mothes (Addgene #1817)32, BFP-KDEL, mito-BFP, mCh-Drp1 and mCh-Rab7A were gifts from Gia Voeltz (Addgene #49150, #49151, #49152, #61804)10,33, EGFP-LC3 was a gift from Karla Kirkegaard (Addgene #11546)34, pMXs-puro GFP-DFCP1 was a gift from Noboru Mizushima (Addgene #38269)35, pAc-GFPC1-Sec61beta was a gift from Tom Rapoport (Addgene #15108), pCMV3-SMAC-HA-eGFP was a gift from Richard Kahn (Addgene #67489), mVenus C1 was a gift from Steven Vogel (Addgene #27794)36, pKanCMV-mClover3-mRuby3 was a gift from Michael Lin (Addgene #74252)37, EGFP-Rab7A WT and Q67L were gifts from Qing Zhong (Addgene #28047, #28049)38 and mTagBFP2-Lysosomes-2039, mApple-TOMM20-N-10, mEmerald-TOMM20-C-10, DsRed2-Mito-7, mCherry-ATG5-C-18, mEmerald-ATG12-N-18, mCherry–ER-3, mEmerald–Peroxisome-2 and pmTurquoise2–N1 were gifts from M. Davidson (Addgene #55308, #54955, #54281, #55838, # 54995, # 54003, #55041, #54228, #60561) and GFP–EEA1 wild type was a gift from S. Corvera (Addgene #42307) 40. N-terminal HA-tagged TBC1D15 plasmids (wild-type, D397A, R400K, Δ231-240) and Flag-Fis1 (wild-type and LA mutant) were generous gifts from Naotada Ishihara25,40. YFP-TBC1D15 was a generous gift from Richard Youle24. ULK1-GFP was a generous gift from Vojo Deretic41. The following reagents were also used: Dextran Cascade Blue 10000MW (Thermo Fisher; D1976), Lamp1 rabbit antibody (Sigma, L1418), Tom20 mouse antibody (BD biosciences, 612278), Flag rabbit antibody (Sigma, F7425), HA rabbit antibody (Cell Signaling, 3724S), HA mouse antibody (Cell Signaling, 2367S) and Alexa fluorophore-conjugated secondary antibodies from Molecular Probes (Invitrogen).
Cell culture and Transfection
HeLa cells (gift from Michael Schwake (ATCC)) and HEK293 cells (human embryonic kidney cell line 293FT (Life Technologies)) were cultured in DMEM (Gibco; 11995-065) supplemented with 10% (vol/vol) FBS, 100 units/mL penicillin, and 100 μg/mL streptomycin. Wild-type, Fis1 −/− and TBC1D15 −/− HCT116 cells were gifts from Richard Youle24 and cultured in McCoy’s 5A with L-glutamine (ATCC 30-2007) supplemented with 10% (vol/vol) FBS, 100 units/mL penicillin, and 100 μg/mL streptomycin and nonessential amino acids. H4 neuroglioma cells42 were cultured in Optimem + 5% FBS, 200ug/ml geneticin and hygromycin, 1% penicillin / streptomycin (Life Technologies) and treated with 1ug/ml doxycycline (Sigma) for 3 days. All cells were maintained at 37 °C in a 5% CO2 incubator and previously verified by cytochrome c oxidase subunit I (COI) and short tandem repeat (STR) testing and were tested and found negative for mycoplasma contamination. Cells were transfected using Lipofectamine 2000 (Invitrogen). Dextran blue was used at 1mg/mL and pulsed via incubation in media for 15 min and chased for 4 h, resulting in 95% of Lamp1-positive vesicles containing dextran blue by this timepoint. For drug treatments, live cells were imaged while treated for 20 minutes with Actinomycin D (10 μM) (Sigma; A9415), STS (1 μM) (Sigma; S6942) or CCCP (20 μM) (Sigma C2759). For live imaging, cells were grown on glass bottom culture dishes (MatTek; P35G-1.5-14-C).
Immunofluorescence
Cells were plated on coverslips and fixed in 3% (vol/vol) paraformaldehyde for 15 min and permeabilized with 2% BSA and 0.1% saponin. Fixed cells were incubated in primary antibody for 1 h, washed 3 × 5 min, incubated in secondary antibody for 1 h, washed 3 × 5 min, and mounted on glass slides with fluorescent mounting medium (Dako).
Confocal Microscopy
All non-FRET confocal images were acquired on a Nikon A1R laser scanning confocal microscope with GaAsp detectors using a Plan Apo λ 100x 1.45 NA oil immersion objective (Nikon) using NIS-Elements (Nikon). Live cells were imaged in a temperature-controlled chamber (37 °C) at 5% CO2 at 1 frame every 2–3 sec. Dual-color videos were acquired as consecutive green–red images, and tricolor videos were acquired as consecutive green–red–blue images.
Electron Microscopy
For electron microscopy (EM), cells were grown on coverslips and fixed in a mixture of 2.5% glutaraldehyde and 2% paraformaldehyde in 0.1M cacodylate buffer for 2–24 h at 4 °C. After post-fixation in 1% osmium tetroxide and 3% uranyl acetate, cells were dehydrated in series of ethanol, embedded in Epon resin and polymerized for 48 h at 60 °C. Ultrathin sections were made using UCT ultramicrotome (Leica Microsystems) and contrasted with 4% uranyl acetate and Reynolds’s lead citrate. Samples were imaged using a FEI Tecnai Spirit G2 transmission electron microscope (FEI Company, Hillsboro, OR) operated at 80 kV. Images were captured with an Eagle 4k HR 200kV CCD camera. For correlative light electron microscopy, cells were grown on gridded glass bottom culture dishes (MatTek; P35G-1.5-14-CGRD) and incubated for 45 min with LysoTracker Red (2 μM) (Thermo Fisher) prior to EM fixation. Fixed cells were imaged on the Nikon A1R laser scanning confocal microscope for LysoTracker staining using z-stacks with step sizes of 0.2 μm as described above, and subsequently processed and imaged for EM as described above.
Structured illumination microscopy
Structured illumination microscopy (SIM) super-resolution images were taken on a Nikon N-SIM system with an oil immersion objective lens 100×, 1.49 NA, Nikon. Images were captured using Nikon NIS Elements and reconstructed using slice reconstruction in NIS elements. Images for live cell imaging (live N-SIM) were taken at a single z-plane, while images of fixed cells for 3D N-SIM were taken using z-stacks with step sizes of 0.2 μm. Cells used for live cell imaging were maintained in a temperature-controlled chamber (37 °C) at 5% CO2 in a TokaiHit stagetop incubator.
FRET pair generation, imaging and analysis
The outer mitochondrial membrane (TOM20-Venus) and lysosomal membrane (Lamp1-mTurquoise2) FRET pair was generated using mVenus C1 (Addgene #27794) and pmTurquoise2-N1 (Addgene #60561). mRuby3 and Q67L Rab7a-mRuby3 were generated using mRuby3 obtained from pKanCMV-mClover3-mRuby3 (Addgene #74252). For FRET experiments, HeLa cells were plated on 35mm 4-chamber glass bottom dishes (Cellvis, Sunnyvale California) at a density of 40,000 cells/well. The following day, cells were transfected using Lipofectamine with FRET pairs (TOM20-Venus and Lamp1-mTurquoise2) along with either mRuby, WT Rab7a-mCherry or Q67L Rab7a-mRuby3. Images of live HeLa cells were acquired using a Nikon Spinning disk confocal microscope using 20x (for FRET intensity calculations) and 60x objectives (for representative time lapse images) at excitation wavelengths of 445 nm, 515 nm, and 561 nm for mTurquoise2, Venus, and mCherry/mRuby3 respectively, in a temperature-controlled chamber (37 °C) at 5% CO2 using NIS-Elements (Nikon). NIS-Elements (Nikon) was used for FRET analysis to calculate sensitized emission FRET (SE-FRET) and to unbiasedly generate Regions of Interest (ROI) by tracing individual cells in the red fluorescence view. A total of n = 200 cells were analyzed per condition for WT Rab7a and Q67L Rab7a and the FRET intensity was normalized to average SE-FRET values for WT Rab7a.
Image Analysis
Mitochondrial fission events were defined as those which showed clear division of a single mitochondria into two distinct daughter mitochondria which moved independently of one another after division. The expected probability that a Lamp1 vesicle would be at the site of a mitochondrial division event by random chance was calculated as the density of Lamp1 vesicles in the cytosol from n = 26 living cells, using ImageJ [National Institutes of Health (NIH)]. Mitochondria-lysosome contacts imaged in living cells were categorized as those which showed mitochondria and lysosomes in close proximity (<0.1 μm) for ≥10 sec in time-lapse images. All contacts analyzed for the minimum duration of contacts were those which had already formed at the beginning of the video. The minimum duration of contact in HeLa cells was quantified as the time before contact termination and dissociation (mitochondria and lysosomes detaching from one another) over a 5 min (300 sec) video. Any contacts which lasted throughout the entire 5 min video and which were still in contact by the end of the video were categorized as 300 sec in bar graphs, and as >5 min in histograms for the minimum duration of mitochondria-lysosome contacts. The percent of lysosomes in contacts were quantified as the percent of vesicles which formed contacts (defined above) with mitochondria divided by the total number of vesicles in the region of interest. The minimum duration of contact in HCT116 cells was quantified from videos of ≥100 s. Mitochondrial networks which did not contain overly elongated mitochondria (>10 μm length) or hyperfused/hypertethered mitochondria were classified as normal and scored per condition. The rate of mitochondrial fission was calculated per cell by quantifying the number of fission events in the entire cell from videos of ≥100 sec. The distance between membranes and the length of mitochondria-lysosome contact sites were measured from EM images using ImageJ (NIH). Line scans were generated using ImageJ (NIH) and normalized per protein.
Statistical analysis, Graphing and Figure assembly
Data were analyzed using unpaired two-tailed Student t test (for two datasets) or one-way ANOVA with Tukey’s post hoc test (for multiple data sets). Fisher’s exact test was used to compare the percentage of observed mitochondrial division events with mitochondria-lysosome contacts versus the percent expected by random chance. Data presented are means ± SEM (except in histograms). All statistical tests were justified as appropriate and were analyzed from n ≥ 9 cells (see text and figure legends for details) from N ≥ 3 independent experiments (biological replicates) per condition. Statistics and graphing were performed using Prism 7 (GraphPad) software. All videos and images were assembled using ImageJ 1.51j8 (NIH). All final figures were assembled in Illustrator (Adobe).
Data Availability
All data that support the findings of this study are included in the manuscript or are available from the authors upon reasonable request.
Extended Data
Extended Data Figure 1. Correlative light electron microscopy and 3D structured illumination microscopy of mitochondria-lysosome contacts.
a–c, Representative electron microscopy images of mitochondria (M) and lysosome (L) contacts (yellow arrows; <30 nm) in untreated HeLa cells (insets shown on right) (n = 55 examples from 20 cells). d,e, Representative correlative light electron microscopy and confocal images of HeLa cells (from n = 14 images from 6 cells) incubated with LysoTracker Red to label lysosomes/late endosomes (red arrows) which (d) contain electron-dense lumen with irregular content and/or multilamellar membrane sheets (see insets on right), while early endosomes lacking electron-dense lumen are LysoTracker-negative (blue arrows), and (e) form a stable membrane contact site with mitochondria (yellow arrows; see inset on right), while simultaneously forming contact sites with the ER (purple arrows). f, Representative structured illumination microscopy (N-SIM) images of mitochondria-lysosome contacts (yellow arrows) in fixed HeLa cells stained for endogenous Lamp1 (lysosomes) or TOM20 (mitochondria) and imaged in Z-stacks showing contacts extending >200nm in the Z-plane (n = 210 examples from 26 cells). Scale bars, 200nm, a–d; 100nm, a–d (insets on right), e (left, middle); 50 nm, e (right); 500nm, f.
Extended Data Figure 2. Characterizing mitochondria-lysosome contacts in living cells.
a–d, Representative images of mitochondria-lysosome contacts (>10 sec) in living HeLa cells expressing Lamp1-mGFP (lysosomes) and mApple-TOM20 (mitochondria) (n = 23 cells). (a) Examples of small Lamp1 vesicles (vesicle diameter <0.5 μm) contacting mitochondria. (b) Examples of larger Lamp1 vesicles (vesicle diameter >1 μm) contacting mitochondria. (c) Examples of a single Lamp1 vesicles contacting multiple mitochondria. (d) Examples of multiple Lamp1 vesicles contacting a single mitochondria. e, Representative images of contacts (yellow arrows) in fixed HeLa cells stained for endogenous Lamp1 (green) and TOM20 (red) (n = 341 examples from 25 cells). f,g, Representative images of living HeLa cells (n = 23 cells) expressing Lamp1-mGFP (lysosomes) and mApple-TOM20 (outer mitochondrial membrane) with corresponding linescan showing (f) a mitochondria-lysosome contact at close proximity, distinct from (g) lysosomal engulfment of mitochondrial TOM20. Scale bars, 0.5 μm, a–g.
Extended Data Figure 3. Structured illumination microscopy and FRET imaging of mitochondria-lysosome contacts in living cells.
a–c, Representative structured illumination microscopy (N-SIM) images of mitochondria-lysosome contacts (yellow arrows) in living HeLa cells (n = 43 examples from 10 cells) expressing Lamp1-mGFP (lysosomes) and mApple-TOM20 (mitochondria) and quantitation of duration of mitochondria-lysosome contacts from N-SIM time lapse images. d, Model of newly generated FRET pairs targeted to the outer mitochondrial membrane (TOM20-Venus) and the lysosomal membrane (Lamp1-mTurquoise2). e, Representative time lapse images of a living HeLa cell (n = 200 cells) expressing FRET pairs (TOM20-Venus, Lamp1-mTurquoise2) and Q67L Rab7a-mRuby3 demonstrating preferentially increased SE-FRET signal over 60 seconds at the interface between mitochondria and lysosomes (white arrows). f, Quantification of normalized SE-FRET intensity per cell in conditions expressing wild-type Rab7a or Q67L Rab7a (n = 200 cells per condition) showing ~2-fold increase from Q67L Rab7a. Data are means ± SEM. (***P<0.0001, unpaired two-tailed t test (f)). Scale bars, 4 μm, a; 1 μm, b,e.
Extended Data Figure 4. Mitochondria-lysosome contacts are distinct from MDVs and mitophagy.
a–c, Representative images of living HeLa cells expressing Lamp1-RFP (lysosomal membrane), mito-BFP (mitochondrial matrix) and SMAC-EGFP (mitochondrial intermembrane space) and corresponding linescans showing mitochondrial intermembrane space and matrix proteins do not undergo bulk transfer into lysosomes at contacts (yellow arrows) (n = 57 events from 12 cells). d, e, Representative images in a living HeLa cell expressing mApple-TOM20 (mitochondrial outer membrane), mito-BFP (mitochondrial matrix) and Lamp1-mGFP (lysosomes) and linescan (corresponding to top panel in d) showing mitochondria that form contacts with lysosomes (yellow arrows) are positive for mitochondrial matrix protein mito-BFP (not TOM20-positive MDVs) (n = 104 events from 23 cells). f, Representative linescan in a living HeLa cell expressing mEmerald-TOM20 (mitochondrial outer membrane), DsRed2-Mito (mitochondrial matrix) and mBFP2-Lys (lysosomes) showing mitochondria that form contacts with lysosomes (yellow arrows) are positive for mitochondrial matrix protein DsRed2-mito (not TOM20-positive MDVs) (n = 94 events from 16 cells). g–i, Representative images in a living HeLa cell expressing mApple-TOM20 (outer mitochondrial membrane), Lamp1-mGFP (lysosomal membrane) and fluid-phase marker dextran blue pulse-chased into the lysosomal lumen, and corresponding linescans showing lysosomal luminal content (blue) do not undergo bulk transfer into mitochondria at contacts (yellow arrows) (n = 66 events from 18 cells). j, Representative images in a living HeLa cell expressing Lamp1-RFP (lysosomes), mito-BFP (mitochondrial matrix) and EGFP-LC3 (autophagosome) showing mitochondria that form contacts with lysosomes (yellow arrows) are not engulfed by autophagosomes (not undergoing mitophagy) (n = 142 events from 17 cells). k, Autophagosome biogenesis proteins (ULK1-GFP, mCherry-Atg5, mEmerald-Atg12, GFP-DFCP1 and EGFP-LC3) do not mark sites of mitochondria-lysosome contacts in living cells (number of events analyzed n = 14 cells (ULK1), n = 17 cells (Atg5, Atg12, LC3) or n = 13 cells (DFCP1), top; quantification, bottom). Mitochondria (M) and lysosomes (L) are indicated in linescans. Data are means ± SEM. Scale bars, 0.5 μm, a; 1 μm, d,g,j.
Extended Data Figure 5. Fis1 recruits TBC1D15 to mitochondria.
a–e, Representative images and quantitation of HA-TBC1D15 immunofluorescent localization to mitochondria (stained with endogenous TOM20) in fixed HeLa cells showing that mitochondrial localization is not disrupted by TBC1D15 GAP mutants (D397A or R400K) but by mutating its Fis1 binding site (Δ231-240) (n = 293 cells, WT; n = 228 cells, D397A; n = 181 cells, R400K; n = 379 cells, Δ231-240) (Δ231-240 versus WT (*P = 0.0178), D397A (*P = 0.0131), and R400K (*P = 0.0112), ANOVA with Tukey’s post-hoc test). f, Quantification showing that YFP-TBC1D15 localization to mitochondria is dramatically decreased by the Flag-Fis1 (LA) mutant (unable to bind TBC1D15) as compared to wild-type Flag-Fis1 (n = 290 cells, Fis1; n = 281 cells, Fis1 (LA)) (***P<0.0001, unpaired two-tailed t test). g, Examples of HA-TBC1D15 GAP mutants (D397A and R400K) or Fis1-binding mutant (Δ231-240) inducing enlarged lysosomes (white arrows) (Lamp1-mGFP) not observed in HA-TBC1D15 wild-type-expressing cells (n = 293 cells, WT; n = 228 cells, D397A; n = 181 cells, R400K; n = 379 cells, Δ231-240). Data are means ± SEM. Scale bars, 10 μm, a–d,g; 1 μm, a–d (insets).
Extended Data Figure 6. Recruitment of TBC1D15 by Fis1 to mitochondria promotes mitochondria-lysosome contact untethering.
a,b, Representative time-lapse images of stable mitochondria-lysosome contacts (yellow arrows) for >120 sec before untethering (white arrow) in living HeLa cells expressing mApple-TOM20 (mitochondria), Lamp1-mGFP (lysosome) and Rab7-GAP mutant TBC1D15 D397A (n = 38 events from 10 cells). c, TBC domain mutants TBC1D15 D397A and R400K lacking GAP activity do not alter the percentage of lysosomes in contacts (n = 12 cells per condition), as compared to wild-type TBC1D15 (N.S. not significant). d,e, TBC1D15−/− HCT116 cells have increased duration (d, n = 18 events from 6 cells; WT; n = 16 events from 7 cells, TBC1D15−/−) but no change in the number of mitochondria–lysosome contacts (e, n = 15 cells, WT; n = 14 cells, TBC1D15−/−) compared to wild-type HCT116 cells (*P < 0.0491, N.S. not significant). f, Expression of the Flag–FIS1(LA) mutant (unable to bind TBC1D15) increases the percentage of lysosomes in mitochondria–lysosome contacts compared to wild-type FIS1 in living HeLa cells (n = (n = 18 cells, FIS1; n = 16 cells, FIS1(LA); *P < 0.0117). g,h Fis1 −/− HCT116 cells have increased duration (n = 15 events from 5 cells; WT; n = 14 events from 6 cells, Fis1 −/−) and number of mitochondria-lysosome contacts compared to wild-type HCT116 cells (n = 15 cells, WT; n = 13 cells, Fis1 −/−) (*P < 0.0442, ***P<0.0001). i,j, HA-TBC1D15 (n = 293 cells) and Flag-Fis1 (n = 272 cells) localization to mitochondria in fixed HeLa cells does not only occur at mitochondria-lysosome contacts. Data are means ± SEM. ANOVA with Tukey’s post-hoc test (c), unpaired two-tailed t test (d–h)). Scale bars, 0.5 μm, a; 1 μm, b, i–j (insets); 10 μm, i,j.
Extended Data Figure 7. Mitochondrial fission sites are marked by mitochondria-lysosome contacts in multiple cell types.
a,b, Representative time-lapse images of lysosomes contacting mitochondria at site of mitochondrial fission (yellow arrow; top panel) prior to mitochondrial fission (white arrows; middle panels) in living HeLa cells expressing mGFP-Lamp1 (lysosomes) and mApple-TOM20 (mitochondria) with corresponding linescans showing lysosomes at the site of fission (yellow arrow; linescan) after mitochondrial division into two daughter mitochondria (grey arrows; linescan) (n = 62 events from 23 cells). c, EM image of mitochondria (M) in contact (<30 nm) with a lysosome (L; yellow arrows) at site of mitochondrial constriction in untreated HeLa cells (from n = 20 cells imaged). d–g, Lysosomes (yellow arrows; mGFP-Lamp1) mark sites of mitochondrial fission (white arrows; mApple-TOM20) at similar rates in living H4 neuroglioma, HEK293 and HCT116 cells as in HeLa cells by time-lapse confocal imaging (n = 49 events from 10 cells, HeLa; n = 36 events from 13 cells, H4; n = 18 events from 9 cells, HEK293; n = 9 events from 6 cells, HCT116). Data are means ± SEM. (N.S. not significant, ANOVA with Tukey’s post-hoc test). Scale bars, 1 μm, a,b, e–g (inset); 200 nm, c; 2.5 um, e–g.
Extended Data Figure 8. Mitochondria-lysosome contacts mark sites of mitochondrial fission upon induction of mitochondrial fragmentation.
a–d, Lysosomes (yellow arrows; mGFP-Lamp1) mark sites of mitochondrial fission (white arrows; mApple-TOM20) at similar rates in untreated living HeLa cells as when treated with 0–20 min of Actinomycin D (a), STS (b) or CCCP (c) (n ≥ 49 events from ≥ 10 cells, Control; n = 29 events from 14 cells, Actinomycin D; n = 36 events from 10 cells, STS; n = 49 events from 14 cells, CCCP). Data are means ± SEM. (N.S. not significant, ANOVA with Tukey’s post-hoc test). Scale bars, 5 μm, a–c;.1 um, a–c (inset).
Extended Data Figure 9. Mitochondrial fission sites marked by lysosomes are positive for DRP1 and endoplasmic reticulum tubules.
a, Representative time-lapse image of lysosome contacting mitochondria at site of mitochondrial division (yellow arrow) prior to fission event (white arrows) in living HeLa cell expressing mEmerald-TOM20 (mitochondria), mBFP2-Lys (lysosomes) and mCherry-Drp1 showing Drp1 oligomerization at site of mitochondrial division (n = 41 events from 11 cells). b,c, Representative time-lapse image (inset in c) of lysosome contacting mitochondria at site of mitochondrial division (yellow arrow) prior to fission event (white arrows) in living HeLa cell expressing mEmerald-TOM20 (mitochondria), mBFP2-lys (lysosomes) and mCherry-ER (ER) showing ER tubule at site of mitochondrial division (n =84 events from 19 cells). Scale bars, 1 μm, a,c; 5 μm, b.
Extended Data Figure 10. Regulation of mitochondrial network dynamics by Rab7 GTP hydrolysis.
a, Examples of mitochondria not undergoing fission for >120 sec in living HeLa cells expressing mApple-TOM20 (mitochondria) and Rab7Q67L-GFP (n = 13 cells). b,c, Examples of mitochondria undergoing fission (white arrows) after 36 sec in living HeLa cells expressing mApple-TOM20 (mitochondria) and wild-type Rab7-GAP TBC1D15 (n = 13 cells). d,e, Examples of mitochondria not undergoing fission for >240 sec in living HeLa cells expressing mApple-TOM20 (mitochondria) and Rab7-GAP mutants TBC1D15 D397A (d) or TBC1D15 R400K (e) (n = 13 cells per condition). f–i, The percentage of mitochondrial fission sites marked by lysosomes (mGFP-Lamp1) or ER (mCherry-ER) is not disrupted by the Rab7Q67L GTP-hydrolysis deficient mutant (n = 12 events from 15 cells) or by TBC1D15 GAP mutants (D397A or R400K) (n = 22 events from 10 cells, WT; n = 17 events from 19 cells, D397A; n = 27 events from 22 cells, R400K). j–l, Examples of Rab7Q67L and HA-TBC1D15 GAP mutants (D397A and R400K) inducing elongated mitochondria (yellow arrows; >10μm length) compared to control cells, and quantification of Rab7Q67L (*P = 0.0321) and HA-TBC1D15 GAP mutants (D397A and R400K) (*P = 0.0297, **P = 0.0051) leading to decreased percentages of cells with normal mitochondrial networks (no elongated mitochondria > 10μm length or hyperfused/tethered networks) (n = 47 cells, Rab7; n = 72 cells, Rab7Q67L; n = 88 cells, TBC1D15 WT; n = 168 cells, TBC1D15 D397A; n = 132 cells, TBC1D15 R400K). Data are means ± SEM. (N.S. not significant, ANOVA with Tukey’s post-hoc test (h,i,l), unpaired two-tailed t test (f,g,k)). Scale bars, 0.5 μm, a, 1 μm, b–e, 10 μm, j.
Supplementary Material
Acknowledgments
We thank Katarina Trajkovic and all members of the Krainc lab for helpful advice, Farida Korobova for electron microscopy assistance and Joshua Z. Rappoport and David Kirchenbuechler for N-SIM assistance. All imaging work was performed at the Northwestern University Center for Advanced Microscopy generously supported by NCI CCSG P30 CA060553 awarded to the Robert H Lurie Comprehensive Cancer Center. Structured illumination microscopy was performed on a Nikon N-SIM system, purchased through the support of NIH 1S10OD016342-01. The spinning disk confocal system was acquired through a NCRR shared instrumentation grant awarded to Vladimir Gelfand (S10 RR031680-01). TBC1D15 and Fis1 constructs were generous gifts from Naotada Ishihara (Kurume University, Japan). HCT116 cells were generous gifts from Richard Youle (NIH, USA). This work was supported by NIH/NINDS grants to Y.C.W. (T32 NS041234 and F32 NS101778) and D.K. (R01 NS076054).
Footnotes
Author Contributions
Y.C.W. and D.K. designed the overall study, analyzed data and wrote the manuscript. Y.C.W. performed cell culture, electron microscopy and correlative light electron microscopy, structured illumination microscopy, confocal live cell imaging and immunofluorescence. D.Y. designed, performed and analyzed FRET experiments.
The authors declare no competing financial interests.
References
- 1.Hutagalung AH, Novick PJ. Role of Rab GTPases in membrane traffic and cell physiology. Physiological reviews. 2011;91:119–149. doi: 10.1152/physrev.00059.2009. [DOI] [PMC free article] [PubMed] [Google Scholar]
- 2.Burte F, Carelli V, Chinnery PF, Yu-Wai-Man P. Disturbed mitochondrial dynamics and neurodegenerative disorders. Nature reviews. Neurology. 2015;11:11–24. doi: 10.1038/nrneurol.2014.228. [DOI] [PubMed] [Google Scholar]
- 3.Mc Donald JM, Krainc D. Lysosomal Proteins as a Therapeutic Target in Neurodegeneration. Annu Rev Med. 2017;68:445–458. doi: 10.1146/annurev-med-050715-104432. [DOI] [PubMed] [Google Scholar]
- 4.Plotegher N, Duchen MR. Mitochondrial Dysfunction and Neurodegeneration in Lysosomal Storage Disorders. Trends in molecular medicine. 2017;23:116–134. doi: 10.1016/j.molmed.2016.12.003. [DOI] [PubMed] [Google Scholar]
- 5.Mishra P, Chan DC. Metabolic regulation of mitochondrial dynamics. The Journal of cell biology. 2016;212:379–387. doi: 10.1083/jcb.201511036. [DOI] [PMC free article] [PubMed] [Google Scholar]
- 6.Pickrell AM, Youle RJ. The roles of PINK1, parkin, and mitochondrial fidelity in Parkinson’s disease. Neuron. 2015;85:257–273. doi: 10.1016/j.neuron.2014.12.007. [DOI] [PMC free article] [PubMed] [Google Scholar]
- 7.Sugiura A, McLelland GL, Fon EA, McBride HM. A new pathway for mitochondrial quality control: mitochondrial-derived vesicles. The EMBO journal. 2014;33:2142–2156. doi: 10.15252/embj.201488104. [DOI] [PMC free article] [PubMed] [Google Scholar]
- 8.Lewis SC, Uchiyama LF, Nunnari J. ER-mitochondria contacts couple mtDNA synthesis with mitochondrial division in human cells. Science. 2016;353:aaf5549. doi: 10.1126/science.aaf5549. [DOI] [PMC free article] [PubMed] [Google Scholar]
- 9.Smirnova E, Griparic L, Shurland DL, van der Bliek AM. Dynamin-related protein Drp1 is required for mitochondrial division in mammalian cells. Molecular biology of the cell. 2001;12:2245–2256. doi: 10.1091/mbc.12.8.2245. [DOI] [PMC free article] [PubMed] [Google Scholar]
- 10.Friedman JR, et al. ER tubules mark sites of mitochondrial division. Science. 2011;334:358–362. doi: 10.1126/science.1207385. [DOI] [PMC free article] [PubMed] [Google Scholar]
- 11.Korobova F, Ramabhadran V, Higgs HN. An actin-dependent step in mitochondrial fission mediated by the ER-associated formin INF2. Science. 2013;339:464–467. doi: 10.1126/science.1228360. [DOI] [PMC free article] [PubMed] [Google Scholar]
- 12.Ji WK, Hatch AL, Merrill RA, Strack S, Higgs HN. Actin filaments target the oligomeric maturation of the dynamin GTPase Drp1 to mitochondrial fission sites. eLife. 2015;4:e11553. doi: 10.7554/eLife.11553. [DOI] [PMC free article] [PubMed] [Google Scholar]
- 13.Li S, et al. Transient assembly of F-actin on the outer mitochondrial membrane contributes to mitochondrial fission. The Journal of cell biology. 2015;208:109–123. doi: 10.1083/jcb.201404050. [DOI] [PMC free article] [PubMed] [Google Scholar]
- 14.Manor U, et al. A mitochondria-anchored isoform of the actin-nucleating spire protein regulates mitochondrial division. eLife. 2015;4 doi: 10.7554/eLife.08828. [DOI] [PMC free article] [PubMed] [Google Scholar]
- 15.Moore AS, Wong YC, Simpson CL, Holzbaur EL. Dynamic actin cycling through mitochondrial subpopulations locally regulates the fission-fusion balance within mitochondrial networks. Nature communications. 2016;7:12886. doi: 10.1038/ncomms12886. [DOI] [PMC free article] [PubMed] [Google Scholar]
- 16.Lee JE, Westrate LM, Wu H, Page C, Voeltz GK. Multiple dynamin family members collaborate to drive mitochondrial division. Nature. 2016;540:139–143. doi: 10.1038/nature20555. [DOI] [PMC free article] [PubMed] [Google Scholar]
- 17.Zhen Y, Stenmark H. Cellular functions of Rab GTPases at a glance. J Cell Sci. 2015;128:3171–3176. doi: 10.1242/jcs.166074. [DOI] [PubMed] [Google Scholar]
- 18.Daniele T, et al. Mitochondria and melanosomes establish physical contacts modulated by Mfn2 and involved in organelle biogenesis. Current biology : CB. 2014;24:393–403. doi: 10.1016/j.cub.2014.01.007. [DOI] [PubMed] [Google Scholar]
- 19.Elbaz-Alon Y, et al. A dynamic interface between vacuoles and mitochondria in yeast. Developmental cell. 2014;30:95–102. doi: 10.1016/j.devcel.2014.06.007. [DOI] [PubMed] [Google Scholar]
- 20.Honscher C, et al. Cellular metabolism regulates contact sites between vacuoles and mitochondria. Developmental cell. 2014;30:86–94. doi: 10.1016/j.devcel.2014.06.006. [DOI] [PubMed] [Google Scholar]
- 21.Csordas G, et al. Structural and functional features and significance of the physical linkage between ER and mitochondria. The Journal of cell biology. 2006;174:915–921. doi: 10.1083/jcb.200604016. [DOI] [PMC free article] [PubMed] [Google Scholar]
- 22.Phillips MJ, Voeltz GK. Structure and function of ER membrane contact sites with other organelles. Nature reviews. Molecular cell biology. 2016;17:69–82. doi: 10.1038/nrm.2015.8. [DOI] [PMC free article] [PubMed] [Google Scholar]
- 23.Soubannier V, et al. A vesicular transport pathway shuttles cargo from mitochondria to lysosomes. Current biology : CB. 2012;22:135–141. doi: 10.1016/j.cub.2011.11.057. [DOI] [PubMed] [Google Scholar]
- 24.Yamano K, Fogel AI, Wang C, van der Bliek AM, Youle RJ. Mitochondrial Rab GAPs govern autophagosome biogenesis during mitophagy. Elife. 2014;3:e01612. doi: 10.7554/eLife.01612. [DOI] [PMC free article] [PubMed] [Google Scholar]
- 25.Onoue K, et al. Fis1 acts as a mitochondrial recruitment factor for TBC1D15 that is involved in regulation of mitochondrial morphology. J Cell Sci. 2013;126:176–185. doi: 10.1242/jcs.111211. [DOI] [PubMed] [Google Scholar]
- 26.Peralta ER, Martin BC, Edinger AL. Differential effects of TBC1D15 and mammalian Vps39 on Rab7 activation state, lysosomal morphology, and growth factor dependence. J Biol Chem. 2010;285:16814–16821. doi: 10.1074/jbc.M110.111633. [DOI] [PMC free article] [PubMed] [Google Scholar]
- 27.Zhang XM, Walsh B, Mitchell CA, Rowe T. TBC domain family, member 15 is a novel mammalian Rab GTPase-activating protein with substrate preference for Rab7. Biochem Biophys Res Commun. 2005;335:154–161. doi: 10.1016/j.bbrc.2005.07.070. [DOI] [PubMed] [Google Scholar]
- 28.Cai H, et al. TRAPPI tethers COPII vesicles by binding the coat subunit Sec23. Nature. 2007;445:941–944. doi: 10.1038/nature05527. [DOI] [PubMed] [Google Scholar]
- 29.Eisenberg-Bord M, Shai N, Schuldiner M, Bohnert M. A Tether Is a Tether Is a Tether: Tethering at Membrane Contact Sites. Developmental cell. 2016;39:395–409. doi: 10.1016/j.devcel.2016.10.022. [DOI] [PubMed] [Google Scholar]
- 30.Burbulla LF, et al. Dopamine oxidation mediates mitochondrial and lysosomal dysfunction in Parkinson’s disease. Science. 2017;357:1255–1261. doi: 10.1126/science.aam9080. [DOI] [PMC free article] [PubMed] [Google Scholar]
- 31.Falcon-Perez JM, Nazarian R, Sabatti C, Dell’Angelica EC. Distribution and dynamics of Lamp1-containing endocytic organelles in fibroblasts deficient in BLOC-3. Journal of cell science. 2005;118:5243–5255. doi: 10.1242/jcs.02633. [DOI] [PubMed] [Google Scholar]
- 32.Sherer NM, et al. Visualization of retroviral replication in living cells reveals budding into multivesicular bodies. Traffic. 2003;4:785–801. doi: 10.1034/j.1600-0854.2003.00135.x. [DOI] [PubMed] [Google Scholar]
- 33.Rowland AA, Chitwood PJ, Phillips MJ, Voeltz GK. ER contact sites define the position and timing of endosome fission. Cell. 2014;159:1027–1041. doi: 10.1016/j.cell.2014.10.023. [DOI] [PMC free article] [PubMed] [Google Scholar]
- 34.Jackson WT, et al. Subversion of cellular autophagosomal machinery by RNA viruses. PLoS biology. 2005;3:e156. doi: 10.1371/journal.pbio.0030156. [DOI] [PMC free article] [PubMed] [Google Scholar]
- 35.Itakura E, Mizushima N. Characterization of autophagosome formation site by a hierarchical analysis of mammalian Atg proteins. Autophagy. 2010;6:764–776. doi: 10.4161/auto.6.6.12709. [DOI] [PMC free article] [PubMed] [Google Scholar]
- 36.Koushik SV, Chen H, Thaler C, Puhl HL, 3rd, Vogel SS. Cerulean, Venus, and VenusY67C FRET reference standards. Biophys J. 2006;91:L99–L101. doi: 10.1529/biophysj.106.096206. [DOI] [PMC free article] [PubMed] [Google Scholar]
- 37.Bajar BT, et al. Improving brightness and photostability of green and red fluorescent proteins for live cell imaging and FRET reporting. Sci Rep. 2016;6:20889. doi: 10.1038/srep20889. [DOI] [PMC free article] [PubMed] [Google Scholar]
- 38.Sun Q, Westphal W, Wong KN, Tan I, Zhong Q. Rubicon controls endosome maturation as a Rab7 effector. Proceedings of the National Academy of Sciences of the United States of America. 2010;107:19338–19343. doi: 10.1073/pnas.1010554107. [DOI] [PMC free article] [PubMed] [Google Scholar]
- 39.Subach OM, Cranfill PJ, Davidson MW, Verkhusha VV. An enhanced monomeric blue fluorescent protein with the high chemical stability of the chromophore. PloS one. 2011;6:e28674. doi: 10.1371/journal.pone.0028674. [DOI] [PMC free article] [PubMed] [Google Scholar]
- 40.Lawe DC, Patki V, Heller-Harrison R, Lambright D, Corvera S. The FYVE domain of early endosome antigen 1 is required for both phosphatidylinositol 3-phosphate and Rab5 binding. Critical role of this dual interaction for endosomal localization. J. Biol. Chem. 2000;275:3699–3705. doi: 10.1074/jbc.275.5.3699. [DOI] [PubMed] [Google Scholar]
- 41.Jofuku A, Ishihara N, Mihara K. Analysis of functional domains of rat mitochondrial Fis1, the mitochondrial fission-stimulating protein. Biochemical and biophysical research communications. 2005;333:650–659. doi: 10.1016/j.bbrc.2005.05.154. [DOI] [PubMed] [Google Scholar]
- 42.Mandell MA, et al. TRIM proteins regulate autophagy and can target autophagic substrates by direct recognition. Developmental cell. 2014;30:394–409. doi: 10.1016/j.devcel.2014.06.013. [DOI] [PMC free article] [PubMed] [Google Scholar]
- 43.Mazzulli JR, et al. Gaucher disease glucocerebrosidase and alpha-synuclein form a bidirectional pathogenic loop in synucleinopathies. Cell. 2011;146:37–52. doi: 10.1016/j.cell.2011.06.001. [DOI] [PMC free article] [PubMed] [Google Scholar]
Associated Data
This section collects any data citations, data availability statements, or supplementary materials included in this article.
Supplementary Materials
Data Availability Statement
All data that support the findings of this study are included in the manuscript or are available from the authors upon reasonable request.


