Abstract
Objective:
To compare image quality of two adaptive statistical iterative reconstruction (ASiR and ASiR-V) algorithms using objective and subjective metrics for routine liver CT, with the conventional filtered back projection (FBP) reconstructions as reference standards.
Methods:
This institutional review board-approved study included 52 patients with clinically suspected hepatic metastases. Patients were divided equally into ASiR and ASiR-V groups with same scan parameters. Images were reconstructed with ASiR and ASiR-V from 0 (FBP) to 100% blending percentages at 10% interval in its respective group. Mean and standard deviation of CT numbers for liver parenchyma were recorded. Two experienced radiologists reviewed all images for image quality blindly and independently. Data were statistically analyzed.
Results:
There was no difference in CT dose index between ASiR and ASiR-V groups. As the percentage of ASiR and ASiR-V increased from 10 to 100% , image noise reduced by 8.6 –57.9% and 8.9–81.6%, respectively, compared with FBP. There was substantial interobserver agreement in image quality assessment for ASiR and ASiR-V images. Compared with FBP reconstruction, subjective image quality scores of ASiR and ASiR-V improved significantly as percentage increased from 10 to 80% for ASiR (peaked at 50% with 32.2% noise reduction) and from 10 to 90% (peaked at 60% with 51.5% noise reduction) for ASiR-V.
Conclusion:
Both ASiR and ASiR-V improved the objective and subjective image quality for routine liver CT compared with FBP. ASiR-V provided further image quality improvement with higher acceptable percentage than ASiR, and ASiR-V60% had the highest image quality score.
Advances in knowledge:
(1) Both ASiR and ASiR-V significantly reduce image noise compared with conventional FBP reconstruction. (2) ASiR-V with 60 blending percentage provides the highest image quality score in routine liver CT.
Introduction
The recent extensive clinical use of CT has led to substantial concerns about patient exposure to radiation.1, 2 There are several strategies for reducing the radiation dose, such as tube current modulation, automatic exposure control, and automated kilovolt selection.3 However, dose reduction has been limited when using traditional filtered back projection (FBP) reconstruction as it introduces the noise. To overcome this limitation, several types of CT iterative reconstruction (IR) algorithms have been proposed to be used in CT since 2009, including iterative reconstruction in image space (IRIS, Siemens Medical Solutions, Forchheim, Germany),4 adaptive iterative dose reduction (AIDA, Toshiba Medical System, Tochigi, Japan),5 adaptive statistical iterative reconstruction (ASiR, GE Healthcare, Milwaukee, USA),6, 7 sonogram-affirmed iterative reconstruction (SAFIRE, Siemens Medical Solutions, Forchheim, Germany),8 iDOSE (Philips Healthcare, Amsterdam, Netherlands)9 and full model-based iterative reconstruction (MBIR, GE Healthcare, Milwaukee, USA) algorithms.10
Although FBP has the fastest image reconstruction time, it is vulnerable to noise generation and artifacts because of the innate properties of the CT projection data, especially in the low-dose situation.11 ASiR is a hybrid IR algorithm that yields blended images between FBP and IR with IR percentages from 0 to 100%, in which the percentage represents a contribution of the ASiR to the final images. ASiR is reported to allow for a dose reduction of 25–40% without degrading image quality at abdominal multidetector CT by modelling the noise in every scanned projection and assuming the noise differences between neighboring projections during the reconstruction process.12 However, several shortcomings of ASiR have been reported, such as IR specific artifacts that manifest as a waxy texture in the images (blotchy, pixilated image texture and irregular edges) when reconstructed with high strength of ASiR.13 The MBIR algorithm uses a more complex system of prediction models10; It offers considerably better image quality than FBP and ASiR even at low dose.14 However, it has not been widely applied in routine clinical practice due to its long reconstruction time.
Recently, a new generation of adaptive statistical iterative reconstruction (ASiR-V) was developed. This technique has a physical model (models the interaction between polychromatic X-ray and the attenuating object) in the IR process to improve the robustness of noise reduction and image presentation. It differs from the full MBIR algorithm in that it excludes the system optics in the modelling process, and focuses primarily on modelling the system noise statistics, objects, and physics, which are the main contributors to the reduction of noise and artifacts.15 By omitting the most time-consuming component, the system optics, ASiR-V significantly improves image quality while enabling a reconstruction speed like that of ASiR. The initial phantom studies with image noise, contrast-to-noise ratio (CNR), and spatial resolution measurements revealed promising results for ASiR-V,15 but to our knowledge, the evaluation with clinical routine liver CT studies has not been reported.
The purpose of this study was to compare image quality of FBP, ASiR and ASiR-V algorithms using objective and subjective metrics from routine multidetector liver CT scans, and to determine the IR percentages for the two IR algorithms to achieve the highest objective image quality scores.
Methods and Materials
This study was approved by local institutional review board. Informed written consent was obtained from all the patients.
Patient information and study design
52 patients (28 male and 24 female) with clinically suspected hepatic metastases who underwent standard-of-care multidetector CT were included in this study. Patients were divided equally into ASiR group (scanned on a GE HD750 CT) and ASiR-V group (scanned on a GE Revolution CT). The age, weight, and body mass index (BMI) (mean ± standard deviation) were (53.5 ± 12.6 years, 65.1 ± 15.3 kg and 23.4 ± 4.2 kg m−2) and (49.8 ± 13.7 years, 67.6 ± 14.5 kg and 24.8 ± 3.7 kg m−2) for the ASiR and ASiR-V groups, respectively (Table 1).
Table 1.
Comparisons of patient demographics and CT radiation dose between ASiR and ASiR-V
| ASiR | ASiR-V | p-value | |
| Gender (male/female) | 26 (15/11) | 26 (13/13) | 0.57 |
| Age (years)a | 53.5 ± 12.6 | 49.8 ± 13.7 | 0.33 |
| Weight (kg)a | 65.1 ± 15.3 | 67.6 ± 14.5 | 0.72 |
| BMI (kg m-2)a | 23.4 ± 4.2 | 24.8 ± 3.7 | 0.79 |
| CTDIvol (mGy)a | 7.59 ± 1.45 | 7.48 ± 1.37 | 0.68 |
| DLP (mGy*cm)a | 209.57 ± 41.34 | 201.82 ± 37.49 | 0.53 |
| Effective dose (mSv)a | 3.15 ± 0.62 | 3.01 ± 0.56 | 0.18 |
ASR, adaptive statistical iterative reconstruction; BMI, body mass index; CTDIvol, volume CT dose index; DLP, dose–length product.
Data represented as mean ±standard derivation.
CT system parameters
Scan parameters were the same on both systems as follows: 120kVp tube voltage; an automatic tube current modulation used for obtaining Noise Index of 12 Hounsfield unit (HU) in images of 5 mm slice thickness; 0.625*64 mm detector collimation; 0.992:1 pitch; 0.5 s rotation time. These two scanners have similar low contrast detectability based on the product data sheets [CT dose index (CTDI) of 8.8 mGy with ASIR-V on Revolution CT vs CTDI of 9.0 mGy with ASIR on HD750CT for detecting object of 5 mm in diameter with 3 HU contrast difference on 5 mm slice thickness images]. For further confirmation, a commercially available phantom (Catphan 500, module CTP486; The Phantom Laboratory, NY) was scanned on both CT systems with same tube voltage (120 kVp) and CTDI value (9.00 mGy). Images for the phantom scans were reconstructed at 5 mm slice thickness with the filtered back projection (0% ASIR and 0% ASIR-V) to evaluate the baseline noise performance of the two CT systems. For the patient study, the CTDIvol values from the two systems were recorded after each scan. All patients were instructed to hold his/her breath at the end of inspiration, and scanned with both hands up beyond their heads. Scanning coverage was from the top to the bottom of the liver for each patient.
Image reconstruction
Raw data in the ASiR group and ASiR-V group were reconstructed into axial images at 5 mm slice thickness using ASiR and ASiR-V algorithms, respectively with percentages from 10 to 100% at 10% interval. The conventional FBP images of both patients and phantom (at 0%) were also generated. All reconstructions used the standard kernel.
Analysis of image quality
Images were evaluated on the same workstation (Advantage workstation 4.6, GE healthcare), and displays were calibrated and all viewing conditions were held constantly according to the applicable recommendations (American Association of Physics in Medicine Task Group 18 report). All the data sets were randomized and rendered anonymously so that the readers were unaware of which scanning technique or reconstruction algorithm had been used. Data sets were displayed using the soft-tissue window setting (window/level, 400/40 HUs).
Evaluation of objective image quality
Mean of CT numbers and their standard deviation, which reflects the image noise, was measured in an 80.0 ± 2.0 mm2 circular region of interest (ROI). The ROIs were placed on liver parenchyma at the level of the right portal vein, as illustrated in Figure 1. The signal-to-noise ratio (SNR) for the liver parenchyma was calculated as follows: SNR = CTL/SDl. CTL is the CT number of liver parenchyma, SDL is the standard deviation (SD) of the liver parenchyma. The noise reduction rate was also calculated as follows: noise reduction rate(IR) (%) = (SDFBP−SDIR)/SDFBP × 100 (IR indicates ASiR or ASiR-V). For the phantom study, ROIs were placed in the center and four peripheral areas to measure SD values of uniformity regions and measurements were averaged to generate the final value.
Figure 1.
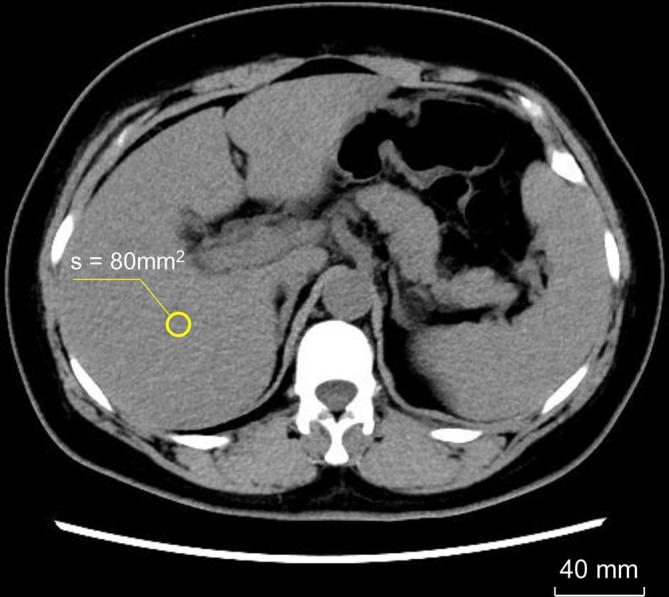
Illustration of the placement of ROI at the level of the right portal vein. ROI, region of interest.
Evaluation of subjective image quality
On side-by-side monitors in a one-to-one format, two experienced radiologists independently graded image noise, artifacts including streaking artifacts, blotchy, pixilated image texture and irregular edges, visual sharpness of liver boundary, conspicuity of the hepatic veins within liver, visualization of the extrahepatic duct and diagnostic acceptability, using a 5-point Likert scale: (1) image quality considered poor and non-evaluable because of high image noise, marked artifacts, distortion of spatial or contrast resolution, or poor edge definition; (2) image quality considered fair but significantly compromised by moderate image noise, some image artifacts, or some distortion of spatial resolution or contrast resolution; (3) image quality considered good and only minimally compromised by image noise, artifact, or minimal distortion of spatial resolution or contrast resolution; (4) image quality considered very good, displaying image noise typically encountered in our routine clinical practice, and not compromised by artifact or distortion of spatial resolution or contrast resolution; (5) image quality considered superior, with striking lack of image noise and absence of any artifact or distortion.
Radiation dose assessment
The volumetric CT dose index (CTDIvol) in milligray (mGy) and dose–length product (DLP) in mGy*cm were recorded from the dose page for each scan. Effective patient radiation dose in millisieverts (mSv) was estimated from the DLP for each protocol using a conversion factor of 0.015 mSv/(mGy*cm) for the abdomen.
Statistical analysis
Data were analyzed by using the statistical analysis software SPSS 20. Means and standard deviations for patient age, weight, BMI, and radiation dose were calculated. The noise and SNR values were first tested with the Levene test for homogeneity of distribution. Quantitative data were analyzed using the two-samples t-test. The interobserver agreement between the two radiologists for each of the assessed subjective image quality was estimated by using k-statistics. Subjective image quality scores were compared with Mann–Whitney U test. Significance was defined as a p-value less than 0.05.
Results
There was no significant difference in gender, age, weight, BMI values between the ASiR and ASiR-V groups. There was also no significant difference in CTDIvol, DLP and effective dose between the two groups, as shown in Table 1.
Objective image quality analysis
As the percentage of ASiR and ASiR-V increased from 0 (FBP) to 100%, image noise reduced from 25.6 to 10.7 HU with ASiR and from 26.1 to 4.8 HU with ASiR-V. There was significantly less noise of ASiR-V images as the percentages of IR increased to 40% or greater, compared to those of ASiR group with the same percentage (Figure 2). Compared with FBP, as the percentage of ASiR and ASiR-V increased from 10 to 100%, the image noise reduction rate increased from 8.6 to 57.9% and from 8.9 to 81.6%, respectively (Figure 3) and the SNR increased accordingly. There was significantly higher SNR value of ASiR-V images as the percentages of IR increased to 30% or greater, compared to those of ASiR group with the same percentage (Figure 4). The FBP images noise of the uniformity phantom on HD750 CT and Revolution CT systems was 5.59 and 5.60 HU respectively.
Figure 2.
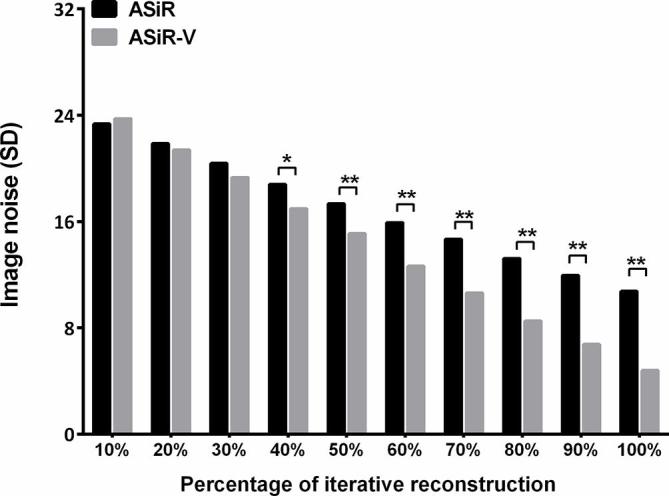
Relationships between the percentage of ASiR and the image noise. The noise started to show statistically significant difference between ASiR and ASiR-V images when the iterative reconstruction percentages were equal or greater than 40% (* indicates p < 0.05; ** indicates p < 0.01). ASiR, adaptive statistical iterative reconstruction.
Figure 3.
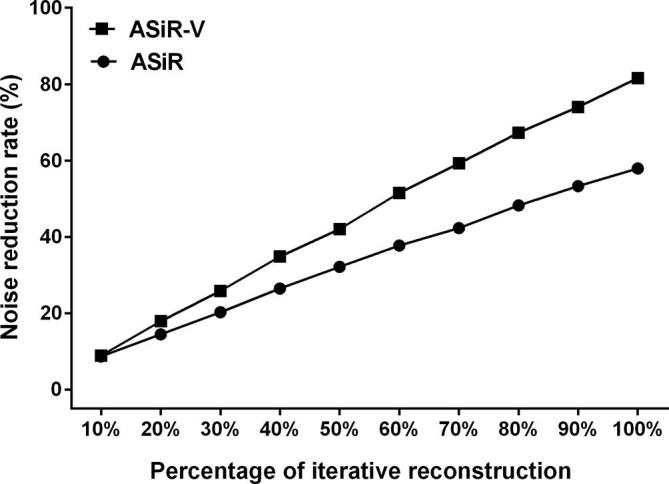
Relationships between the percentage of ASiR and the noise reduction rate. ASiR, adaptive statistical iterative reconstruction.
Figure 4.
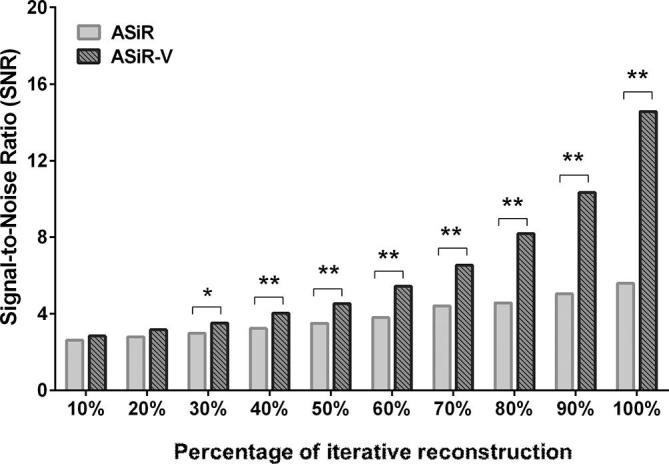
Relationships between the percentage of ASiR and the SNR. SNR started to show statistically significant difference between ASiR and ASiR-V images when the iterative reconstruction percentages were equal or greater than 30% (* indicates p < 0.05; ** indicates p < 0.01). ASiR, adaptive statistical iterative reconstruction; SNR, signal-to-noise ratio.
Subjective image quality analysis
For the subjective evaluation, a substantial interobserver agreement was obtained for the determination of image quality with ASiR and ASiR-V (κ > 0.82). Compared with FBP reconstruction, the subjective image quality scores of ASiR and ASiR-V images improved significantly as percentage increased from 10 to 80% for ASiR (subjective image quality score peaked at 50% with 32.2% noise reduction compared with FBP) and from 10 to 90% for ASiR-V (subjective image quality score peaked at 60% with 51.5% noise reduction compared with FBP), and declined afterwards due to waxy texture in the images. Subjective image score of ASiR100% and ASiR-V100% significantly decreased compared to the peak score of ASiR50% and ASiR-V60%, respectively (ASiR50% vs ASiR100%: p = 0.012; ASiR-V60% vs ASiR-V100%: p = 0.009) (Table 2 and Figure 5).
Table 2.
Relationship between the subjective score and percentage of adaptive statistical reconstruction
| Reconstruction | Score Distribution (1/2/3/4/5) | Mean(SD) | k-value | p-value | |
| Observer 1 | Observer 2 | ||||
| ASiR (0%, FBP) | 0/3/16/7/0 | 0/5/15/6/0 | 3.10(0.63) | 0.83 | <0.001 |
| ASiR-V (0%, FBP) | 0/3/14/9/0 | 0/3/15/8/0 | 3.21(0.64) | 0.93 | <0.001 |
| ASiR (10%) | 0/1/15/10/0 | 0/1/14/11/0 | 3.37(0.56) | 0.92 | <0.001 |
| ASiR-V (10%) | 0/0/14/11/1 | 0/0/15/11/0 | 3.46(0.54) | 0.85 | <0.001 |
| ASiR (20%) | 0/0/12/14/0 | 0/0/11/25/0 | 3.53(0.50) | 0.92 | <0.001 |
| ASiR-V (20%) | 0/0/6/16/4 | 0/0/7/15/4 | 3.90(0.63) | 0.93 | <0.001 |
| ASiR (30%) | 0/0/3/18/5 | 0/0/3/19/4 | 4.07(0.55) | 0.91 | <0.001 |
| ASiR-V (30%) | 0/0/2/14/10 | 0/0/1/15/10 | 4.32(0.58) | 0.93 | <0.001 |
| ASiR (40%) | 0/0/0/15/13 | 0/0/0/14/12 | 4.44(0.50) | 0.92 | <0.001 |
| ASiR -V (40%) | 0/0/1/7/18 | 0/0/0/9/17 | 4.65(0.52) | 0.83 | <0.001 |
| ASiR (50%) | 0/0/0/5/21 | 0/0/0/4/22 | 4.83(0.38) | 0.86 | <0.001 |
| ASiR -V (50%) | 0/0/0/3/23 | 0/0/0/4/22 | 4.86(0.34) | 0.84 | <0.001 |
| ASiR (60%) | 0/0/2/12/12 | 0/0/1/14/11 | 4.38(0.60) | 0.82 | <0.001 |
| ASiR-V (60%) | 0/0/0/2/24 | 0/0/0/1/25 | 4.94(0.24) | 0.85 | <0.001 |
| ASiR (70%) | 0/0/3/23/0 | 0/0/4/22/0 | 3.87(0.34) | 0.84 | <0.001 |
| ASiR-V (70%) | 0/0/0/18/8 | 0/0/0/17/9 | 4.34(0.48) | 0.91 | <0.001 |
| ASiR (80%) | 0/1/9/16/0 | 0/1/10/15/0 | 3.55(0.57) | 0.93 | <0.001 |
| ASiR-V (80%) | 0/0/6/16/4 | 0/0/6/16/4 | 3.92(0.62) | 0.92 | <0.001 |
| ASiR (90%) | 0/4/20/2/0 | 0/4/19/3/0 | 2.96(0.52) | 0.90 | <0.001 |
| ASiR-V (90%) | 0/0/13/13/0 | 0/0/15/11/0 | 3.46(0.50) | 0.85 | <0.001 |
| ASiR (100%) | 0/9/17/0/0 | 0/11/15/0/0 | 2.61(0.49) | 0.84 | <0.001 |
| ASiR-V (100%) | 0/9/10/7/0 | 0/9/13/4/0 | 2.87(0.74) | 0.82 | <0.001 |
ASiR, adaptive statistical iterative reconstruction; FBP, filtered back projection; SD, standard deviation.
The subjective score peaked at 50% for ASiR and 60% for ASiR-V.
Figure 5.
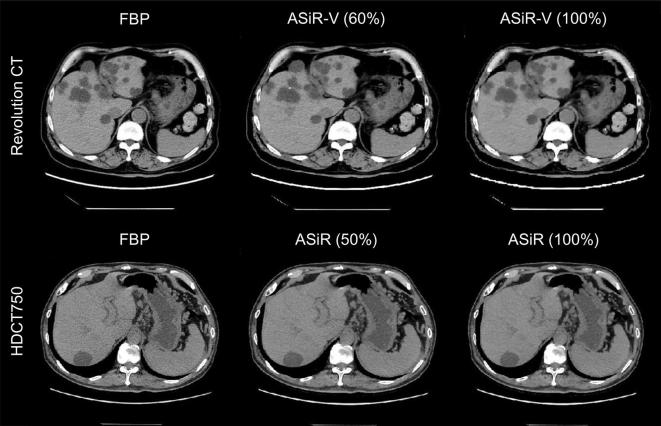
Comparisons of routine liver image between FBP, ASiR and ASiR-V. The top line were routine liver images of FBP, ASiR-V60% and ASiR-V100% on the Revolution CT scanner with subjective quality score of 4, 5 and 3, from left to right respectively; The bottom line were the routine liver images of FBP, ASiR50% and ASiR100% on the HDCT750 scanner with subjective quality score of 3, 4 and 3, from left to right respectively. ASiR, adaptive statistical iterative reconstruction; FBP, filtered back projection.
Discussion
In this study, we evaluated the objective and subjective image quality of the two IRalgorithms (ASiR and ASiR-V) on images in routine clinical liver CT and compared them with the conventional FBP reconstructions. Additionally, we determined the optimal IR blending percentage for ASiR and ASiR-V algorithms in routine liver CT to achieve the highest subjective image quality score that focused on the image resolution and texture. Our results showed that both ASiR and ASiR-V reduced the image noise and improved SNR compared with FBP, but ASiR-V images had greater noise reduction rate than ASiR images with the same IR blending percentage. Accordingly, as the blending percentage increased to 40% or greater, there were significant differences between the image noise of ASiR and ASiR-V. The situation was similar to image SNR as the percentage of blending increased to 30% or greater. We also evaluated the baseline noise performance of the two CT systems using conventional FBP images and demonstrated their equivalence.
For evaluating the optimal IR blending percentages of ASiR and ASiR-V algorithms, subjective image quality was assessed by two experienced radiologists on 10 sets of IR images with blending percentages from 10 to 100%. Our results indicated that the highest subjective image quality score was obtained at 50% for ASiR algorithm and 60% for ASiR-V algorithm. At the optimal percentage of 60% for ASiR-V, the image noise decreased by 51.5% compared with FBP, which was significantly more than the 31.2% decrease rate at the optimal percentage of 50% for ASiR. As the blending percentage increased greater than 50% for ASiR and 60% for ASiR-V, subjective image quality declined due to IR specific artifacts that manifest as a waxy texture in the images (blotchy, pixilated image texture and irregular edges).
An earlier study using phantoms evaluating mage noise, CNR, and spatial resolution measurements has shown that ASiR-V provided a similar image noise and CNR with 50% tube current reduction compared with ASiR or 75% reduction compared with FBP,15 however, the clinical diagnostic acceptance of the ASiR-V image quality was not assessed. Although another clinical study has shown that images reconstructed with 30% ASiR-V at 35.4% dose reduction has an equivalent score compared with routine dose ASiR images, and the study also mentioned that the 70% ASiR-V images appeared to have a “waxy” texture.16 However, there were two limitations of that study. Firstly, there were no ASiR-V images at the routine dose, therefore no assessment for the subjective ASiR-V image quality at routine dose; secondly, only a few IR blending percentages were selected with ASiR-V at low dose scanning, the optimal percentage of ASiR-V applied in routine dose liver CT could not been assessed. Our study provided incremental values to the previous studies with the clinical diagnostic acceptance evaluation and detailed analysis for getting the optimal IR blending percentages of ASiR and ASiR-V in routine liver CT application.
There were several limitations in our study. First, the sample size was relatively small, therefore, more patients are required to reach a solid conclusion. Also, we only used two observers in the study. It may need more than two observers to ensure the statistical integrity of the results. Second, scans were acquired at routine dose, and the evaluation needs to be extended to include low dose scans. Third, only image quality in terms of noise and SNR was evaluated in our study. Further studies are needed to use more sensible metric, e.g. a detectability index with a model observer to account for the potential noise power spectrum shift in the IR algorithms and to include tumor detection and diagnosis.
In summary, both ASIR and ASiR-V algorithms considerably improved the objective and subjective image quality for routine liver CT compared with those of FBP reconstructions. ASiR-V provided further image quality improvement with higher acceptable percentage than ASiR, and ASiR-V60% provided the highest image quality score for routine liver CT images.
Footnotes
The authors Li-hong Chen and Chao Jin contributed equally to the work.
Contributor Information
Li-hong Chen, Email: 316676511@qq.com.
Chao Jin, Email: jinny.369@163.com.
Jian-ying Li, Email: Jianying.Li@med.ge.com.
Ge-liang Wang, Email: wgeliang@163.com.
Yong-jun Jia, Email: 404754002@qq.com.
Hai-feng Duan, Email: dhf98@163.com.
Ning Pan, Email: 826026021@qq.com.
Jianxin Guo, Email: gjx1665@126.com.
REFERENCES
- 1.Pearce MS, Salotti JA, Little MP, McHugh K, Lee C, Kim KP, et al. Radiation exposure from CT scans in childhood and subsequent risk of leukaemia and brain tumours: a retrospective cohort study. Lancet 2012; 380: 499–505. doi: 10.1016/S0140-6736(12)60815-0 [DOI] [PMC free article] [PubMed] [Google Scholar]
- 2.Brenner DJ, Hall EJ. Computed tomography — an increasing source of radiation exposure. N Engl J Med 2007; 357: 2277–84. doi: 10.1056/NEJMra072149 [DOI] [PubMed] [Google Scholar]
- 3.Gunn ML, Kohr JR. State of the art: technologies for computed tomography dose reduction. Emerg Radiol 2010; 17: 209–18. doi: 10.1007/s10140-009-0850-6 [DOI] [PubMed] [Google Scholar]
- 4.Ghetti C, Ortenzia O, Serreli G. CT iterative reconstruction in image space: a phantom study. Phys Med 2012; 28: 161–5. doi: 10.1016/j.ejmp.2011.03.003 [DOI] [PubMed] [Google Scholar]
- 5.Gervaise A, Osemont B, Lecocq S, Noel A, Micard E, Felblinger J, et al. CT image quality improvement using adaptive iterative dose reduction with wide-volume acquisition on 320-detector CT. Eur Radiol 2012; 22: 295–301. doi: 10.1007/s00330-011-2271-7 [DOI] [PubMed] [Google Scholar]
- 6.Silva AC, Lawder HJ, Hara A, Kujak J, Pavlicek W. Innovations in CT dose reduction strategy: application of the adaptive statistical iterative reconstruction algorithm. AJR Am J Roentgenol 2010; 194: 191–9. doi: 10.2214/AJR.09.2953 [DOI] [PubMed] [Google Scholar]
- 7.Martinsen AC, Sæther HK, Hol PK, Olsen DR, Skaane P. Iterative reconstruction reduces abdominal CT dose. Eur J Radiol 2012; 81: 1483–1487. doi: 10.1016/j.ejrad.2011.04.021 [DOI] [PubMed] [Google Scholar]
- 8.Winklehner A, Karlo C, Puippe G, Schmidt B, Flohr T, Goetti R, et al. Raw data-based iterative reconstruction in body CTA: evaluation of radiation dose saving potential. Eur Radiol 2011; 21: 2521–6. doi: 10.1007/s00330-011-2227-y [DOI] [PubMed] [Google Scholar]
- 9.Funama Y, Taguchi K, Utsunomiya D, Oda S, Yanaga Y, Yamashita Y, et al. Combination of a low-tube-voltage technique with hybrid iterative reconstruction (iDose) algorithm at coronary computed tomographic angiography. J Comput Assist Tomogr 2011; 35: 480–5. doi: 10.1097/RCT.0b013e31821fee94 [DOI] [PMC free article] [PubMed] [Google Scholar]
- 10.Yu Z, Thibault JB, Bouman CA, Sauer KD, Hsieh J. Fast model-based X-ray CT reconstruction using spatially nonhomogeneous ICD optimization. IEEE Trans Image Process 2011; 20: 161–75. doi: 10.1109/TIP.2010.2058811 [DOI] [PubMed] [Google Scholar]
- 11.Fleischmann D, Boas FE. Computed tomography—old ideas and new technology. Eur Radiol 2011; 21: 510–7. doi: 10.1007/s00330-011-2056-z [DOI] [PubMed] [Google Scholar]
- 12.Pickhardt PJ, Lubner MG, Kim DH, Tang J, Ruma JA, del Rio AM, et al. Abdominal CT with model-based iterative reconstruction (MBIR): initial results of a prospective trial comparing ultralow-dose with standard-dose imaging. AJR Am J Roentgenol 2012; 199: 1266–74. doi: 10.2214/AJR.12.9382 [DOI] [PMC free article] [PubMed] [Google Scholar]
- 13.Singh S, Kalra MK, Hsieh J, Licato PE, Do S, Pien HH, et al. Abdominal CT: comparison of adaptive statistical iterative and filtered back projection reconstruction techniques. Radiology 2010; 257: 373–83. doi: 10.1148/radiol.10092212 [DOI] [PubMed] [Google Scholar]
- 14.Deák Z, Grimm JM, Treitl M, Geyer LL, Linsenmaier U, Körner M, et al. Filtered back projection, adaptive statistical iterative reconstruction, and a model-based iterative reconstruction in abdominal CT: an experimental clinical study. Radiology 2013; 266: 197–206. doi: 10.1148/radiol.12112707 [DOI] [PubMed] [Google Scholar]
- 15.Lim K, Kwon H, Cho J, Oh J, Yoon S, Kang M, et al. Initial phantom study comparing image quality in computed tomography using adaptive statistical iterative reconstruction and new adaptive statistical iterative reconstruction v. J Comput Assist Tomogr 2015; 39: 443. doi: 10.1097/RCT.0000000000000216 [DOI] [PubMed] [Google Scholar]
- 16.Kwon H, Cho J, Oh J, Kim D, Cho J, Kim S, et al. The adaptive statistical iterative reconstruction-V technique for radiation dose reduction in abdominal CT: comparison with the adaptive statistical iterative reconstruction technique. Br J Radiol 2015; 88: 20150463. doi: 10.1259/bjr.20150463 [DOI] [PMC free article] [PubMed] [Google Scholar]


