Abstract
Objective:
The aim of this study is to evaluate the utility of quantitative apparent diffusion coefficient (ADC) measurements and normalized ADC ratios in multiparametric MRI for the diagnosis of clinically significant peripheral zone (PZ) prostate cancer particularly among equivocally suspicious prostate lesions.
Methods:
A retrospective analysis of 95 patients with PZ lesions by PI-RADSv2 criteria, and who underwent subsequent MRI-US fusion biopsy, was approved by an institutional review board. Two radiologists independently measured ADC values in regions of interest (ROIs) of PZ lesions and calculated normalized ADC ratio based on ROIs in the bladder lumen. Diagnostic performance was evaluated using ROC. Inter observer variability was assessed using intraclass correlation coefficient (ICC).
Results:
Mean ADC and normalized ADC ratios for clinically significant and non-clinically significant lesions were 0.763 × 10⁻³ mm2 s−1, 29.8%; and 1.135 × 10⁻³ mm2 s−1, 47.2% (p < 0.001), respectively. Area under the ROC curve (AUC) was 0.880 [95% CI (0.816–0.944) and 0.885 (95% CI (0.814–0.955)] for ADC and ADC ratio, respectively. Optimal AUC threshold for ADC was 0.843 × 10⁻³ mm2 s−1 (Sn 70.5%, Sp 88.2%) and for normalized ADC was 33.1% (Sn 75.0%, Sp 95.7%). intraclass correlation coefficient was high at 0.889.
Conclusion:
Quantitative ADC measurement in PZ prostate lesions demonstrates excellent diagnostic performance in differentiating clinically significant from non-clinically significant prostate cancer with high inter observer correlation.
Advances In knowledge:
Quantitative ADC is presented as an additional method to evaluate lesions in mpMRI of the prostate. This technique may be incorporated in new and existing methods to improve detection and discrimination of clinically significant prostate cancer.
Introduction
Prostate cancer is the most commonly diagnosed solid malignancy among males in the United States and Western Europe. In 2017, it is estimated that 161,360 males in the United States will be diagnosed with prostate cancer, and 26,730 males will die from their disease.1 Traditional use of serum prostate-specific antigen (PSA) screening and random 12-core biopsy have led to disappointing clinical outcomes, with both overdiagnosis of indolent tumors and underdiagnosis of high-risk cancers.2
Recent advances in imaging technology have led to the development of multiparametric MRI (mpMRI) as a valuable tool to detect clinically significant prostate cancer (csPCa) and to guide biopsies.2 mpMRI combines morphologic assessment using T1 weighted and T2 weighted sequences with functional and physiologic assessment using diffusion weighted imaging (DWI), its derivative apparent diffusion coefficient (ADC) maps, dynamic-contrast enhanced (DCE) MRI, and other techniques.3 Compared with serum PSA screening and random biopsy, mpMRI in combination with ultrasound-guided fusion biopsy allows for direct assessment of size, location, and characterization of distinct lesions within the prostate gland.4–6
Prostate Imaging-Reporting and Data System (PI-RADS) v2 was developed in 2015 by a Steering Committee established by the American College of Radiology (ACR), European Society of Urogenital Radiology (ESUR), and AdMeTech Foundation, to standardize currently available mpMRI prostate imaging techniques.3 PI-RADS v2 includes a scoring system to summarize levels of suspicion or risk of prostate cancer based on mpMRI findings. PI-RADS v2 assessment categories can be used select patients for biopsies and management.
Approximately 70–75% of prostate cancers originate in the peripheral zone (PZ), whereas 20–30% originate in the transition zone (TZ). For PZ lesions, DWI is the primary determining sequence of PI-RADS v2 assessment category, whereas the dominant technique for TZ lesions is T2 weighted sequence. Using PI-RADS v2 assessment, DWI images and ADC maps of suspected PZ lesions are evaluated only on a qualitative basis. The aim of this study is to evaluate the utility of quantitative apparent diffusion coefficient (ADC) measurements and normalized ADC ratios in multiparametric MRI for the diagnosis of clinically significant PZ prostate cancer particularly among equivocally suspicious prostate lesions.
methods and Materials
All aspects of this study were approved by the institutional review board at our institution. The informed consent requirement was waived due to the retrospective study design. A single center, retrospective study was performed. Inclusion criteria were: males who underwent mpMRI with subsequent 12-core Artemis 3D TRUS (Eigen, Grass Valley, CA) and MRI/Transrectal ultrasound (MRI/TRUS) fusion biopsy using Artemis and ProFuse software (Eigen, Grass Valley, CA) at our institution and who had PZ lesions identified on mpMRI, over a 15-month period from September 2014 to November 2015. Subjects were excluded from the analysis if they did not undergo both 12-core and MRI/TRUS fusion biopsy, or if complete follow-up data was unavailable. Subjects younger than 40 years old were considered outliers from the clinically encountered presentation of prostate cancer and excluded from the analysis. The records of 95 consecutive patients who met these criteria were evaluated.
Clinical mpMRI, including DWI and ADC sequences was performed on one Siemens Magnetom Symphony 3-Tesla MRI scanner (Siemens AG, Munich, Germany) and one Phillips Ingenia 3-Tesla MRI scanner (Phillips Healthcare, Amsterdam, Netherlands) at one academic medical institution without endorectal coil. Sequences performed included coronal T1, axial, coronal and sagittal T2, DWI, ADC, and DCE sequences. The mpMRI ADC b-values are detailed in Table 1. The biopsy protocol included lesion directed MR/TRUS fusion biopsy in conjunction with standard 12 segment biopsy performed by clinical urologist.
Table 1.
For each region of interest, the b-value used for ADC mapping is noted. The number of times each b-value was used in our study is listed under “Frequency,” with the respective percentage in the next column
| Frequency table of mpMRI ADC b-values | ||
| b-value (s mm−2) | Frequency | Percent |
| 800.0 | 29 | 21.2 |
| 1000.0 | 8 | 5.8 |
| 1400.0 | 82 | 59.9 |
| 2000.0 | 18 | 13.1 |
| Total | 137 | 100.0 |
ADC, apparent diffusion coefficient; mpMRI, multiparametric MRI.
PI-RADS v2 scoring of the mpMRI studies was performed by a fellowship trained, board certified radiologist (A) with more than 5 years experience with prostate mpMRI. The scoring radiologist was blinded to biopsy results and any prior mpMRI reports, but was given access to pre-biopsy clinical data as per usual routine.
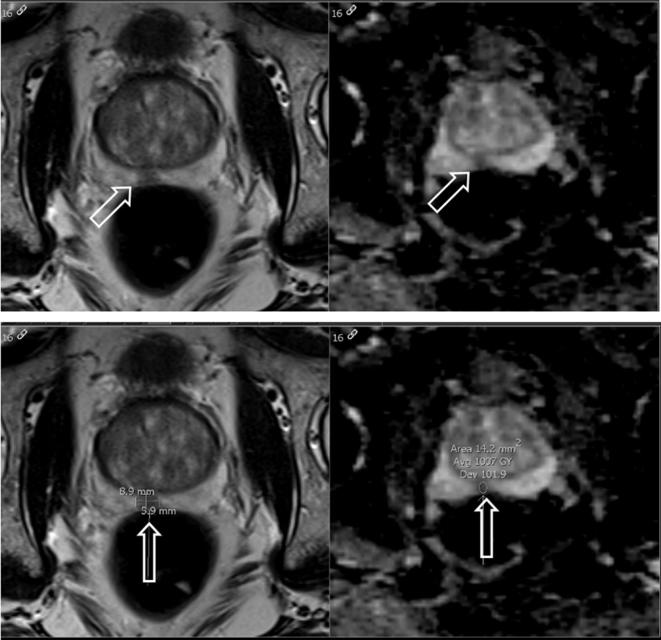
Two radiologists (B; C) with 4 and 3 years of experience, respectively, independently reviewed the images on dedicated radiology workstations utilizing IMPAX 6.5 (Agfa-Gevaert N.V., Mortsel, Belgium) in a blinded fashion and drew a total of 137 regions of interest (ROIs) within areas of visually low ADC in the peripheral zone (Figure 1). The ROIs were placed on the slice depicting the greatest area of tumor. Readers did not evaluate non-ADC mpMRI sequences, to better evaluate ADC as an independent predictor.
Figure 1.
Axial T2 weighted image (left) and corresponding ADC map (right) of a suspicious peripheral zone prostate lesion which demonstrates decreased T2 signal and associated quantitative decreased ADC value of 1.007 × 10⁻³ mm2 s−1. (top row unlabeled, bottom row labeled). ADC, apparent diffusion coefficient.
A positive biopsy result was defined as Gleason score ≥ 6 lesion within the same sector as a corresponding lesion identified on mpMRI. Clinically significant lesions were defined as histopathologic Gleason score of 7 or greater and non-clinically significant lesions were defined as Gleason score less than 7.4
To address potential differences between MRI scanners, attempts to standardize signal intensity values by directly comparing to ADC values of urine in the bladder and calculating a normalized ADC ratio were performed. ROIs were placed within the lumen of the urinary bladder, and a normalized ADC ratio was calculated as ADC value of suspected lesion divided by ADC value of urine in the bladder.
Statistical analysis was performed utilizing the Analyse-It software (Analyse-It Software Ltd., Leeds, UK), SPSS (IBM, Armonk, NY), and Microsoft Excel (Microsoft Inc., Redmond, OR). Statistical significance was determined with a p value < 0.05. Diagnostic performance was evaluated using receiver operating characteristic (ROC) analysis, with secondary analysis performed on subgroups based on PI-RADS categories. Optimal threshold values were calculated to maximize the sum of sensitivity (Sn) and specificity (Sp) (Youden index). Inter observer variability was assessed using intraclass correlation coefficient (ICC).
Results
Of the 95 consecutive patients evaluated at our institution, 57 patients had one suspicious PZ lesion, 34 patients had two suspicious PZ lesions, and four patients had three suspicious PZ lesions. The mean patient age was 65 years (range: 25–96 years). The mean ADC value for the urinary bladder was 2.516 10−3*mm2 s–1 (range 1.657–3.818 10−3*mm2 s−1). The mean lesion size was 14 mm (range 5–55 mm). The mean ROI size was 28 mm2 (range 6–147 mm2). Table 2 summarizes clinical and mpMRI findings of the patient cohort. For four patients the baseline PSA value and the date of initial biopsy were unavailable.
Table 2.
Descriptive statistics of clinical and mpMRI parameters. Of note, for four subjects the baseline PSA and days between biopsy and MRI were not available and not included in the above evaluation
| PSA (ng ml−1) |
Days between MRI and biopsy | ADC value (10−3* mm2 s−1) |
ADC bladder values (10−3* mm2 s−1) |
ADC normalized ratio | ||
| Mean | 7.0981 | 33.4135 | 1.015 | 2.516 | 0.41610 | |
| SD | 4.39035 | 30.63795 | 0.297 | 0.507 | 0.127832 | |
| Minimum | 1.50 | 1.00 | 0.420 | 1.657 | 0.118 | |
| Maximum | 38.50 | 191.00 | 1.930 | 3.818 | 0.698 | |
| Percentiles | 25 | 4.5000 | 10.5000 | 0.793 | 2.004 | 0.31287 |
| 50 | 6.0300 | 27.0000 | 1.006 | 2.655 | 0.43671 | |
| 75 | 9.3000 | 45.0000 | 1.228 | 2.873 | 0.50351 | |
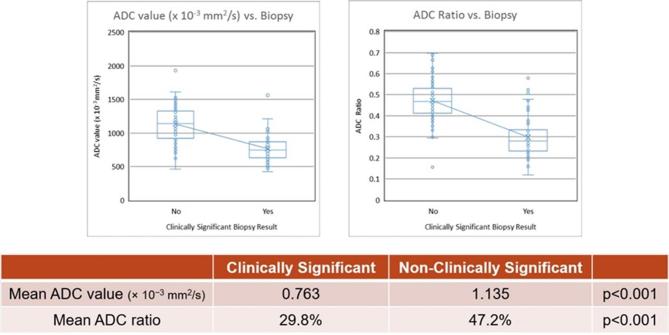
Evaluation of quantitative ADC value and normalized ADC ratio demonstrated ADC and ADC ratio were lower in clinically significant cancer compared to non-clinically significant prostate lesions. The mean ADC values for clinically significant and non-clinically significant peripheral zone prostate lesions were 0.763 × 10⁻³ mm2 s−1 and 1.135 × 10⁻³ mm2 s−1, respectively (p < 0.001). The mean normalized ADC ratios for clinically significant and non-clinically significant lesions were 29.8 and 47.2%, respectively (p < 0.001) (Figure 2).
Figure 2.
Box-and-whisker plots of ADC value and ADC ratio against biopsy result for clinically significant (defined as histopathologic Gleason score of 7 or greater) and non-clinically significant peripheral zone prostate lesions. There was a statistically significant difference between clinically significant and non-clinically significant peripheral zone prostate lesions for both quantitative ADC value and normalized ADC ratio. ADC, apparent diffusion coefficient.
A spearman’s correlation test was performed to assess the relationship between PI-RADSv2 scores, ADC values, and ADC ratios with Gleason scores. The relationship between ADC normalized ratios and Gleason scores had the largest spearman correlation coefficient in absolute value terms (rs = −0.591, p < 0.001), followed by ADC values and Gleason scores (rs = −0.560, p < 0.001), followed by PI-RADSv2 scores and Gleason scores (rs = 0.480, p < 0.001).
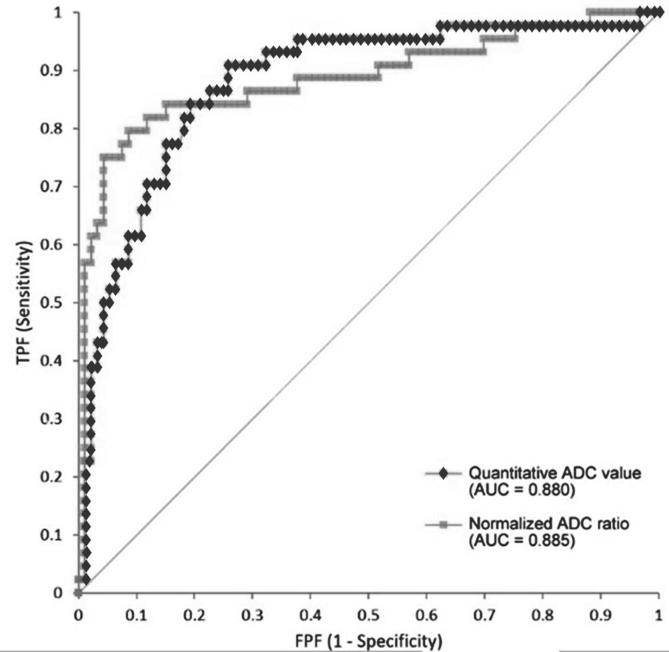
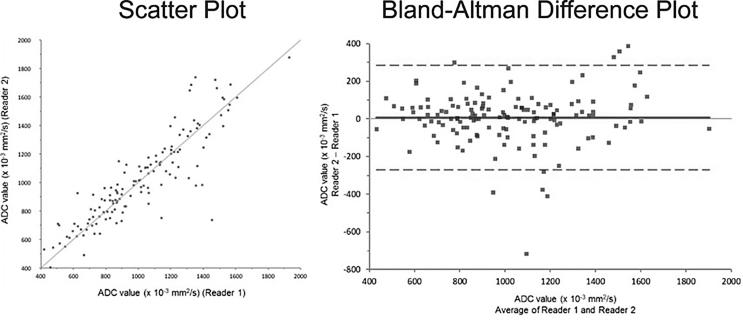
The area under the ROC curve (AUC) was 0.880 (95% CI: 0.816–0.944) and 0.885 (95% CI: 0.814–0.955) for ADC and ADC ratio, respectively (Figure 3). Inter observer correlation between the two readers was excellent (ICC = 0.889) (Figure 4). On subgroup analysis, the AUC for PI-RADS category 2, 3, 4, and 5 lesions were 1.000 (n = 8), 0.812 [n = 70, 95% CI (0.667–0.957)], 0.934 [n = 39, 95% CI (0.861–1.007)], and 0.747 [n = 20, 95% CI (0.396–1.097)], respectively (Figure 5). The overall AUC for Siemens scanner was 0.878 [95% CI (0.815–0.941)] and for Phillips scanner was 0.890 [95% CI (0.672–1.108)].
Figure 3.
ROC analysis demonstrates excellent diagnostic performance for both quantitative ADC value (AUC = 0.880) and normalized ADC ratio (AUC = 0.885). ADC, apparent diffusion coefficient; AUC, area under the ROC curve; ROC, receiver operating characteristic.
Figure 4.
Scatter plot and Bland-Altman difference plot demonstrate excellent interobserver correlation between two radiologists who independently labeled the images in a blinded fashion. The intraclass correlation coefficient was calculated as 0.889.
Figure 5.
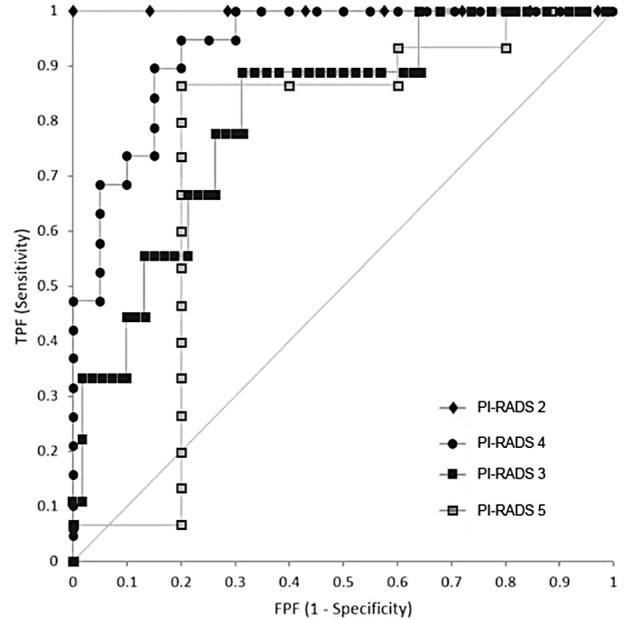
ROC analysis of subgroups based on PI-RADS v2 assessment category demonstrate AUC of 1.000 for PI-RADS category 2 lesions (n = 8, green line), AUC of 0.812 for PI-RADS category 3 lesions [n = 70, 95% CI (0.667–0.957), blue line], AUC of 0.934 for PI-RADS category 4 lesions [n = 39, 95% CI (0.861–1.007), red line], and AUC of 0.747 for PI-RADS category 5 lesions [n = 20, 95% CI (0.396–1.097), green line]. AUC, area under the ROC curve; PI-RADS, Prostate Imaging-Reporting and Data System; ROC, receiver operating characteristic.
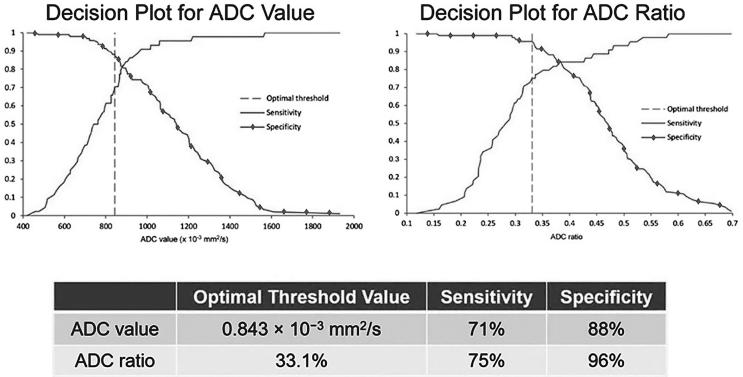
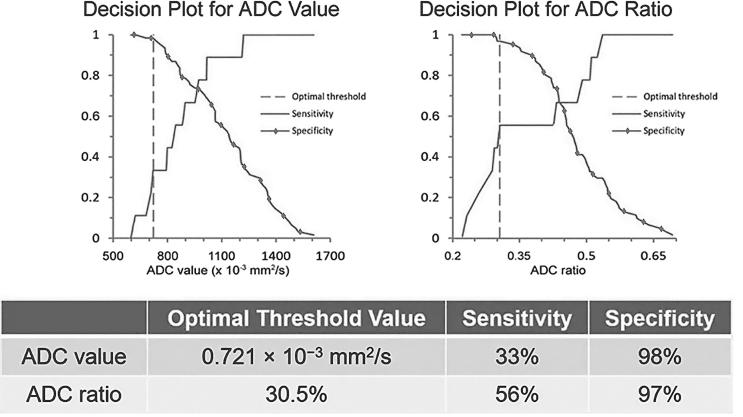
The overall AUC optimal threshold value was calculated as 0.843 × 10⁻³ mm2 s−1 (Sn 70.5%, Sp 88.2%) based on Youden Index. The normalized ADC ratio optimal threshold value was 33.1% (Sn 75.0%, Sp 95.7%) (Figure 4). For PI-RADS category 3 lesions, optimal threshold values for ADC and ADC ratio were 0.721 × 10⁻³ mm2 s−1 (Sn 33.3%, Sp 98.4%) and 30.5% (Sn 55.6%, Sp 96.7%), respectively (Figure 6). For all PI-RADS categories, optimal threshold values for ADC and ADC ratio were 0.843 × 10⁻³ mm2 s−1 (Sn 71%, Sp 88%) and 33.1% (Sn 75%, Sp 96%), respectively (Figure 7).
Figure 6. .
Decision plots demonstrate sensitivity and specificity vs ADC value and ADC ratio for PIRADS category 3 lesions. Optimal threshold value was calculated to maximize the sum of sensitivity and specificity. For PI-RADS Category 3 lesions, these threshold values are able to provide for very high specificity for diagnosis of clinically significant peripheral zone prostate cancer. ADC, apparent diffusion coefficient; PI-RADS, Prostate Imaging-Reporting and Data System.
Figure 7. .
Decision plots demonstrate sensitivity and specificity vs ADC value and ADC ratio. Optimal threshold value was calculated to maximize the sum of sensitivity and specificity. ADC, apparent diffusion coefficient.
Discussion
Quantitative measurement of ADC values in suspicious peripheral zone prostate lesions demonstrates excellent diagnostic performance in differentiating clinically significant prostate cancer from non-clinically significant lesions, with overall AUC of 0.880, and sensitivity of 71% and specificity of 88% at an optimal ADC threshold value of 0.843 × 10⁻³ mm2 s−1. We showed that these results are reproducible with high inter observer correlation between two independent radiologists. Previous studies have shown an association between ADC values and clinical risk scores,7 and between ADC values and Gleason grade.8 Nagayama et al proposed a cutoff ADC level of 1.35 × 10⁻³ mm2 s−1, which is higher than in our study.9 However, their study did not differentiate between PZ and TZ lesions in assigning a final cutoff level. In our study, we have focused on PZ lesions as multiple prior studies did not show clinical significance of ADC analysis outside the PZ,10–12 in order to avoid false positives from other disease processes such as benign prostatic hyperplasia which occur in the TZ,13 and due to the fact that the majority of prostate cancer occurs in the PZ.
In PI-RADS v2, due to technical issues related to potential differences between MRI scanners, DWI images and ADC maps of suspected peripheral zone lesions are evaluated only on a qualitative basis. At our institution, two different MRI scanners were used in this study. We attempted to standardize signal intensity values by directly comparing to ADC values of urine in the bladder and calculating a normalized ADC ratio. Although no significant differences in ADC values were found between the two scanners in our study, such potential differences may be normalized by using an ADC ratio. We found that normalized ADC ratios improved overall specificity (from 88% with ADC value alone to 96% using ADC ratio) at an optimal threshold ADC ratio of 30.5% compared to ADC value alone.
Previous attempts to normalize ADC values have primarily focused on comparing the lesion ADC value with the ADC value of adjacent normal prostate tissue, with variable results. While Lebovici et al, Litjens et al, Boesen et al and Barrett et al showed that incorporating normal PZ ADC or calculating normal-to-diseased ADC ratio may be better than ADC alone,10,14–16 subsequent studies by de Cobelli et al and Rosencrantz et al demonstrate better performance for ADC alone compared to a normalized ratio.17, 18 In the setting of vesical urothelial carcinoma, Wang et al demonstrated that normalizing the ADC value of the tumor to the ADC value of urine in the bladder lumen resulted in superior diagnostic performance.19 More recently, an analysis by Park et al suggested the use of quantitative ADC ratio to supplement interpretation qualitative DWI scores in PZ lesions.20 The application of this technique to prostate cancer was first attempted by Itatani et al, who showed superior diagnostic performance of normalizing ADC value with both urine in the bladder and saline in a bottle, in a cohort of 58 patients.21 Woo et al similarly evaluated quantitative ADC and ADC to bladder ratio and did not find a significant difference between the two methods when compared with radical prostatectomy specimens.22 Unlike Woo et al, this study evaluated ADC value and ADC ratio against MR/TRUS fusion biopsy results, to better evaluate its prospective utility in current clinical practice. Additionally, unlike the majority of prior studies, in this evaluation mpMRI was performed on biopsy naïve patients, better simulating predictive use of mpMRI in clinical practice and resolving confounding of post-biopsy change on imaging. In our study, we did not find a significant difference in diagnostic performance between ADC value and ADC ratio by ROC analysis. However, we did find a mild improvement in specificity using ADC ratio compared to ADC value alone.
This potential improvement in specificity may be most useful among PI-RADS category 3 lesions, which tend to have low yield for clinically significant cancers. PI-RADS category 3 lesions represent a large source of false positives. According to PI-RADS v2 criteria, biopsy should be considered for PI-RADS category 4 (high risk) and PI-RADS category 5 (very high risk) lesions. For PI-RADS category 1 (very low risk) lesions, biopsy should not be considered. For PI-RADS 2 (low risk) lesions, biopsy should not be considered unless laboratory, clinical or other non-imaging factors prompt further evaluation. For PI-RADS 3 (intermediate) lesions, biopsy and management recommendations are unclear. In our study, on subgroup analysis, we found that for PI-RADS category 3 lesions, threshold ADC value of 0.721 × 10⁻³ mm2 s−1 and threshold ADC ratio of 30.5% resulted in very high specificity of 98 and 97%, respectively, while maintaining moderate sensitivity for clinically significant peripheral zone prostate cancer.
Currently, DCE sequences are used to evaluate suspected PI-RADS category 3 lesions and better discriminate cases into category 3 vs category 4 in the peripheral zone. In this context, quantitative ADC and ADC ratio may similarly serve as an adjunct to T2 weighted images. Additionally, since ADC and ADC ratio are quantitative measures, a specific cut-off would allow for better standardization in mpMRI evaluation. Future studies may compare the efficacy of ADC-based measures to DCE in discriminating PI-RADS 3 and 4 lesions.
This study is not without limitations. Firstly, the study is retrospective in design and limited by its selection criteria. Next, the small sample size and use of only two MRI scanners at the same medical center limit the statistical power and generalization of results. Third, only two independent readers were utilized. Fourth, all examinations were performed on a 3 T MRI without use of endorectal coil, as per PIRADS protocol; these results may differ in studies performed on 1.5 T MRI with endorectal coil. Patients were aggregated at a tertiary medical center and may represent a disproportionately advanced disease group when compared to community practice. Due to local clinical practices, patients referred for mpMRI were predominantly those with clinically indeterminate disease or suspected recurrence. For this reason, PI-RADS 3 and 4 lesions are greater in number compared to PI-RADS 2 or 5. Consistently, there is increased confidence interval for analysis of PI-RADS 5 lesions. Evaluating the utility of quantitative ADC or normalized ADC ratio for PI-RADS 5 cases is limited in our study. Finally, findings were compared to fusion biopsy results rather than the gold standard of prostatectomy. In our region, the standard of practice does not include prostatectomy for the majority of our cohort. While this limits the definite accuracy of pathologic evaluation, this approach more accurately reflects current clinical utilization of mpMRI in our region.
In conclusion, quantitative ADC measurements in suspicious peripheral zone prostate lesions reproducibly differentiates clinically significant prostate cancer from non-clinically significant lesions. ADC ratios normalized to urine in the bladder do not improve overall diagnostic performance, however, do result in mildly improved specificity. Among PI-RADS category 3 lesions, which tend to have low yield for clinically significant cancers, both quantitative ADC value and normalized ADC ratio measurements produced high specificity in differentiating clinically significant prostate cancer, and such measurements may warrant reclassification into higher PI-RADS categories in future revisions of PI-RADS.
Footnotes
Acknowledgements: The authors would like to acknowledge Alessandra Miranda-Aguirre MD for assistance with this work.
Contributor Information
Tan B Nguyen, Email: TanBNguyen@gmail.com.
Alexander Ushinsky, Email: aushinsky@gmail.com; AUshinsk@uci.edu.
Albert Yang, Email: yang.albert@gmail.com.
Michael Nguyentat, Email: mnguyent@uci.edu.
Sara Fardin, Email: sarafardin1986@gmail.com.
Edward Uchio, Email: euchio@uci.edu.
Chandana Lall, Email: clall@uci.edu.
Thomas Lee, Email: thomakl1@uci.edu.
Roozbeh Houshyar, Email: rhoushya@uci.edu.
REFERENCES
- 1.Siegel RL, Miller KD, Jemal A. Cancer statistics, 2017. CA Cancer J Clin 2017; 67: 7–30. doi: 10.3322/caac.21387 [DOI] [PubMed] [Google Scholar]
- 2.Turkbey B, Brown AM, Sankineni S, Wood BJ, Pinto PA, Choyke PL. Multiparametric prostate magnetic resonance imaging in the evaluation of prostate cancer. CA Cancer J Clin 2016; 66: 326–36. doi: 10.3322/caac.21333 [DOI] [PMC free article] [PubMed] [Google Scholar]
- 3.Weinreb JC, Barentsz JO, Choyke PL, Cornud F, Haider MA, Macura KJ, et al. . PI-RADS prostate imaging - reporting and data system: 2015, version 2. Eur Urol 2016; 69: 16–40. doi: 10.1016/j.eururo.2015.08.052 [DOI] [PMC free article] [PubMed] [Google Scholar]
- 4.Ploussard G, Epstein JI, Montironi R, Carroll PR, Wirth M, Grimm MO, et al. . The contemporary concept of significant versus insignificant prostate cancer. Eur Urol 2011; 60: 291–303. doi: 10.1016/j.eururo.2011.05.006 [DOI] [PubMed] [Google Scholar]
- 5.Fütterer JJ, Briganti A, De Visschere P, Emberton M, Giannarini G, Kirkham A, et al. . Can clinically significant prostate cancer be detected with multiparametric magnetic resonance imaging? a systematic review of the literature. Eur Urol 2015; 68: 1045–53. doi: 10.1016/j.eururo.2015.01.013 [DOI] [PubMed] [Google Scholar]
- 6.Cash H, Maxeiner A, Stephan C, Fischer T, Durmus T, Holzmann J, et al. . The detection of significant prostate cancer is correlated with the Prostate Imaging Reporting and Data System (PI-RADS) in MRI/transrectal ultrasound fusion biopsy. World J Urol 2016; 34: 525–32. doi: 10.1007/s00345-015-1671-8 [DOI] [PubMed] [Google Scholar]
- 7.Turkbey B, Shah VP, Pang Y, Bernardo M, Xu S, Kruecker J, et al. . Is apparent diffusion coefficient associated with clinical risk scores for prostate cancers that are visible on 3-T MR images? Radiology 2011; 258: 488–95. doi: 10.1148/radiol.10100667 [DOI] [PMC free article] [PubMed] [Google Scholar]
- 8.Hambrock T, Somford DM, Huisman HJ, van Oort IM, Witjes JA, Hulsbergen-van de Kaa CA, et al. . Relationship between apparent diffusion coefficients at 3.0-T MR imaging and Gleason grade in peripheral zone prostate cancer. Radiology 2011; 259: 453–61. doi: 10.1148/radiol.11091409 [DOI] [PubMed] [Google Scholar]
- 9.Nagayama M, Watanabe Y, Terai A, Araki T, Notohara K, Okumura A, et al. . Determination of the cutoff level of apparent diffusion coefficient values for detection of prostate cancer. Jpn J Radiol 2011; 29: 488–94. doi: 10.1007/s11604-011-0586-6 [DOI] [PubMed] [Google Scholar]
- 10.Boesen L, Chabanova E, Løgager V, Balslev I, Thomsen HS. Apparent diffusion coefficient ratio correlates significantly with prostate cancer gleason score at final pathology. J Magn Reson Imaging 2015; 42: 446–53. doi: 10.1002/jmri.24801 [DOI] [PubMed] [Google Scholar]
- 11.Verma S, Rajesh A, Morales H, Lemen L, Bills G, Delworth M, et al. . Assessment of aggressiveness of prostate cancer: correlation of apparent diffusion coefficient with histologic grade after radical prostatectomy. AJR Am J Roentgenol 2011; 196: 374–81. doi: 10.2214/AJR.10.4441 [DOI] [PubMed] [Google Scholar]
- 12.Tamada T, Sone T, Jo Y, Toshimitsu S, Yamashita T, Yamamoto A, et al. . Apparent diffusion coefficient values in peripheral and transition zones of the prostate: comparison between normal and malignant prostatic tissues and correlation with histologic grade. J Magn Reson Imaging 2008; 28: 720–6. doi: 10.1002/jmri.21503 [DOI] [PubMed] [Google Scholar]
- 13.Elbuluk O, Muradyan N, Shih J, Bernardo M, Sankineni S, Merino MJ, et al. . Differentiating transition zone cancers from benign prostatic hyperplasia by quantitative multiparametric magnetic resonance imaging. J Comput Assist Tomogr 2016; 40: 218–24. doi: 10.1097/RCT.0000000000000353 [DOI] [PMC free article] [PubMed] [Google Scholar]
- 14.Lebovici A, Sfrangeu SA, Feier D, Caraiani C, Lucan C, Suciu M, et al. . Evaluation of the normal-to-diseased apparent diffusion coefficient ratio as an indicator of prostate cancer aggressiveness. BMC Med Imaging 2014; 14: 15. doi: 10.1186/1471-2342-14-15 [DOI] [PMC free article] [PubMed] [Google Scholar]
- 15.Litjens GJ, Hambrock T, Hulsbergen-van de Kaa C, Barentsz JO, Huisman HJ. Interpatient variation in normal peripheral zone apparent diffusion coefficient: effect on the prediction of prostate cancer aggressiveness. Radiology 2012; 265: 260–6. doi: 10.1148/radiol.12112374 [DOI] [PubMed] [Google Scholar]
- 16.Barrett T, Priest AN, Lawrence EM, Goldman DA, Warren AY, Gnanapragasam VJ, et al. . Ratio of tumor to normal prostate tissue apparent diffusion coefficient as a method for quantifying DWI of the prostate. AJR Am J Roentgenol 2015; 205: W585–W593. doi: 10.2214/AJR.15.14338 [DOI] [PubMed] [Google Scholar]
- 17.De Cobelli F, Ravelli S, Esposito A, Giganti F, Gallina A, Montorsi F, et al. . Apparent diffusion coefficient value and ratio as noninvasive potential biomarkers to predict prostate cancer grading: comparison with prostate biopsy and radical prostatectomy specimen. AJR Am J Roentgenol 2015; 204: 550–7. doi: 10.2214/AJR.14.13146 [DOI] [PubMed] [Google Scholar]
- 18.Rosenkrantz AB, Khalef V, Xu W, Babb JS, Taneja SS, Doshi AM. Does normalisation improve the diagnostic performance of apparent diffusion coefficient values for prostate cancer assessment? A blinded independent-observer evaluation. Clin Radiol 2015; 70: 1032–7. doi: 10.1016/j.crad.2015.05.011 [DOI] [PubMed] [Google Scholar]
- 19.Wang HJ, Pui MH, Guo Y, Li SR, Liu MJ, Guan J, et al. . Value of normalized apparent diffusion coefficient for estimating histological grade of vesical urothelial carcinoma. Clin Radiol 2014; 69: 727–31. doi: 10.1016/j.crad.2014.03.001 [DOI] [PubMed] [Google Scholar]
- 20.Park SY, Shin SJ, Jung DC, Cho NH, Choi YD, Rha KH, et al. . PI-RADS version 2: quantitative analysis aids reliable interpretation of diffusion-weighted imaging for prostate cancer. Eur Radiol 2017; 27: 2776–83. doi: 10.1007/s00330-016-4678-7 [DOI] [PubMed] [Google Scholar]
- 21.Itatani R, Namimoto T, Yoshimura A, Katahira K, Noda S, Toyonari N, et al. . Clinical utility of the normalized apparent diffusion coefficient for preoperative evaluation of the aggressiveness of prostate cancer. Jpn J Radiol 2014; 32: 685–91. doi: 10.1007/s11604-014-0367-0 [DOI] [PubMed] [Google Scholar]
- 22.Woo S, Kim SY, Cho JY, Kim SH. Preoperative evaluation of prostate cancer aggressiveness: using ADC and ADC ratio in determining gleason score. AJR Am J Roentgenol 2016; 207: 114–20. doi: 10.2214/AJR.15.15894 [DOI] [PubMed] [Google Scholar]


