Abstract
Objective:
This paper studies the possibilities of an integrated IT-based workflow for epidemiological research in pulmonary embolism (PE) using freely available tools and structured reporting (SR).
Methods:
We included a total of 521 consecutive cases which had been referred to the radiology department for CT pulmonary angiography with suspected PE. Free-text reports were transformed into structured reports using a freely available IHE Management of Radiology Report Templates-compliant reporting platform. D-dimer values were retrieved from the hospitals laboratory results system. All information was stored in the platform’s database and visualized using freely available tools. For further analysis, we directly accessed the platform’s database with an advanced analytics tool (RapidMiner).
Results:
Results: We were able to develop an integrated workflow for epidemiological statistics from reports obtained in clinical routine. The report data allowed for automated calculation of epidemiological parameters. Prevalence of PE was 27.6%. The mean age in patients with and without PE did not differ (62.8 years and 62.0 years, respectively, p = 0.987). As expected, there was a significant difference in mean D-dimer values (10.13 and 3.12 mg l−1 fibrinogen equivalent units, respectively, p < 0.001). Conclusion: SR can make data obtained from clinical routine more accessible. Designing practical workflows is feasible using freely available tools and allows for the calculation of epidemiological statistics on a near realtime basis. Therefore, radiologists should push for the implementation of SR in clinical routine.
Summary sentence:
Implementing practical workflows that allow for the calculation of epidemiological statistics using SR and freely available tools is easily feasible.
Advances in knowledge:
Theoretical benefits of SR have long been discussed, but practical implementation demonstrating those benefits has been lacking. Here, we present a first experience providing proof that SR will make data from clinical routine more accessible.
Introduction
When considering referrals from emergency departments, CT pulmonary angiography (CTPA) for suspected pulmonary embolism (PE) is one of the most frequent radiological examinations. PE is a potentially life-threatening condition and the third most common acute cardiovascular disorder.1 CTPA has been well-established as a mainstay in the diagnostic algorithms for PE.2 However, there is concern that compliance to guidelines may be low and that CTPA is overutilized.3–5 Prediction models could help to determine in which cases CTPA should or should not be considered, but potentially require a very large number of cases to be validated. Hence, it would be favorable if all cases from clinical routine could automatically be included in such efforts.
Traditional free-text reports are not easily accessible for further automated analysis. Therefore, data from clinical routine can often not be used to build prediction models or to compute epidemiological parameters such as the prevalence of a certain condition. Structured reporting (SR) could help solving this challenge and has recently been deemed the “future” or even the “nuclear fusion reactor” of radiology. It could be a very promising way to enhance radiological result reporting.6, 7 However, the implementation of SR into the daily workflow of radiologists has not been accomplished yet,8, 9 even though there is clear evidence for the benefits of SR.10–14 Most major radiological societies have published recommendations promoting the adoption of SR into clinical practice.15–17
With the recently published trial implementation of the IHE Management of Radiology Report Templates (MRRT) profile, the technical basis for SR has been well defined.18 Although at this point, integration of MRRT-compliant templates into solutions provided by major vendors is scarce, prototype applications have been described.19
In order to analyze the data collected from report databases or other clinical data repositories, specific software packages are needed. In order to enable easy access to the data for users with varying levels of expertise, visual, code-free tools could be a suitable solution. There are multiple tools available that fulfill these requirements, and technology in the field of big data and machine learning is progressing at great speed.20 Also, machine learning techniques are becoming more and more common in medical research and may lead to new insights and a better understanding of prediction models.21–24
In our work, we therefore aimed at exploring the potential of SR in radiology to make clinical and radiological report data accessible for further automated analysis. We present a proof-of-concept for a scalable workflow, where epidemiological and other parameters are calculated using only freely available tools in a well-defined clinical scenario.
Methods and materials
Patient selection
As a trial cohort to demonstrate the feasibility of our proposed workflow, we included all consecutive patients that were referred to the radiology department for CTPA with suspected PE from the hospital’s emergency departments between January 2013 and January 2015. Patient’s D-dimer values determined prior to the CTPA were obtained from the hospitals laboratory results system, while conventional written radiological reports were retrieved from the department’s radiology information system.
Structured reporting
We developed a dedicated report template for CTPA (Figure 1). This HTML5-template was developed according to the IHE’s MRRT profile18 and then imported into an open-source reporting platform, where it could be used to create structured reports. The results of these reports were then stored in the corresponding database tables. The reporting platform uses standard web-technology such as PHP, MySQL and JavaScript as well as some external libraries for Digital Imaging and Communications in Medicine communication and has already been described in the literature.19
Figure 1. .
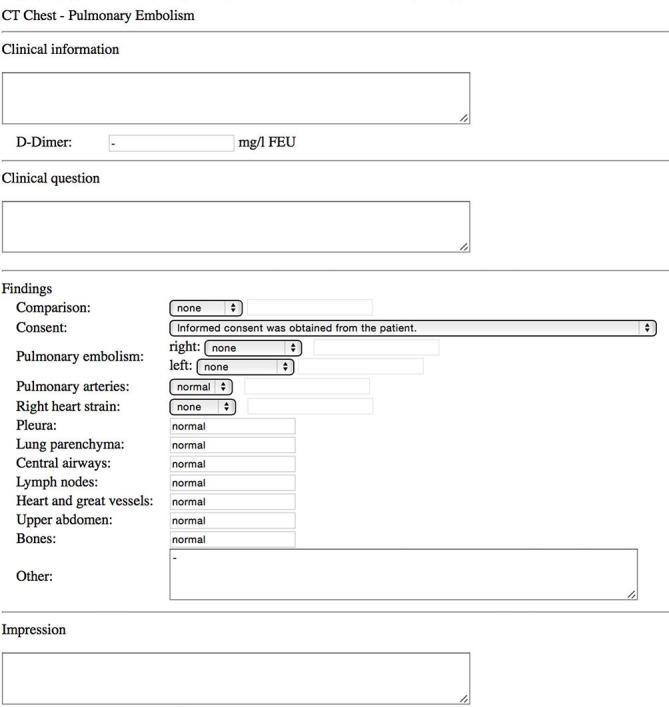
Screen capture of the template used for reporting of pulmonary embolism. The template was written in IHE-MRRT-compliant HTML5 and then imported into our reporting platform.
The reporting platform was connected to the Picture Archiving and Communication System (PACS), so that the user could start reporting using the respective template by using a simple keyboard shortcut from within the PACS viewer. The platform queried the PACS for details on the patient and the study, allowing for the structured report to be stored and linked to the correct patient and study.
An independent user transferred the conventional written reports to the SR template without reviewing the corresponding imaging study.
Data analysis
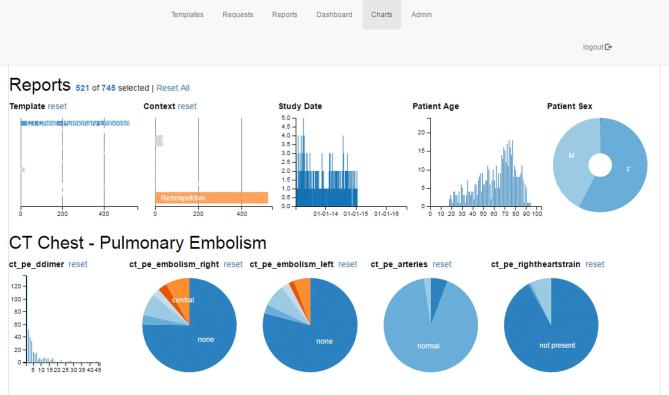
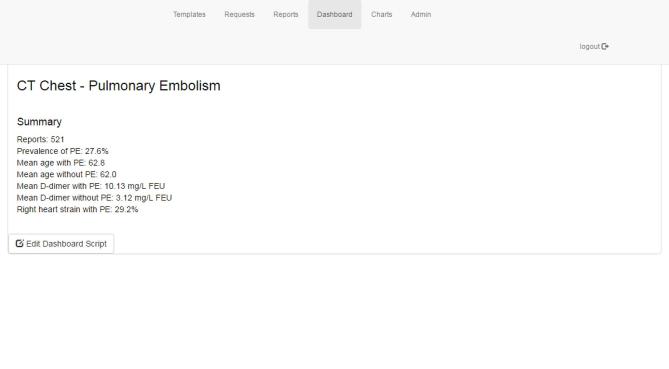
Having the values of the structured reports stored in the platform’s dedicated MySQL-database provided for an easy access on a near real-time basis. To this end, we developed some simple access methods and integrated them into the reporting platform. A simple PHP-script calculated the current prevalence of PE across all patients for which a report had been created with the respective template. The prevalence was then displayed to the user upon accessing the corresponding webpage of the platform (Figure 2) . In order to give users the option of carrying out more in-depth and graphical analyses of the reports stored in the database, we integrated a freely available dimensional charting library (https://dc-js.github.io/dc.js/) (Figure 3).
Figure 2. .
Screen capture of the results produced by the script calculating the prevalence of pulmonary embolism amongst all reports and means for different parameters.
Figure 3. .
Screen capture of the graphical analysis inside the structured reporting platform. Users were able to view results in greater detail for specific subpopulations by selecting either ranges of values for continuous variables or categories from the pie charts.
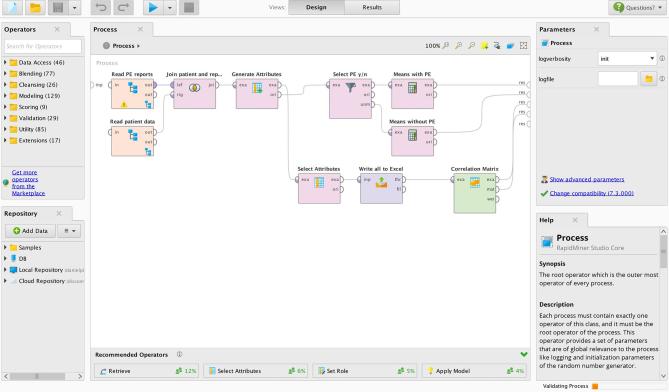
To allow for even more refined and complex analysis and a scalable platform, which would also be able to perform analyses with big data approaches, we accessed the MySQL report database directly with RapidMiner Studio 7.3 (RapidMiner, Cambridge, MA, USA). RapidMiner has been identified as one of the leading applications in advanced analytics.25 It offers an easy-to-use graphical user interface, wiki-based contextual help, and is freely available on the company’s website (https://rapidminer.com/). As we focused on laying out an example workflow, we did not try to incorporate more complex machine learning methods, but rather focused on simple correlations and operations to manipulate the data and export aggregated results (Figure 4).
Figure 4. .
Example process for analysis of the report data in RapidMiner.
RapidMiner also provided an Excel-Output function, that allowed for aggregated results to be imported into SPSS v. 22 (IBM, Armonk, NY), where statistical tests were performed. Mann–Whitney U test was used to compare distributions between groups, diagnostic performance was calculated using the receiver operating characteristic-analysis tool.
Results
Structured reporting
In total, 521 consecutive examinations were performed in the observed period and included in our work. All studies had a written report; D-dimer values were missing in 15 cases. The report template was successfully developed and imported into the reporting platform. No problems were encountered while using the template to convert the conventional written reports into structured reports. All reports mentioned the presence or absence of PE, as well as the location and extent of the emboli and the presence or absence of right heart strain. All written reports were converted into corresponding structured reports and stored in the dedicated database. Due to the retrospective design of the study, no measures on reporting performance (e.g. time to finalized report) were taken.
Data analysis
In order to illustrate the workflow steps needed to enable further analysis of the reports stored in the platform’s database, we created an example RapidMiner process (Figure 4). First, the database connection is specified. Thereafter, MySQL-queries are used to retrieve the necessary data. As patient data and report data are stored in separate tables but using consistent IDs, joining operations were needed to build a data table where the correct patient data is assigned to the respective reports. After these preparations, unneeded attributes were removed and data was piped to an Excel-Output as well as to some steps required to calculate the means for D-dimer and age as well as a correlation matrix.
The Excel-Output was configured to only contain information on D-dimer values, presence or absence of PE and right heart strain, as well as age and Digital Imaging and Communications in Medicine Study Instance UID.
The overall prevalence of PE was 27.6%. The mean age was not significantly different for patients with PE (62.8 years) and without PE (62.0 years) (p = 0.987). However, as expected, there were significant differences in mean D-dimer values across both groups [10.13 vs 3.12 mg l−1 fibrinogen equivalent units, p < 0.001]. The usually applied D-dimer cut-off value of below 0.50 mg l−1 fibrinogen equivalent units yielded a negative-predictive value of 100% with a sensitivity of 100% and a specificity of 5.5%. Of those cases with confirmed PE, right heart strain was suspected in 29.2%.
All of these statistics were also visible and calculated in near real-time on the platform. Each newly generated report led to updated calculations and updated charts on the visualization page (Figure 3).
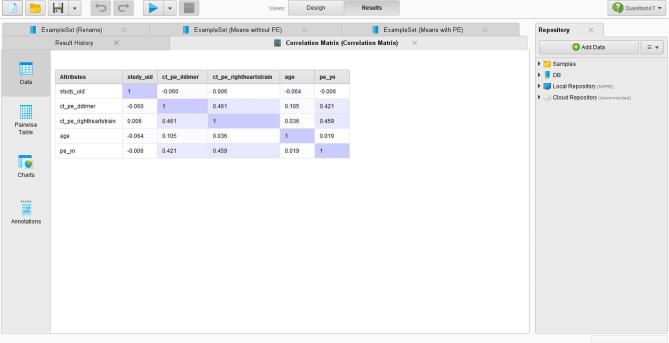
The correlation matrix revealed similar results as the statistical analysis (Figure 5). There was no correlation between age and any other parameter, whereas the presence of PE was correlated with the D-dimer value and the presence of right heart strain.
Figure 5. .
Correlation matrix for various parameters as outputted in RapidMiner.
Discussion
Today, radiology plays a key role in the work-up of most patients, not only with suspected PE, but also with a variety of other medical conditions. It is, therefore, a central junction at which clinical data converge and, together with the results of the imaging study, could be made accessible for further analysis. In our work, we present a scalable workflow where epidemiological and other parameters could be calculated using only freely available tools in an exemplified scenario of PE. We hope this work encourages radiologists to push for the implementation of SR in clinical routine, as its benefits become more and more evident and technology more and more available.
With respect to PE, multiple attempts have been made to improve the performance of prediction models and scores, which then, in turn, could help improve patient safety and management, avoid unnecessary radiation exposure and reduce healthcare costs. Today, two of the most important predictors considered for PE are D-dimer levels and Wells’ criteria.26–28 Post-test mortality risk prediction is also being examined, mostly focusing on the Pulmonary Embolism Severity Score and the assessment of right ventricular dysfunction.29, 30 A significant number of these studies has been performed retrospectively, and included only a limited number of patients. However, in order to increase the performance of prediction models, the largest possible number of patients should be included—ideally, all patients examined in clinical routine.2, 31
The conventional prose-like reports do not allow for easy access to the information on whether or not a certain pathology is present. This holds especially true when considering very large numbers of reports, where automated data extraction is needed. Data extraction from radiological reports, can either be performed using natural language processing (NLP) to analyze the conventional free-text reports produced by the radiologists or by means of SR. Although NLP tools have substantially improved over the past years, the a priori approach using SR seems easier to implement and integrate than the a posteriori approach using NLP.32 Moreover, SR provides the radiologist with a set of relevant items to be reported for the study being read. Even though SR does not alter the clinical management of patients with PE, there is considerable evidence that reports generated in a structured and standardized way contain more relevant information and help clinicians to make more confident decisions for further patient management.13, 14,33 Free-text reports, on the other hand, often do not contain certain potentially relevant information. Therefore, NLP systems, even as powerful ones as IBM’s Watson, would miss those aspects. Our method fulfills these requirements while also considering the fact that all major radiological societies promote the use of SR in clinical routine.
IHE-MRRT-compliant templates allow for easy modifications to tailor the templates to the local needs of different institutions. However, as long as the identifiers of the individual template fields remain consistent, data from different institutions should be easily comparable. Another method could be the implementation of RADLEX-terms in the template, which the MRRT profile explicitly encourages.18, 34
Our work has some notable limitations. First of all, the IHE MRRT profile is still “trial implementation” and could potentially be significantly modified in the process of publication. Also, it needs to be noted that the reporting platform used in our work is still a prototype and not completely ready for widespread use in clinical routine. However, once major vendors provide commercial solutions for SR, it can be expected that the same possibilities for analysis of the report data will be available. Secondly, our work did not aim at providing an improved prediction model for patients with PE but was intended to provide a proof of concept for the proposed workflow. Although it seems highly likely that developing and improving prediction models could be facilitated by the use of SR, further studies are needed to prove this. Thirdly, we did not evaluate the potential implications of SR on clinical routine. There is some controversy in the literature with regards to the impact of SR on time needed to finalize the radiological report. While some studies suggest that more time is needed to finalize a report using SR, others showed no significant difference.35, 36
The proposed workflow uses only freely available software and should easily scale to handle larger amount of data. In our example, we included the D-dimer values into the radiological reporting template, but a direct integration of data sources from other databases should also be possible. A wider range of variables integrated in the analysis could potentially help discovering new parameters that allow for a more accurate prediction of the presence or absence of PE and of the patient’s outcome. Such a setup would transform clinical routine in radiology into a sort of ongoing data collection and make retrospective analyses much easier than today, thus enabling radiology to play a key role in helping to improve patient care.
For such possibilities to be available in clinical routine radiologists should on one hand urge vendors to provide practical solutions able to integrate vendor-neutral reporting templates into their radiology information system and PACS platforms. On the other hand, radiologists and radiological societies should continue their efforts to collect and provide quality assured reporting templates that could define standard of care and help encourage vendors to develop corresponding tools.
Take-Home Points
The integration of a complex workflow for epidemiological research into clinical practice is feasible using freely available tools and SR.
Such workflow allows for near real-time calculation of epidemiological statistics and correlations.
Aggregated results can be exported and would potentially allow for comparisons across department borders.
Radiologists should push to implement SR in clinical routine.
Footnotes
Acknowledgements: The authors thank Ms Adriana Calabrese for her help in preparing and proof-reading the manuscript.
Contributor Information
Daniel Pinto dos Santos, Email: daniel.pinto-dos-santos@uk-koeln.de.
Sonja Scheibl, Email: sscheibl@students.uni-mainz.de.
Gordon Arnhold, Email: gordon.arnhold@unimedizin-mainz.de.
Aline Maehringer-Kunz, Email: aline.maehringer-kunz@unimedizin-mainz.de.
Christoph Düber, Email: christoph.dueber@unimedizin-mainz.de.
Peter Mildenberger, Email: peter.mildenberger@unimedizin-mainz.de.
Roman Kloeckner, Email: roman.kloeckner@unimedizin-mainz.de.
REFERENCES
- 1.Goldhaber SZ, Bounameaux H. Pulmonary embolism and deep vein thrombosis. The Lancet 2012; 379: 1835–46. doi: 10.1016/S0140-6736(11)61904-1 [DOI] [PubMed] [Google Scholar]
- 2.Konstantinides SV, Torbicki A, Agnelli G, Danchin N, Fitzmaurice D, Galiè N. ESC guidelines on the diagnosis and management of acute pulmonary embolism : European heart journal. Vol. 35 Oxford: The British Institute of Radiology.; 2014. 3033–69–3069a–3069k. [DOI] [PubMed] [Google Scholar]
- 3.Raja AS, Ip IK, Dunne RM, Schuur JD, Mills AM, Khorasani R. Effects of performance feedback reports on adherence to evidence-based guidelines in use of CT for evaluation of pulmonary embolism in the emergency department: a randomized trial. American Journal of Roentgenology 2015; 205: 936–40. doi: 10.2214/AJR.15.14677 [DOI] [PubMed] [Google Scholar]
- 4.Zhang LJ, Lu GM, Meinel FG, McQuiston AD, Ravenel JG, Schoepf UJ. Computed tomography of acute pulmonary embolism: state-of-the-art. Eur Radiol 2015; 25: 2547–57. doi: 10.1007/s00330-015-3679-2 [DOI] [PubMed] [Google Scholar]
- 5.Hutchinson BD, Navin P, Marom EM, Truong MT, Bruzzi JF. Overdiagnosis of pulmonary embolism by pulmonary CT angiography. AJR Am J Roentgenol 2015; 205: 271–7. doi: 10.2214/AJR.14.13938 [DOI] [PubMed] [Google Scholar]
- 6.Hall FM. The radiology report of the future. Radiology 2009; 251: 313–6. doi: 10.1148/radiol.2512090177 [DOI] [PubMed] [Google Scholar]
- 7.Bosmans JML, Neri E, Ratib O, Kahn CE. Structured reporting: a fusion reactor hungry for fuel. Insights Imaging 2015; 6: 129–32. doi: 10.1007/s13244-014-0368-7 [DOI] [PMC free article] [PubMed] [Google Scholar]
- 8.Faggioni L, Coppola F, Ferrari R, Neri E, Regge D. Usage of structured reporting in radiological practice: results from an Italian online survey. Eur Radiol 2017; 27: 1934–43. doi: 10.1007/s00330-016-4553-6 [DOI] [PubMed] [Google Scholar]
- 9.Bosmans JML, Weyler JJ, De Schepper AM, Parizel PM. The radiology report as seen by radiologists and referring clinicians: results of the COVER and ROVER surveys. Radiology 2011; 259: 184–95. doi: 10.1148/radiol.10101045 [DOI] [PubMed] [Google Scholar]
- 10.Schwartz LH, Panicek DM, Berk AR, Li Y, Hricak H. Improving communication of diagnostic radiology findings through structured reporting. Radiology 2011; 260: 174–81. doi: 10.1148/radiol.11101913 [DOI] [PMC free article] [PubMed] [Google Scholar]
- 11.Larson DB, Towbin AJ, Pryor RM, Donnelly LF. Improving consistency in radiology reporting through the use of department-wide standardized structured reporting. Radiology 2013; 267: 240–50. doi: 10.1148/radiol.12121502 [DOI] [PubMed] [Google Scholar]
- 12.Sahni VA, Silveira PC, Sainani NI, Khorasani R. Impact of a structured report template on the quality of MRI reports for rectal cancer staging. AJR Am J Roentgenol 2015; 205: 584–8. doi: 10.2214/AJR.14.14053 [DOI] [PubMed] [Google Scholar]
- 13.Brook OR, Brook A, Vollmer CM, Kent TS, Sanchez N, Pedrosa I. Structured reporting of multiphasic CT for pancreatic cancer: potential effect on staging and surgical planning. Radiology 2015; 274: 464–72. doi: 10.1148/radiol.14140206 [DOI] [PubMed] [Google Scholar]
- 14.Sabel BO, Plum JL, Kneidinger N, Leuschner G, Koletzko L, Raziorrouh B, et al. . Structured reporting of CT examinations in acute pulmonary embolism. J Cardiovasc Comput Tomogr 2017; 11: 188–95. doi: 10.1016/j.jcct.2017.02.008 [DOI] [PubMed] [Google Scholar]
- 15.Durack JC. The value proposition of structured reporting in interventional radiology. AJR Am J Roentgenol 2014; 203: 734–8. doi: 10.2214/AJR.14.13112 [DOI] [PubMed] [Google Scholar]
- 16.Morgan TA, Helibrun ME, Kahn CE. Reporting initiative of the radiological society of North America: progress and new directions. Radiology 2014; 273: 642–5. doi: 10.1148/radiol.14141227 [DOI] [PubMed] [Google Scholar]
- 17.European Society of Radiology (ESR). Good practice for radiological reporting. Guidelines from the European Society of Radiology (ESR). Insights Imaging 2011; 2: 93–6. doi: 10.1007/s13244-011-0066-7 [DOI] [PMC free article] [PubMed] [Google Scholar]
- 18. IHE Radiology Technical Committee. IHE Radiology Technical Framework supplement management of radiology report templates (MRRT). Oak Brook, IL: The British Institute of Radiology.; 2017. 1–51. [Google Scholar]
- 19.Pinto dos Santos D, Klos G, Kloeckner R, Oberle R, Dueber C, Mildenberger P. Development of an IHE MRRT-compliant open-source web-based reporting platform. Eur Radiol 2017; 27: 424–30. doi: 10.1007/s00330-016-4344-0 [DOI] [PubMed] [Google Scholar]
- 20.Landset S, Khoshgoftaar TM, Richter AN, Hasanin T. A survey of open source tools for machine learning with big data in the Hadoop ecosystem. J Big Data 2015; 2: 380. doi: 10.1186/s40537-015-0032-1 [DOI] [Google Scholar]
- 21.de Bruijne M. Machine learning approaches in medical image analysis: from detection to diagnosis. Med Image Anal 2016; 33: 94–7. doi: 10.1016/j.media.2016.06.032 [DOI] [PubMed] [Google Scholar]
- 22.Motwani M, Dey D, Berman DS, Germano G, Achenbach S, Al-Mallah MH, et al. . Machine learning for prediction of all-cause mortality in patients with suspected coronary artery disease: a 5-year multicentre prospective registry analysis. Eur Heart J 2017; 38: 500–7. doi: 10.1093/eurheartj/ehw188 [DOI] [PMC free article] [PubMed] [Google Scholar]
- 23.Prashanth R, Dutta Roy S, Mandal PK, Ghosh S. High-accuracy detection of early parkinson's disease through multimodal features and machine learning. Int J Med Inform 2016; 90: 13–21. doi: 10.1016/j.ijmedinf.2016.03.001 [DOI] [PubMed] [Google Scholar]
- 24.Wang J, Yang X, Cai H, Tan W, Jin C, Li L. Discrimination of breast cancer with microcalcifications on mammography by deep learning. Sci Rep 2016; 6: 27327. doi: 10.1038/srep27327 [DOI] [PMC free article] [PubMed] [Google Scholar]
- 25.Kart L, Herschel G, Linden A, Hare J. Magic quadrant for advanced analytics platforms [Internet]. gartner.com. 2016. Available from: https://www.gartner.com/doc/reprints?ct=160210&id=1-2YEIILW&st=sb [cited 2016 Oct 2].
- 26.Wolf SJ, McCubbin TR, Feldhaus KM, Faragher JP, Adcock DM. Prospective validation of Wells Criteria in the evaluation of patients with suspected pulmonary embolism. Ann Emerg Med 2004; 44: 503–10. doi: 10.1016/j.annemergmed.2004.04.002 [DOI] [PubMed] [Google Scholar]
- 27.Righini M, Van Es J, Den Exter PL, Roy P-M, Verschuren F, Ghuysen A, et al. . Age-adjusted D-dimer cutoff levels to rule out pulmonary embolism: the ADJUST-PE study. JAMA 2014; 311: 1117–24. doi: 10.1001/jama.2014.2135 [DOI] [PubMed] [Google Scholar]
- 28.Char S, Yoon H-C. Improving appropriate use of pulmonary computed tomography angiography by increasing the serum D-dimer threshold and assessing clinical probability. Perm J 2014; 18: 10–15. doi: 10.7812/TPP/14-007 [DOI] [PMC free article] [PubMed] [Google Scholar]
- 29.Meinel FG, Nance JW, Schoepf UJ, Hoffmann VS, Thierfelder KM, Costello P, et al. . Predictive value of computed tomography in acute pulmonary embolism: systematic review and meta-analysis. Am J Med 2015; 128: 747–59. doi: 10.1016/j.amjmed.2015.01.023 [DOI] [PubMed] [Google Scholar]
- 30.Jiménez D, et al. Simplification of the pulmonary embolism severity index for prognostication in patients with acute symptomatic pulmonary embolism. Arch Intern Med 2010; 170: 1383–9. doi: 10.1001/archinternmed.2010.199 [DOI] [PubMed] [Google Scholar]
- 31.Raja AS, Ip IK, Prevedello LM, Sodickson AD, Farkas C, Zane RD, et al. . Effect of computerized clinical decision support on the use and yield of CT pulmonary angiography in the emergency department. Radiology 2012; 262: 468–74. doi: 10.1148/radiol.11110951 [DOI] [PMC free article] [PubMed] [Google Scholar]
- 32.Pons E, Braun LMM, Hunink MGM, Kors JA. Natural language processing in radiology: a systematic review. Radiology 2016; 279: 329–43. doi: 10.1148/radiol.16142770 [DOI] [PubMed] [Google Scholar]
- 33.Nörenberg D, Sommer WH, Thasler W, DʼHaese J, Rentsch M, Kolben T, et al. . Structured reporting of rectal magnetic resonance imaging in suspected primary rectal cancer: potential benefits for surgical planning and interdisciplinary communication. Invest Radiol 2017; 52: 232–9. doi: 10.1097/RLI.0000000000000336 [DOI] [PubMed] [Google Scholar]
- 34.Hong Y, Zhang J, Heilbrun ME, Kahn CE. Analysis of RadLex coverage and term co-occurrence in radiology reporting templates. J Digit Imaging 2012; 25: 56–62. doi: 10.1007/s10278-011-9423-9 [DOI] [PMC free article] [PubMed] [Google Scholar]
- 35.Johnson AJ, Chen MYM, Swan JS, Applegate KE, Littenberg B. Cohort study of structured reporting compared with conventional dictation. Radiology 2009; 253: 74–80. doi: 10.1148/radiol.2531090138 [DOI] [PubMed] [Google Scholar]
- 36.Hanna TN, Shekhani H, Maddu K, Zhang C, Chen Z, Johnson J-O. Structured report compliance: effect on audio dictation time, report length, and total radiologist study time. Emerg Radiol 2016; 23: 449–53. doi: 10.1007/s10140-016-1418-x [DOI] [PubMed] [Google Scholar]


