Abstract
Human papillomaviruses (HPVs) are frequently integrated in HPV-associated cancers. HPV genomes can be integrated in three patterns – a single integrated HPV genome (type I), multiple, tandemly integrated HPV genomes (type II), and multiple, tandemly integrated HPV genomes interspersed with host DNA (type III). Analysis of the organization of type II and type III integration sites is complicated by their repetitive nature, as sequences of individual repeats are difficult to distinguish from each other. This unit presents a method for directly visualizing HPV integration sites using molecular combing combined with fluorescent in situ hybridization, also known as fiber-FISH. In this technique, genomic DNA is stretched across a glass coverslip and individual integrated HPV sequences are detected and directly visualized by in situ hybridization with a resolution of about 1 kb. Fiber-FISH allows comprehensive characterization of the genomic organization of HPV integration sites containing type II and type III integration.
Keywords: HPV, papillomavirus, integration, FISH, molecular combing, microscopy, fiber-FISH
INTRODUCTION
In this unit on analyzing human papillomavirus integration by molecular combing, we describe how to prepare genomic DNA with minimal mechanical damage by performing cell lysis and protein removal in agarose plugs (Basic Protocol 1), how to generate biotinylated or digoxigenin (DIG)-labeled DNA probes for fluorescent signal detection and amplification (Basic Protocol 2 and Alternate Protocol 1, respectively), and how to use a molecular combing machine to stretch thousands of DNA fibers across a glass coverslip (see Figure 1; Basic Protocol 3). To detect HPV integration sites within this stretched genomic DNA, we describe how to perform fluorescent in situ hybridization with streptavidin or DIG signal amplification (Basic Protocol 4 and Alternate Protocol 2, respectively). Finally, we describe a method for comprehensively analyzing coverslips and collecting measurement data for HPV integration sites (Basic Protocol 5).
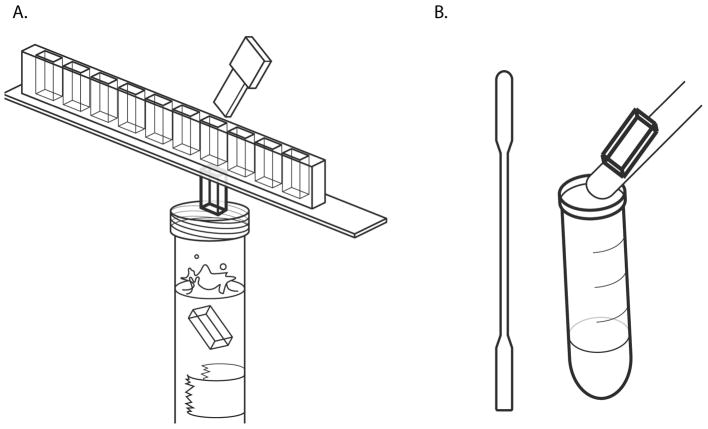
Figure 1. Molecular Combing.
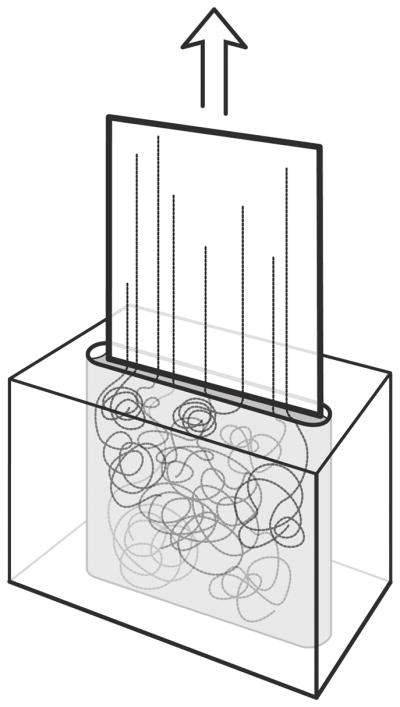
A silane-coated glass coverslip is inserted into a DNA solution in a Teflon reservoir. The ends of the DNA molecules adhere to the coverslip, and when the coverslip is slowly pulled out, the DNA molecules are pulled straight by the surface tension between the glass and the buffer the DNA is suspended in.
Basic Protocol 1: Genomic DNA Plug Preparation
Suspending cells in agarose plugs before performing cell lysis and preparing genomic DNA protects the genomic DNA from mechanical damage. Linear, protein-free DNA can be easily sheared by pipetting and even movement of its suspending liquid (Kaykov, Taillefumier, Bensimon, & Nurse, 2016). Preserving genomic DNAs integrity by suspending it in a permeable gel increases the average length of combed DNA fibers. While genomic DNA plugs are very stable at 4°C, it is important to ensure each step is DNase-free.
Materials
Mammalian cells of interest
Phosphate buffered saline (PBS)
1.5% (w/v) SeaPlaque™ Agarose (Lonza, 50100) in PBS
50-Well Disposable Plug Molds (Biorad, 1703713)
Plug lysis buffer (see recipe)
Tris-EDTA buffer (TE), pH 8.0
Centrifuge to harvest cells
Heat block at 37°C
Water bath at 45°C and 50°C
Rocker
Harvest cells and centrifuge in a 15 ml conical tube at 1000 rpm for 5 minutes to pellet. Remove media and resuspend in cold PBS to 106 cells/ml.
Dissolve 0.375 g of low melting point SeaPlaque™ Agarose in 25 ml of PBS by microwave. After agarose is completely dissolved, move solution to a 50 ml conical and add water to return the volume to 25 ml. Excess agarose can be stored at 4 °C for up to a week and re-melted with a 70 °C water bath.
Warm 1.5% SeaPlaque™ agarose in a 45°C water bath.
Warm cells to 37°C for 1 minute in a heat block. Add equal volume of 1.5% SeaPlaque™ agarose (warmed to 45°C) to cells and gently mix by tapping the conical tube.
Aliquot cell/agarose mixture to wells of plug mold, 100 μl per well. 1 million cells will prepare 20 agarose plugs.
Allow agarose plugs to solidify at 4°C for at least 20 minutes.
Eject plugs from plug mold directly into plug lysis buffer in a 15 ml conical tube (see Figure 2A), 250 μl/plug, but at least 2 ml for fewer than 10 plugs. Incubate plugs in lysis buffer in 50°C water bath for 16 hours.
Remove lysis buffer and rinse plugs with RT 15 ml TE. Use a 1000 μl pipette to carefully remove as much buffer/TE as possible. Use caution as warm agarose plugs will be fragile.
Wash agarose plugs 3 times with 15 ml TE for 1 hour at RT, gently rocking horizontally. Agarose plugs can be stored for several years in TE at 4°C.
Figure 2. Manipulating agarose plugs.
A. When genomic DNA agarose plugs have completely solidified, eject them directly into lysis buffer for overnight incubation.
B. Using a sterile flat spatula, transfer one agarose plug to a 2 ml Eppendorf tube and add 1.6 ml 0.1 M MES pH 6.5 buffer. Use caution when removing the plug from the storage conical tube so as not to damage the other plugs. For easiest removal, use the spatula to press an agarose plug against the side of the conical tube, and then slowly slide it out of the TE buffer. Slide the plug to the lip of the conical tube and push it back flat against the spatula.
Basic Protocol 2: Biotinylated Probe Synthesis
Visualizing an HPV genome within a combed DNA fiber requires detection and amplification of the fluorescence of the HPV FISH probe, with detectable size limit of 1 kb. To achieve this amplification, the probe is synthesized with biotinylated nucleotides which bind strongly to fluorescent streptavidin. Multiple layers of fluorescent streptavidin branching from this biotinylated HPV probe are easily detected with epifluorescence and confocal microscopy.
Materials
HPV genome DNA: can be obtained from the HPV Reference Center (https://ki.se/en/labmed/international-hpv-reference-center)
Standard maxiprep kit (e.g., Qiagen or Zymo)
Standard gel extraction kit (e.g., Qiagen or Zymo)
BioPrime® DNA Labeling System (Invitrogen, 18094011)
QIAquick PCR Purification Kit (Qiagen, 28104)
Water bath at 37°C
Prepare plasmid DNA containing your HPV genome of choice using a standard maxiprep kit (e.g., Qiagen or Zymo). Digest plasmid DNA with the appropriate restriction enzymes to remove the inserted HPV genome from the bacterial vector. Separate HPV genome and bacterial vector in an agarose gel and purify the viral DNA fragment with a standard gel extraction kit (e.g., Qiagen or Zymo).
Label 500 ng of purified HPV DNA with the BioPrime® DNA Labeling System according to the manufacturer’s instructions. Incubation in a 37°C water bath for at least 1 hour, but for up to 5 hours for greater probe amplification.
Purify biotinylated probe with QIAquick PCR Purification Kit, according to manufacturer’s instructions.
Alternate Protocol 1: DIG Labeled Probe Synthesis
Two-color fiber-FISH allows a detailed analysis of HPV integration sites, through either visualization of two regions of the HPV genome, or visualization of integrated HPV genomes and surrounding host DNA. Visualization of fiber-FISH probes requires amplification of the fluorescent signal, which we enable in Basic Protocol 2 by labeling our FISH probe with biotinylated nucleotides. Two-color fiber-FISH requires two separate means of amplification, which we achieve here by labeling the second probe with digoxigenin (DIG). DIG does not have a strong and specific binding partner as biotin and streptavidin, but it is sufficient to amplify a second fluorescent signal as described in Alternate Protocol 2.
An important consideration for two-color fiber-FISH is that the DIG probe fluorescence is weaker than the biotin probe fluorescence. When selecting which sequence to label with biotin vs. DIG, consider the size and utility of the sequences. The stronger biotin signal should be used with sequences you intend to directly quantitate, and longer sequences will be more easily detected with the weaker DIG signal.
Materials
DNA to be labeled (Viral DNA fragments or flanking host DNA)
BioPrime® DNA Labeling System (Invitrogen, 18094011)
DIG DNA Labeling Mix (Sigma-Aldrich, 11277065910)
QIAquick PCR Purification Kit (Qiagen, 28104)
Water bath at 37°C
Prepare your DNA of choice. To visualize two different regions of the HPV genome, perform HPV plasmid preparation (see Basic Protocol 2), further digest with restriction enzymes and gel purify to separate your HPV genome regions of choice. To visualize a human gene or sequence, obtain a BAC clone with your human DNA of choice by restriction digest and gel purification, or amplify by PCR with appropriate primers and a standard PCR kit.
Replace the 10X dNTP (biotin) Mix of the BioPrime® DNA Labeling System with 10X DIG DNA Labeling Mix. The other BioPrime® kit components will remain the same.
Label and amplify 500 ng of your purified DNA of choice with BioPrime® DNA Labeling System and DIG DNA Labeling Mix, incubating in a 37°C water bath for at least 1 hour, but up to 5 hours for greater probe amplification.
Purify DIG labeled probe with QIAquick PCR Purification Kit.
Basic Protocol 3: Molecular Combing of Genomic DNA
After melting and digestion of cells in the agarose plug, the genomic DNA is free in suspension and fragile. Use caution when manipulating the genomic DNA solution to reduce shearing. It is important to comb a test coverslip to ensure the DNA was not degraded and the agarose was fully digested. Undigested agarose reduces the amount of DNA in solution and induces clumps across the glass.
For uniform, high-density fibers, a molecular combing machine is required. While some labs use house-made or commissioned machines that precisely comb at 300 μm/second, commercial machines are also available from companies such as Genomic Vision.
Materials
Agarose plug containing genomic DNA (Basic Protocol 1)
2 ml Eppendorf tubes
Sterile flat spatula
0.1 M MES (2-(N-morpholino)ethanesulfonic acid), pH 6.5
β-Agarase I (New England BioLabs, M0392S)
Teflon reservoir (supplied with molecular combing machine)
Silane-coated 22×22 mm coverslips (MicroSurfaces)
Glass microscope slides
2:10,000 YOYO-1 (ThermoFisher, Y3601) in 0.1 M MES, pH 6.5
SlowFade™ Gold Antifade Mountant (ThermoFisher, S36940)
Cyanoacrylate glue
Molecular combing machine (in-house, Genomic Vision)
Water bath at 42°C and 70°C
Epifluorescent microscope
Oven at 60 °C
Transfer one agarose plug to a 2 ml Eppendorf tube using a sterile flat spatula (see Figure 2B) and add 1.6 ml 0.1 M MES pH 6.5 buffer.
Place the 2 ml Eppendorf tube in a 70°C heat block for 20 minutes to melt the agarose plug.
Cool melted plug for 5 minutes in a 42°C water bath.
Add 3 μl (3 units) of β-agarase and tap to gently mix (do not pipette). Incubate in a 42°C water bath for 16 hours.
Carefully pour DNA solution into a 2 ml Teflon reservoir.
Using a molecular combing machine, insert a silane-coated coverslip into DNA solution and incubate for 1 minute.
When the molecular combing machine has pulled the coverslip from the reservoir, carefully remove the coverslip and transfer into YOYO-1 solution. Incubate coverslip in YOYO-1 for a few seconds in the dark.
Place a small drop of SlowFade™ Gold onto a clean microscope slide, remove the coverslip from the YOYO-1 solution with forceps, and place the silane-coated side down onto the mountant.
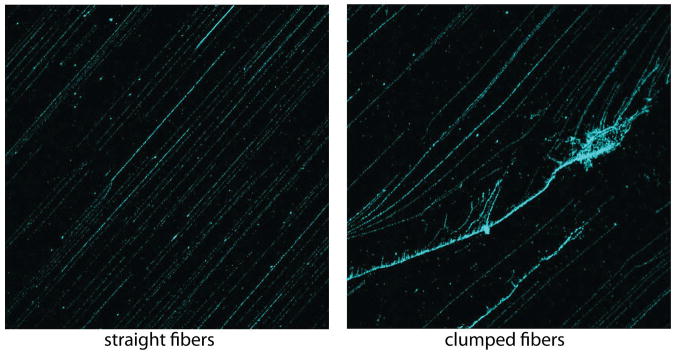
Check DNA fibers with an epifluorescence microscope, ensuring that DNA fibers are straight and not clumped (see Figure 3). This is a test coverslip and will not be used further.
If DNA fibers are of good quality, insert a silane-coated coverslip into DNA solution and incubate for 1 to 10 minutes. In general, a 5 minute incubation is sufficient for newly prepared genomic DNA, increasing to 10 minutes after DNA solution has been used to comb several coverslips.
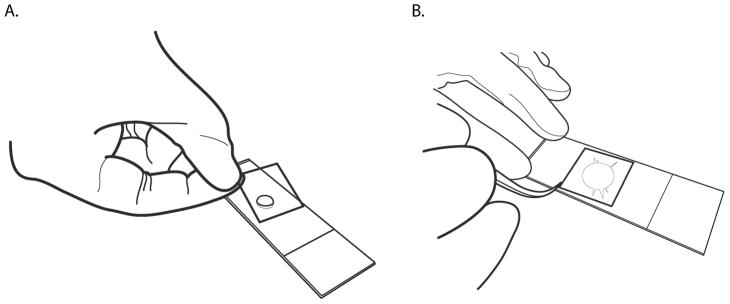
Remove coverslip, place a small dot of cyanoacrylate glue on a glass slide, and quickly place the coverslip, silane-coating side (with DNA) up, onto the glue (see Figure 4A).
Straighten the coverslip with forceps, as needed, as quickly as possible, as the cyanoacrylate glue rapidly dries (see Figure 4B). Use a very small volume of glue to adhere the coverslip to prevent excess glue from pooling along the edge of the coverslip. Dry, pooled glue will prevent a top coverslip from sitting neatly on the silane-coated coverslip, reducing the area of fiber detection. If glue does pool and dry around the coverslip, it can be removed by carefully dabbing with a cotton swab soaked in acetone.
Repeat to prepare as many coverslips as desired.
Bake slides for 30 minutes at 60 °C to crosslink DNA fibers to coverslips.
Proceed immediately to denaturation and hybridization. Baked fibers are likely not very stable and thus for ideal fiber detection, hybridization should occur on the same day as combing.
Figure 3. Straight and clumped fibers.
Examples of high-quality straight fibers (left panel) and non-usable clumped fibers (right panel).
Figure 4. Gluing the fiber coverslip to a microscope slide.
A. When the coverslip has been fully removed from the genomic DNA solution, place a small drop of cyanoacrylate glue on a microscope slide, remove the coverslip from the molecular combing machine, and quickly place the coverslip on top of the glue, silane coating side up. Use as little glue as possible and work quickly as the glue rapidly dries.
B. For ease of scanning, it is important to have the coverslip as aligned with the microscope slide as possible. If the coverslip is skewed when placed on the glue, quickly adjust with forceps. As the cyanoacrylate glue spreads underneath the coverslip it rapidly dries, affording only a few seconds to make adjustments.
Basic Protocol 4: HPV Fiber-FISH
Visualizing individual HPV genomes in DNA fibers by microscopy requires the amplification of the fluorescent signal of the FISH probe. The backbone of the DNA fibers is visualized with a single stranded DNA antibody and a single layer of fluorescence, resulting in a weak signal. While this is sufficient for a counterstain, the FISH signal of the biotinylated HPV probe from Basic Protocol 2 must be amplified with three layers of fluorescent streptavidin. This FISH signal amplification results in a strong, crisp signal that is excellent for image collection and length quantitation.
Materials
Shaker
Coplin jars
0.2 M NaOH
70%, 90%, 100% EtOH
22×22 mm, #1.5 glass coverslips
Hybridization buffer (see recipe)
Human Cot-1 DNA (ThermoFisher, 15279011)
Biotinylated HPV probe (Basic Protocol 2)
Rubber cement (e.g., Elmer’s)
2× SSC
2× SSC/50% formamide (deionized, ThermoFisher, AM9342)
5% BSA in PBS (BSA/PBS) (IgG- and protease-free, Jackson Immunoresearch, 001-000-162)
Biotinylated anti-streptavidin antibody (Vector Laboratories, BA-0500)
Streptavidin, Alexa Fluor® 488 conjugate (ThermoFisher, S11223)
Mouse anti-DNA antibody, single stranded, clone 16–19, IgG2a (EMD Millipore, MAB3034)
Goat anti-mouse IgG2a Cross-Adsorbed secondary antibody, Alexa Fluor® 647 (Invitrogen, A-21241)
0.1% Triton X-100 in PBS (PBS-T)
PBS
ProLong® Gold Antifade Mountant (ThermoFisher, P36930)
ThermoBrite® Slide Denaturation and Hybridization System and Slide Warmer (Leica)
Place slides with baked fiber coverslips from Basic Protocol 3 in a coplin jar and denature DNA fibers for 20 minutes in 0.2 M NaOH.
Remove NaOH from coplin jar and neutralize slides 5 times with 1×PBS for 1 minute, gently shaking.
Dehydrate slides in successive baths of 70%, 90%, and 100% EtOH, 3 minutes each. Air dry slides horizontal on a paper towel for at least 8 minutes.
Mix 300–500 ng in 2 μl of biotinylated HPV probe, 1 μl of human Cot-1 DNA, 1 μl of H2O, and 16 μl hybridization buffer up to a total volume of 20 μl per coverslip. If probe concentration is less than 150 ng/μl, omit H2O and replace the volume with probe up to a total volume of 20 μl.
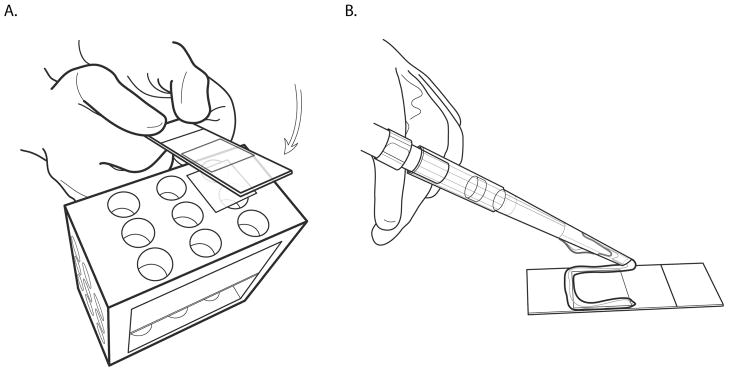
Add probe mixture to a clean 22×22 coverslip, and carefully lower the fiber coverslip on top (see Figure 5A). The capillary action of the probe mix should hold the top coverslip onto the fiber coverslip.
Seal around the edges with rubber cement using a 1000 μl pipette with a centimeter cut from the bottom of the tip (see Figure 5B).
Place sealed slides on ThermoBrite® slide warmer (Leica) and denature at 75°C for 5 minutes.
Incubate slides at 37°C for at least 16 hours.
Remove rubber cement and top coverslips with forceps. Rubber cement should peel easily, and any residual cement can be lifted with the wad of rubber cement that has already been removed.
Rinse slides with 2×SSC in a coplin jar.
Wash slides 3 times for 5 minutes with 2× SSC/50% formamide, gently shaking.
Wash slides 3 times for 5 minutes with 2× SSC, gently shaking.
Add 20 μL of 5% BSA/PBS to a clean coverslip and lay the fiber coverslip on top (see Figure 5A) and incubate for 10 minutes in a humidified chamber.
-
Remove coverslips by carefully flicking the slide (see Figure 6) and proceed to amplification layers. The following layers are all performed at 37°C in a humidified chamber, with 20 μl of mixture held on the silane-coated coverslip by the capillary action of a clean coverslip placed on top. After each layer, top coverslips are removed by flicking, and slides are washed 3 times with PBS-T for 5 minutes, gently shaking.
Layer 1 (30 minutes): 1:50 streptavidin, Alexa Fluor® 488 conjugate, in 5% BSA/PBS.
Layer 2 (1 hour): 1:200 biotinylated anti-streptavidin in 5% BSA/PBS.
Layer 3 (30 minutes): 1:200 streptavidin, Alexa Fluor® 488 conjugate, in 5% BSA/PBS.
Layer 4 (1 hour): 1:100 biotinylated anti-streptavidin, 1:200 mouse anti-ssDNA IgG2a, in 5% BSA/PBS.
Layer 5 (45 minutes): 1:200 streptavidin, Alexa Fluor® 488 conjugate, 1:100 goat anti-IgG2a mouse, Alexa Fluor® 647 conjugate, in 5% BSA/PBS.
Rinse slides with 1×PBS
Mount slides with 15 μL ProLong® Gold using a clean coverslip on top. Allow mountant to cure for at least 16 hours.
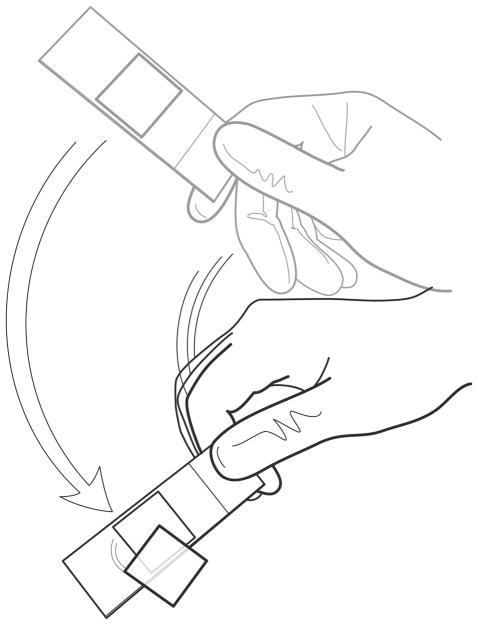
Figure 5. Placing and sealing a top coverslip over the fiber-containing coverslip.
A. Hybridization, blocking, and streptavidin/antibody incubations are all performed with a top coverslip overtop the fiber coverslip. To ensure the solution has been evenly wicked across the fiber coverslip, solutions are added to a clean coverslip and, by holding the bottom of the slide, the fiber coverslip is tapped on top.
B. Sealing the fiber coverslip and top coverslip with rubber cement allows hybridization to be performed on a slide warmer rather than in a humid chamber. Use fresh rubber cement and cut a centimeter off the tip of a 1000 μl pipette tip for ease of pipetting. Excess rubber cement is not detrimental, but only a fine ribbon of cement is needed to completely seal the coverslips.
Figure 6. Removing the top coverslip.
20 μl is an excessive volume for mounting 22×22 mm coverslips, so the top coverslip should be easily removed by flicking the slide. If the top coverslip does not readily slide off the fiber coverslip, place the microscope slide in a container with enough volume of 2×SSC (after hybridization) or PBS-T (after an amplification layer) to cover the slide and gently shake the slide until the top coverslip floats off.
Alternate Protocol 2: Two-Color Fiber-FISH
Two-color fiber-FISH allows two known sequences to be visualized within the same coverslip of linearized DNA fibers. Amplification of two different FISH probes is achieved by labeling one probe with biotin, which is visualized with three layers of fluorescent streptavidin, and the other probe with digoxigenin, which is visualized with two layers of fluorescent secondary antibodies.
The two layers of fluorescent antibodies used to amplify the DIG probe are not very strong but are sufficient to visualize the probe. Given this, it is not recommended to quantitate the length of the DIG probe signal, instead using it primarily qualitatively. The probe that is to be measured quantitatively must have a robust signal and thus should be labeled with biotin.
We have experienced precipitation of the DIG probe using our in-house hybridization buffer and have had much better success with the commercial hybridization buffer from Empire Genomics.
Materials
Shaker
Coplin jars
0.2 M NaOH
70%, 90%, 100% EtOH
22×22 mm glass coverslips
Hybridization buffer (Empire Genomics, Hyb-Buffer)
Human Cot-1 DNA (ThermoFisher, 15279011)
Biotinylated FISH probe (Basic Protocol 2)
DIG labeled FISH probe (Alternate Protocol 1)
Rubber cement
2× SSC
2× SSC/50% formamide (deionized, ThermoFisher, AM9342)
5% BSA in PBS (BSA/PBS)
Biotinylated anti-streptavidin antibody (Vector Laboratories, BA-0500)
Streptavidin, Alexa Fluor® 555 conjugate (ThermoFisher, S32355)
Sheep anti-Digoxigenin, FITC conjugated antibody (Sigma-Aldrich, 11333089001)
Rabbit anti-FITC antibody (Invitrogen, 71–1900)
Goat anti-rabbit, FITC conjugated secondary antibody (Rockland, 611-102-122)
Mouse anti-DNA antibody, single stranded, clone 16–19, IgG2a (EMD Millipore, MAB3034)
Goat anti-mouse IgG2a Cross-Adsorbed secondary antibody, Alexa Fluor® 647 (Invitrogen, A-21241)
0.1% Triton X-100 in PBS (PBS-T)
PBS
ProLong® Gold Antifade Mountant (ThermoFisher, P36930)
ThermoBrite® slide warmer (Leica)
Place slides with baked fiber coverslips in a coplin jar and denature DNA fibers for 20 minutes in 0.2 M NaOH.
Remove NaOH from coplin jar and neutralize slides 5 times with 1×PBS for 1 minute, gently shaking.
Dehydrate slides in successive baths of 70%, 90%, and 100% EtOH, 3 minutes each. Air dry slides for at least 8 minutes.
Mix 200–600 ng of biotinylated probe, 200–600 ng DIG-labeled probe, 1 μl of human Cot-1 DNA, 16 μl of hybridization buffer (Empire Genomics) and H2O to a total volume of 20 μL. Try to use equal probe quantities if you have multiple probes of various lengths.
Add probe mixture to a clean 22×22 coverslip, and carefully lay the fiber coverslip on top (see Figure 5A). The capillary action of the probe mix should hold the top coverslip onto the fiber coverslip.
Seal around the edges with rubber cement using a 1000 μl pipette with a centimeter cut from the bottom of the tip (see Figure 5B).
Place sealed slides on ThermoBrite® slide warmer (Leica) and denature at 75°C for 5 minutes.
Incubate slides at 37°C for at least 16 hours.
Remove rubber cement and top coverslips and rinse slides with 2×SSC.
Wash slides 3 times for 5 minutes with 2× SSC/50% formamide, gently shaking.
Wash slides 3 times for 5 minutes with 2× SSC, gently shaking.
Add 20 μL of 5% BSA/PBS to coverslips, add clean coverslips on top, and block for 10 minutes in a humidified chamber.
-
Remove coverslips by carefully flicking the slide (see Figure 6) and proceed to amplification layers. The following layers are all performed at 37°C in a humidified chamber, with 20 μl of mixture held on the silane-coated coverslip by the capillary action of a clean coverslip placed on top. After each layer, top coverslips are removed by flicking, and slides are washed 3 times with PBS-T for 5 minutes, gently shaking.
Layer 1 (1 hour): 1:100 streptavidin, Alexa Fluor® 555 conjugate, 1:100 sheep anti-DIG, FITC conjugated, in 5% BSA/PBS.
Layer 2 (45 minutes): 1:200 biotinylated anti-streptavidin, 1:200 rabbit anti-FITC antibody, in 5% BSA/PBS.
Layer 3 (30 minutes): 1:200 streptavidin, Alexa Fluor® 555 conjugate, in 5% BSA/PBS.
Layer 4 (45 minutes): 1:200 biotinylated anti-streptavidin, 1:200 goat anti-rabbit, FITC conjugated, 1:200 mouse anti-ssDNA IgG2a, in 5% BSA/PBS.
Layer 5 (45 minutes): 1:200 streptavidin, Alexa Fluor® 555 conjugate, 1:100 goat anti-IgG2a mouse, Alexa Fluor 647® conjugate, in 5% BSA/PBS.
Rinse slides with 1×PBS
Mount slides with 15 μL ProLong® Gold and clean coverslips. Allow mountant to cure for at least 16 hours.
Basic Protocol 5: Image Collection and Fiber Measurements
Although time consuming, visually scanning the entire coverslip is the only way to ensure every combed integration site has been imaged. The number of integration sites imaged will depend on the fiber density of the coverslip, as well as the size of the integration site (due to integrated HPV copy number and any host DNA co-amplification). The average length of a combed DNA fiber for this method typically ranges between 300 and 700 kb, with occasional fibers over 1 Mb. For large, >1 Mb, integration sites, the likelihood of combing a complete fiber is low, and instead smaller fractions of these sites will be imaged at a greater frequency than complete integration sites. For small, <100 kb, integration sites, most fibers will contain the complete site, and the incidence across the coverslip will depend on the density of fibers.
If collecting integration site images with confocal microscope software, the pixel to micrometer conversion will be automatically collected with the metadata of the scan. Confocal image processing software such as Imaris will access the metadata and display distances within the image in micrometers, allowing easy conversion from pixel to micrometer to base pair.
For integration site images collected with an epifluorescence microscope and a camera, an ImageJ script specific for your objective and zoom will be required to convert pixel distance to micrometers.
Materials
Confocal microscope or Epifluorescence microscope with camera
Imaris (Bitplane) or ImageJ (https://imagej.nih.gov/ij/)
Using the eyepiece, start at one corner of the coverslip and slowly, visually scan along the edge of the coverslip to the opposite corner.
-
Move the stage perpendicular to the scan direction a distance about the diameter of the field of view. For a 63× objective, this is about 300 μm.
For faster scanning, it is useful to find a point of reference in the field of view and move the stage perpendicularly until the point of reference has moved to the opposite side of the field of view. For example, if scanning in the X direction and you need to move the stage in the positive Y direction, find a point of reference at the top of the field of view and move the stage in the Y direction until the point of reference is at the bottom of the field of view.
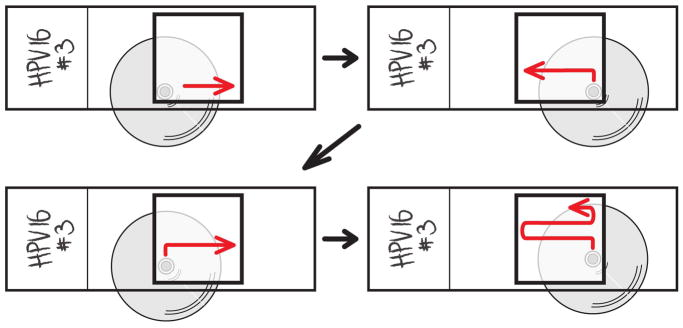
Slowly scan back toward the opposite edge of the coverslip (see Figure 7).
Repeat, scanning back and forth, until the entire coverslip has been covered.
When an HPV integration site is located, collect an image. With a 63× objective, a 4X zoom at 50–100 nm per pixel is sufficient resolution for measuring signal lengths. For longer integration sites, rotate the scan field so that the fiber stretches across the hypotenuse of the scan.
-
If collecting with a confocal microscope, analyze raw fiber images using Imaris software (or similar).
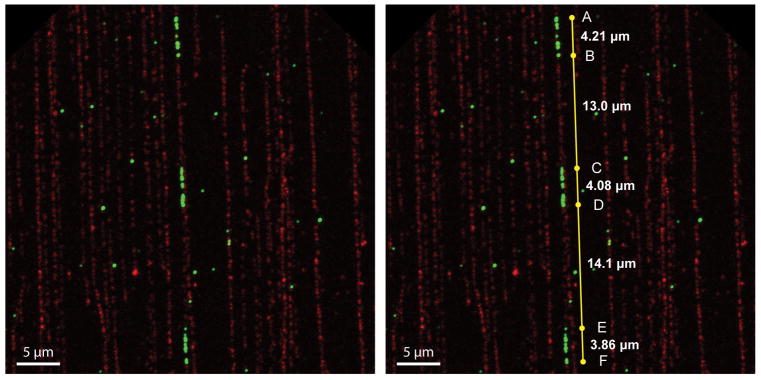
Measure lengths of HPV integration signals using Measurement Points by placing a Measurement Point at the start and end of fluorescent HPV signal. Imaris will measure the distance between points in micrometers.
For multiple, separate integration signals continuous in a single fiber, use one string of Measurement Points to measure the distance between HPV integration signals (see Figure 8).
Convert micrometer length to base pairs using the conversion 1 μm = 2 kb (Michalet et al., 1997).
Figure 7. Comprehensively scanning the coverslip.
Scanning back and forth across the coverslip in a systematic fashion is the only way to ensure that every integration site across the coverslip has been imaged.
Figure 8. Using Measurement Points in Imaris.
Imaris automatically accesses the pixel to micrometer conversion of confocal microscope scans and will display the distance between two points across your scan in micrometers. The Measurement Points tool in Surpass can place a string of points between which the micrometer distance is displayed, which is especially useful for measuring the length of interspersing host DNA in type III integration sites.
REAGENTS AND SOLUTIONS
Plug lysis buffer
1 mg/ml proteinase K (added fresh directly before use) (ThermoFisher, 25530-049)
100 mM EDTA, pH 8.0
1% N-lauroylsarcosine (Sigma, L9150)
10 mM Tris-HCl, pH 8.0
Make fresh for each use
Hybridization buffer
50% formamide (deionized, ThermoFisher, AM9342)
2× SSC
0.5% SDS
0.5% N-lauroylsarcosine (Sigma, L9150)
1% Blocking reagent (Roche, 11096176001)
10 mM NaCl
Store at 4 °C for up to a year
Background
Human papillomaviruses (HPVs) have small, double stranded, circular DNA genomes approximately 7–8 kb in size. HPV genomes typically exist as circular extrachromosomal elements within infected nuclei but can accidentally integrate into host chromosomes (McBride & Warburton, 2017). Fluorescent in situ hybridization (FISH) is a common technique for visualizing and localizing HPV DNA within HPV-infected cells cultured in vitro, and in tissue sections. Interphase-FISH has a resolution of about 50 kb (Caburet, Conti, & Bensimon, 2002), yet a typical HPV FISH probe cannot easily distinguish between extrachromosomal and integrated HPV genomes in interphase nuclei. Metaphase-FISH is required to distinguish individual HPV integration sites, but with a diminished resolution of 1–3 Mb (Cheng, Buell, Wing, & Jiang, 2002). Both interphase-FISH and metaphase-FISH are insufficient for analyzing individual integrated HPV genomes and the overall genetic architecture of HPV integration sites.
Molecular combing with FISH, also known as fiber-FISH, greatly improves the resolution of FISH analysis of HPV integration sites. Rather than observing diffuse (interphase) or condensed (metaphase) chromosomes, molecular combing allows the direct visualization of linearized chromosomes (Michalet et al., 1997). By limiting chromosomes to a single dimension, molecular combing improves the resolution of FISH to about 1 kb (Cheng et al., 2002; Florijn et al., 1995). This improved resolution allows a more comprehensive FISH analysis of genetic architecture, such as chromosomal rearrangements in tumor suppressor genes of cancer patients (Gad et al., 2002), and individual integrated HPV genomes. Unlike interphase- and metaphase-FISH which require fixation, molecular combing uses native DNA suspended in a buffer. A silane-coated glass coverslip is inserted into this DNA solution and incubated, allowing the ends of the DNA molecules to bind to the glass (Michalet et al., 1997). When the coverslip is removed at a constant rate (300 μm/sec), the DNA fibers are linearized by the surface tension between the coverslip and the buffer in which the DNA is suspended (see Figure 1) (Michalet et al., 1997). Across a typical coverslip, hundreds of thousands of DNA molecules consisting of dozens of human genomes are combed (Michalet et al., 1997), easily providing a large dataset for comprehensive quantitative analysis.
In combination with next generation sequencing and traditional FISH techniques, fiber-FISH analysis of HPV integration sites comprehensively characterizes the size of the site and the pattern of integration for each individual HPV genome. HPV integration can occur as a single integrated virus, known as type I integration, or multiple, tandemly integrated viruses, known as type II integration (Jeon, Allen-Hoffmann, & Lambert, 1995). In HPV integration sites with amplified HPV DNA, host DNA can be co-amplified, resulting in unique HPV-host concatemers known as type III integration sites (Warburton et al., 2018). Fiber-FISH can easily detect and distinguish between types I, II, and III integration, and determine the pattern of HPV-host co-amplification (Warburton et al., 2018).
Critical Parameters
Molecular combing is a useful technique for studying HPV integration in combination with other FISH and sequencing methods and is best used as a complementary rather than a foundational method. It is useful to have some sequencing data about the integration site that will be visualized before beginning molecular combing. Information, even approximate, about the number of integrated genomes and any host DNA co-amplification can assist with distinguishing real signals from noise when scanning. This is especially important for suspected type I integration sites, where integration sites are small (only about 4 μm in length) and particular care is needed when scanning to prevent overlooking integration sites or collecting non-specific signals.
Troubleshooting
The most common problems faced with this method are due to silane-coated coverslip variability. Poor coverslip quality reduces the density, straightness, and appearance of fibers. Given the difficulty of controlling silane-coating quality, it is advisable to purchase multiple batches of silanized coverslips to have on hand should a batch be insufficient to comb with. A coverslip batch with only patches of dense fibers or with wavy fibers is not suitable for quantitative fiber-FISH measurements.
As well, incomplete melting or digestion of the suspending agarose can negatively affect the density and appearance of fibers. Undigested agarose reduces free DNA in suspension and can cause large clumps of DNA to adhere to the coverslip. To prevent this, ensure that the agarose has been completely melted before the β-agarase incubation.
If fibers are significantly shorter than the anticipated 300–700 μm average length, genomic DNA could have been sheared from forceful manipulation. Once the agarose plug has been melted and the genomic DNA has been resuspended, never use a pipette to move or mix the DNA solution. Gently tap the tube to mix the β-agarase for agarose digestion, and pour the DNA solution into the reservoir as slowly as possible. Poor fiber quality or short fiber length can also be a result of DNase contamination at any point of this method. Long term storage of plugs and melted plugs requires DNase-free reagents, plasticware, and utensils.
Anticipated Results
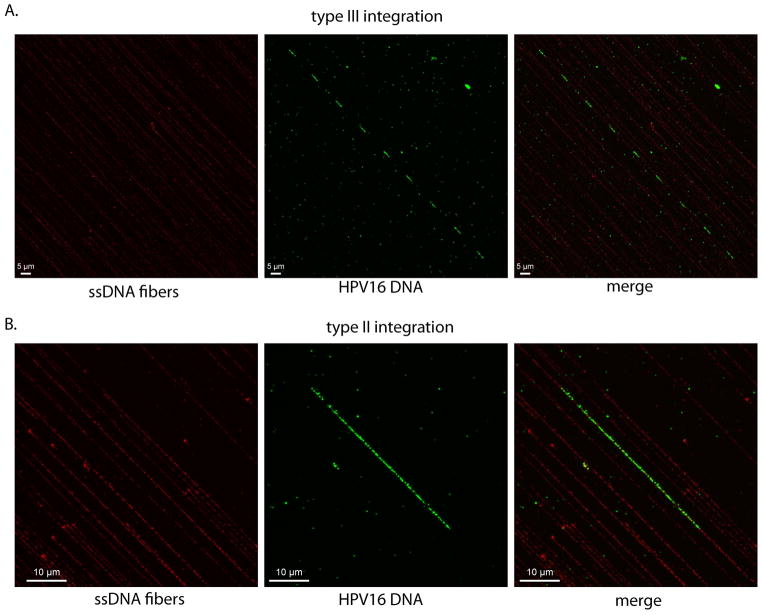
In general, a real fiber-FISH signal will consist of multiple “dots” of fluorescence in tandem and within the ssDNA counterstain line (see Figure 9). If any part of the FISH signal does not line up with the ssDNA counterstain, it is likely non-specific and should not be collected. As well, clumped or frayed fibers will often have non-specific binding of fluorescent streptavidin that appears as a continuous FISH signal. Always ensure that fibers being collected are single, straight, and that the FISH signal is continuous with the ssDNA signal. Images of anticipated results for type III and type II integration are in Figure 10.
Figure 9. Distinguishing real fiber-FISH signals.
Background and non-specific FISH signals can be frequent across a coverslip. If a FISH signal is encountered while scanning that looks like it could be a real integration site, consider: Are there several dots of FISH fluorescence densely spaced near each other in a straight line? Are these dots occurring within a single straight ssDNA fiber? Do the dots of FISH fluorescence line up with the ssDNA signal? If yes, this FISH signal could be a real integration site. Collect an image and continue scanning, if you encounter multiple identical or similar FISH signals, they are very likely real. Arrow: real signal.
Figure 10. HPV16 integration patterns.
A. An example of an anticipated result for type III integration. Multiple HPV16 genomes (green FISH signal) are integrated along a single fiber (red ssDNA signal). Host DNA has been co-amplified with the integrated HPV16 and intersperses each HPV16 genome.
B. An example of an anticipated result for type II integration. Multiple HPV16 genomes (green FISH signal) are integration in tandem within a single fiber (red ssDNA signal).
Time Considerations
This method will require four days to complete and this involves plug preparation, combing, hybridization, and fiber staining. An additional number of days are required to scan and analyze integration sites and this depends on the number of coverslips, the density of the fibers across the coverslips, and the speed of scanning. Cell lysis, plug digestion, and probe hybridization are overnight steps, and the multiple layers that comprise fiber-FISH amplification will take a full day to perform. Once plugs are prepared, they are highly stable at 4°C and can be stored for several years, reducing overnight steps to plug digestion and probe hybridization. Resuspended genomic DNA solutions can also be stored in Teflon reservoirs at 4°C for several months, further reducing overnight steps to probe hybridization for replicate coverslips combed at later dates. Comprehensive coverslip scanning can take 12 to 48 hours of microscope time depending on the incidence of integration sites across the coverslip, and integration site measurement and analysis will require additional time.
SIGNIFICANCE STATEMENT.
A comprehensive characterization of HPV integration sites is crucial to understand HPV integration and how it can contribute to the development and evolution of HPV-positive cancers. Traditional interphase- and metaphase-FISH techniques do not have the resolution necessary to examine the genetic architecture of HPV integration sites. As well, the repetitive nature of many HPV integration sites complicates their analysis through genomic sequencing. Fiber-FISH directly visualizes linearized DNA molecules containing integrated HPV genomes consistently and reproducibly, allowing the comprehensive analysis of tandemly repeating HPV integration sites and their surrounding host sequences. Fiber-FISH is thus a powerful tool for the study of HPV integration and its role in HPV-positive cancers.
Acknowledgments
This study was supported by the Intramural Research Programs of the NIH: the Center for Cancer Research, National Cancer Institute and the National Institute of Allergy and Infectious Diseases
References
- Caburet S, Conti C, Bensimon A. Combing the genome for genomic instability. Trends Biotechnol. 2002;20(8):344–350. doi: 10.1016/s0167-7799(02)01990-x. [DOI] [PubMed] [Google Scholar]
- Cheng Z, Buell CR, Wing RA, Jiang J. Resolution of fluorescence in-situ hybridization mapping on rice mitotic prometaphase chromosomes, meiotic pachytene chromosomes and extended DNA fibers. Chromosome Res. 2002;10(5):379–387. doi: 10.1023/a:1016849618707. [DOI] [PubMed] [Google Scholar]
- Florijn RJ, Bonden LA, Vrolijk H, Wiegant J, Vaandrager JW, Baas F, … Raap AK. High-resolution DNA Fiber-FISH for genomic DNA mapping and colour bar-coding of large genes. Hum Mol Genet. 1995;4(5):831–836. doi: 10.1093/hmg/4.5.831. [DOI] [PubMed] [Google Scholar]
- Gad S, Caux-Moncoutier V, Pages-Berhouet S, Gauthier-Villars M, Coupier I, Pujol P, … Bignon Y-J. Significant contribution of large BRCA1 gene rearrangements in 120 French breast and ovarian cancer families. Oncogene. 2002;21(44):6841. doi: 10.1038/sj.onc.1205685. [DOI] [PubMed] [Google Scholar]
- Jeon S, Allen-Hoffmann BL, Lambert PF. Integration of human papillomavirus type 16 into the human genome correlates with a selective growth advantage of cells. J Virol. 1995;69(5):2989–2997. doi: 10.1128/jvi.69.5.2989-2997.1995. [DOI] [PMC free article] [PubMed] [Google Scholar]
- Kaykov A, Taillefumier T, Bensimon A, Nurse P. Molecular Combing of Single DNA Molecules on the 10 Megabase Scale. Sci Rep. 2016;6:19636. doi: 10.1038/srep19636. [DOI] [PMC free article] [PubMed] [Google Scholar]
- McBride AA, Warburton A. The role of integration in oncogenic progression of HPV-associated cancers. PLoS Pathog. 2017;13(4):e1006211. doi: 10.1371/journal.ppat.1006211. [DOI] [PMC free article] [PubMed] [Google Scholar]
- Michalet X, Ekong R, Fougerousse F, Rousseaux S, Schurra C, Hornigold N, … Beckmann JS. Dynamic molecular combing: stretching the whole human genome for high-resolution studies. Science. 1997;277(5331):1518–1523. doi: 10.1126/science.277.5331.1518. [DOI] [PubMed] [Google Scholar]
- Warburton A, Redmond CJ, Dooley KE, Fu H, Gillison ML, Akagi K, … McBride AA. HPV integration hijacks and multimerizes a cellular enhancer to generate a viral-cellular super-enhancer that drives high viral oncogene expression. PLoS Genet. 2018;14(1):e1007179. doi: 10.1371/journal.pgen.1007179. [DOI] [PMC free article] [PubMed] [Google Scholar]


