Abstract
The existing studies on the association between polymorphisms of Calmodulin 1 (CALM1) gene and the risk of osteoarthritis (OA, a complex multifactorial disease and a major degenerative form of arthritis) in different populations have yielded conflicting findings. Therefore, we conducted a meta-analysis by systematically searching PubMed, Embase, Medline, Cochrane Library and Google Scholar, and assessing this association by calculating pooled odds ratios with 95% confidence intervals. Subgroup analyses stratified by ethnicity, OA type, and genotype were also conducted. Six studies (2752 cases and 3259 controls) involving six single nucleotide polymorphisms were included. Our data suggested that the T allele and genotype TT of the rs12885713 polymorphism, and the C allele of the rs2300496 polymorphism in the CALM1 gene all increased the risk of OA. The pooled results revealed no significant association between the CALM1 rs3213718 polymorphism and the risk of OA. Stratification analyses by ethnicity and OA type showed that the rs12885713 polymorphism increased the risk of OA among Asians and in knee OA, respectively. In conclusion, the rs12885713 and rs2300496 polymorphisms of the CALM1 gene may both increase the risk of OA. Owing to the limitations of the present study, this finding should be further confirmed in future well-designed studies.
Keywords: CALM1, meta-analysis, OA, polymorphism, systematic review
Introduction
Osteoarthritis (OA), the most common form of arthritis, can cause progressive loss of joint function [1]. The distinguishing feature of OA is progressive degradation of articular cartilage accompanied by subsequent joint space narrowing and osteophyte formation at the joint margin, which together lead to chronic joint pain, deformity, and restricted motion [2,3]. OA is a combined result of environmental and genetic factors, which account for nearly 50% of the risk of OA development [4]. Prior genome-wide association studies have [5–7] suggested polymorphisms in some genes may affect OA pathogenesis. Recently, Gao et al. [8] have conducted a meta-analysis indicating that the SMAD3 gene rs12901499 polymorphism increases the risk of OA among both Asians and Caucasians. Lv et al. [9] have also conducted a meta-analysis indicating that the ADAM12 gene rs1871054 polymorphism increases knee OA risk in the Asian population, whereas other polymorphisms (rs3740199, rs1044122, or rs1278279) in ADAM12 are not associated with knee OA in any population. Pan et al. [10] have performed an updated meta-analysis suggesting that the C allele and CC genotype of the GDF5 gene are protective against knee OA susceptibility across different populations. Moreover, single-nucleotide polymorphisms (SNPs) in candidates, such as growth differentiation factor 5 genes, [11] vitamin D receptor, and [12] estrogen receptor-α [13] have been reported to be associated with OA. All the abovementioned SNPs of different genes contribute differently to the risk of OA development through various mechanisms. We hypothesized that candidate gene studies might provide insight into OA development.
Calmodulin (CALM) regulates many Ca2+-dependent cellular events involving an interplay among various proteins [14]. Ca2+-CALM signaling plays a crucial role in cartilage phenotype maintenance and chondrogenesis. CALM probably has pivotal roles in articular cartilage by maintaining the cartilage phenotype in response to mechanical stimuli in mature chondrocytes [15,16], regulating articular chondrogenesis [17], and modulating the adhesion of chondrocytes to extracellular matrix proteins during cartilage repair. Thus, CALM1 may be involved in OA pathogenesis.
To date, several studies [17–22] have explored the relationship between polymorphisms of the CALM1 gene, which is located on chromosome 14q32.11, and OA susceptibility. The association between CALM1 gene SNPs and OA susceptibility may provide new research directions for OA studies. However, the findings of previous studies are conflicting and inconclusive because of clinical heterogeneity, different ethnic populations, and small sample sizes. A single case–control study is underpowered and inconclusive, owing to limited sample sizes. Meta-analysis is used to combine findings based on individual research studies to yield robust conclusions, especially when results from single case–control studies are incomprehensive and conflicting. Thus, to precisely elucidate the genetic roles of CALM1 gene polymorphisms in OA development, we performed a comprehensive systematic review and meta-analysis to clarify the association between these SNPs and OA risk.
Materials and methods
This meta-analysis was performed in compliance with PRISMA guideline [23] (not registered, Supplementary Table S1).
Search strategy
PubMed, Embase, Medline, Cochrane Library, and Google Scholar were systematically searched to identify epidemiological studies published through January 2018 and to retrieve the genetic association studies on OA. The terms ‘Calmodulin’, ‘CALM1’, ‘SNP’, ‘polymorphism’, ‘variant’, ‘osteoarthritis’, and ‘OA’ were used to find all publications reporting CALM1 gene polymorphisms and OA risk. No language or other restrictions were placed on the search. Full text was obtained if the abstract was insufficient to allow us to include or exclude a study. Furthermore, the reference lists of all the related citations were examined to identify any initially omitted studies.
Inclusion and exclusion criteria
The inclusion criteria were as follows: (1) case–control study on humans; (2) observational study addressing OA patients and controls; (3) study evaluating the association between CALM1 gene polymorphisms and susceptibility to OA; and (4) study with sufficient genetic frequency for extraction. The exclusion criteria were as follows: (1) incomplete data; (2) review or case report; and (3) duplicate or overlapping publication. All questionable publications were discussed and addressed by consensus. Three reviewers independently screened the titles and abstracts. In cases of uncertainty regarding any of the above essential information, the full article was retrieved for further scrutiny, or the authors of the individual trials were contacted directly for further information when necessary.
Data extraction and quality assessment
From each eligible study, two reviewers (Y.H.Y and H.Z.Y) independently extracted the following data: first name of the first author, year of publication, country and ethnicity of study population, type of OA, source of controls (SOC), sample size, genotype method, names of gene polymorphisms, and genotype frequencies in cases and controls. The two reviewers (Y.H.Y and H.Z.Y) independently assessed the methodological quality of the included studies according to the Newcastle–Ottawa Scale (NOS) [24]. The NOS criteria were scored on the basis of three aspects: (1) subject selection, 0–4; (2) comparability of subject, 0–2; and (3) exposure, 0–3. The total NOS scores ranged from 0 (lowest) to 9 (highest). All disagreements were resolved through discussion by consensus or through consultation with the senior reviewer if necessary. Hardy–Weinberg equilibrium (HWE) in controls was tested with Pearson’s χ2 test (http://ihg.gsf.de/cgi-bin/hw/hwa1.pl). Studies with scores ≥6 were considered high quality.
Statistical analysis
Pooled odds ratios (ORs) with 95% confidence intervals (CIs) were calculated to assess the association between CALM1 gene polymorphisms and OA susceptibility. Owing to a lack of original data for sex and age, crude ORs were calculated. Five genetic models were used: (1) allele model; (2) recessive model; (3) homozygous model; (4) heterozygous model; and (5) dominant model. P < 0.05 was considered significant. Heterogeneity across studies was assessed by using the Q statistic with its P-value and I2 statistic [25,26]. If I2<50% and P>0.10, a fixed effects model was used in the calculations [27]; otherwise, a random effects model was applied [28]. Subgroup analyses were carried out on the basis of ethnicity, type of OA, and genotype methods. Potential publication bias was assessed with Egger’s and Begg’s linear regression tests [29]. Sensitivity analysis was performed by omitting each study in turn to determine the effect on the heterogeneity test and evaluate the stability of the overall results. All statistical analyses were conducted in Stata 11.0 (Stata Corporation, College Station, TX, U.S.A.). The significant findings were evaluated by calculating the false-positive report probability (FPRP) [30]. An FPRP threshold of 0.2 and a prior probability of 0.25 were set to detect an OR for a correlation with the tested genotype. FPRP <0.2 implied a significant relationship [31,32].
Functional prediction
Potential functions of SNPs were extracted from dbSNP (https://www.ncbi.nlm.nih.gov/snp/). We also used bioinformatics databases such as Promo (http://alggen.lsi.upc.es/cgi-bin/promo_v3/promo/promoinit.cgi?dirDB=TF_8.3) and the MirSNP database (http://bioinfo.bjmu.edu.cn/mirsnp/search/) to analyze transcription factor binding sites (TFBS).
Results
Characteristics of the included studies
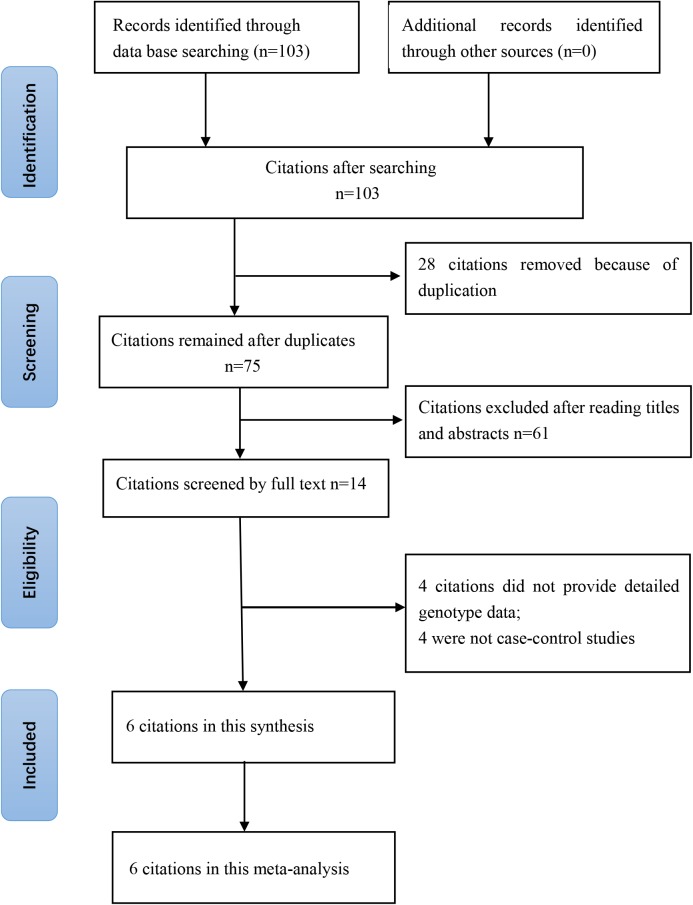
The online search yielded 103 citations, of which 28 duplicates were removed. Then 61 of the 75 remaining citations were excluded after reviewing of titles and abstracts. The remaining 14 citations were sent for full text review, which excluded four citations without detailed genotype data and four non-case–control studies. Finally, six studies (2752 cases and 3259 controls) involving six SNPs were included. The year of publication ranged from 2005 to 2017. The numbers of cases and controls ranged from 183 to 920 and from 193 to 1008, respectively. Two included citations [17,21] studied the association between CALM1 gene polymorphisms in an Asian population and four included citations [18–20,22] studied Caucasian population. Five of included citations [17–21] studied the association between the rs12885713 polymorphism of the CALM1 gene and risk of OA. Mishra et al. [19] and Mototani et al. [17] found that the TT genotype of the rs12885713 polymorphism increases the risk for OA, while Shi et al. [21], Poulou et al. [20], and Loughlim et al. [18] did not find a significant correlation between the rs12885713 polymorphism and OA risk. More characteristics of the included citations are shown in Tables 1 and 2. A flowchart of reviews, showing the detailed selection process, is illustrated in Figure 1. The NOS scores ranged from six to seven stars, thus suggesting that the included studies were all of high methodological quality [33–35].
Table 1. Characteristics of included studies.
| Author | Year | Nationality | OA type | Sample size (Female/male) | Age (mean) | Study SNPs | Genotype method | NOS | HWE (P-value) | ||||
|---|---|---|---|---|---|---|---|---|---|---|---|---|---|
| Case | Control | Case | Control | I | II | III | |||||||
| Mishra [19] | 2017 | India | Knee | 500 (295/205) | 500 (276/224) | F: 55.67 | F: 55.52 | rs12885713 | TaqMan | 3 | 1 | 3 | Y (0.13) |
| M: 56.15 | M: 54.95 | rs3814843 | TaqMan | 3 | 1 | 3 | Y (0.59) | ||||||
| rs2300496 | TaqMan | 3 | 1 | 3 | Y (0.11) | ||||||||
| Shi [21] | 2008 | China | Knee | 183 (124/59) | 210 (142/68) | 58.6 | 57.7 | rs12885713 | PCR-RFLP | 3 | 1 | 3 | Y (0.73) |
| Poulou [20] | 2008 | Greece | Knee | 158 (138/20) | 193 (137/56) | F: 68.1 | F: 60.0 | rs12885713 | PCR-RFLP | 3 | 1 | 3 | Y (0.13) |
| M: 72.4 | M: 70.2 | PCR-RFLP | 3 | 1 | 3 | ||||||||
| Valdes [22] | 2007 | U.K. | Knee | 603 (305/298) | 596 (296/300) | F: 73.5 | F: 72.1 | rs3213718 | PCR-RFLP | 3 | 1 | 3 | Y (as reported) |
| M: 72.1 | M: 71.8 | PCR-RFLP | 3 | 1 | 3 | ||||||||
| Loughlin [18] | 2006 | U.K. | Hip | 920 (547/373) | 752 (393/359) | 64 | 69 | rs12885713 | PCR-RFLP | 2 | 1 | 3 | Y (0.28) |
| Mototani [17] | 2005 | Japan | Hip | 428 (404/24) | 1008 (491/517) | 53.7 | 46.7 | rs12885713 | TaqMan | 3 | 0 | 3 | Y (0.27) |
| rs2300496 | TaqMan | 3 | 0 | 3 | Y (0.30) | ||||||||
| rs2300500 | TaqMan | 3 | 0 | 3 | Y (0.27) | ||||||||
| rs3213718 | TaqMan | 3 | 0 | 3 | Y (0.20) | ||||||||
| rs3179089 | TaqMan | 3 | 0 | 3 | Y (0.07) | ||||||||
I, Selection; II, Comparability; III, Exposure. NOS is available from http://www.ohri.ca/programs/clinical_epidemiology/oxford.asp
Table 2. Genotype distributions of CALM1 polymorphisms in the included studies.
| Author & year | SOC | Ethnicity | Allele | Case | Control | Association with OA | |||||
|---|---|---|---|---|---|---|---|---|---|---|---|
| 1 | 0 | 11 | 10 | 00 | 11 | 10 | 00 | ||||
| rs12885713 (promotor) | |||||||||||
| Mishra, 2017 | NA | Caucasian | T | C | 158 | 240 | 102 | 142 | 233 | 125 | T increased/allele model (in women) |
| Shi, 2008 | HB | Asian | 9 | 57 | 117 | 8 | 70 | 132 | Unrelated | ||
| Poulou, 2008 | HB | Caucasian | 38 | 80 | 36 | 37 | 103 | 46 | Unrelated | ||
| Loughlin, 2006 | NA | Caucasian | 296 | 478 | 146 | 245 | 381 | 126 | Unrelated | ||
| Mototani, 2005 | HB | Asian | 46 | 128 | 160 | 22 | 154 | 199 | TT increased/recessive model | ||
| rs2300496 (intron) | |||||||||||
| Mishra, 2017 | NA | Caucasian | C | A | 132 | 221 | 147 | 113 | 220 | 167 | Unrelated |
| Mototani, 2005 | HB | Asian | 46 | 129 | 159 | 23 | 155 | 197 | CC increased/recessive model | ||
| rs3213718 (intron) | |||||||||||
| Valdes, 2007 | T | C | T vs. C, OR & 95% CI, 0.87 (0.74, 1.03) | Unrelated | |||||||
| Mototani, 2005 | HB | Asian | 65 | 163 | 198 | 79 | 435 | 492 | TT increased/recessive model | ||
| rs3814843 (3′-UTR) | |||||||||||
| Mishra, 2017 | NA | Caucasian | G | T | 0 | 56 | 444 | 0 | 23 | 477 | GG increased/recessive model |
| rs2300500 (intron) | |||||||||||
| Mototani, 2005 | HB | Asian | G | C | 47 | 128 | 159 | 23 | 156 | 196 | GG increased/recessive model |
| rs3179089 (3′-UTR) | |||||||||||
| Mototani, 2005 | HB | Asian | G | C | 45 | 131 | 158 | 20 | 160 | 195 | GG increased/recessive model |
Abbreviations: HB, hospital-based; NA, not available; PB, population-based.
Figure 1. Flowchart of the literature search and selection for the present study.
Association between rs12885713 polymorphism and OA susceptibility
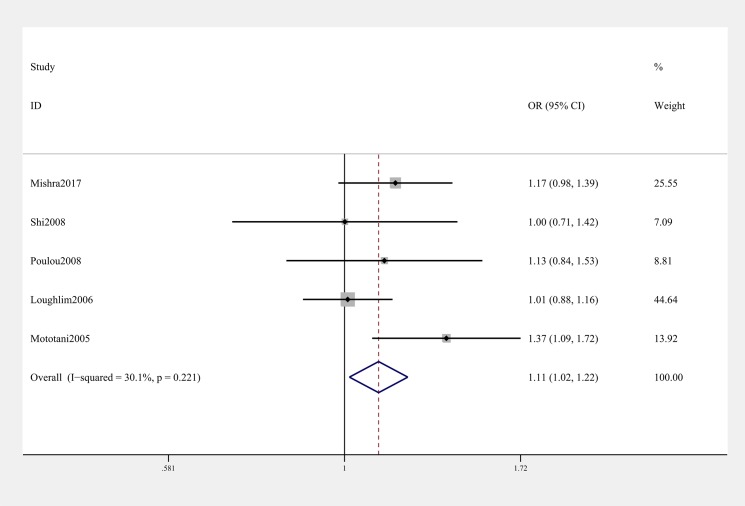
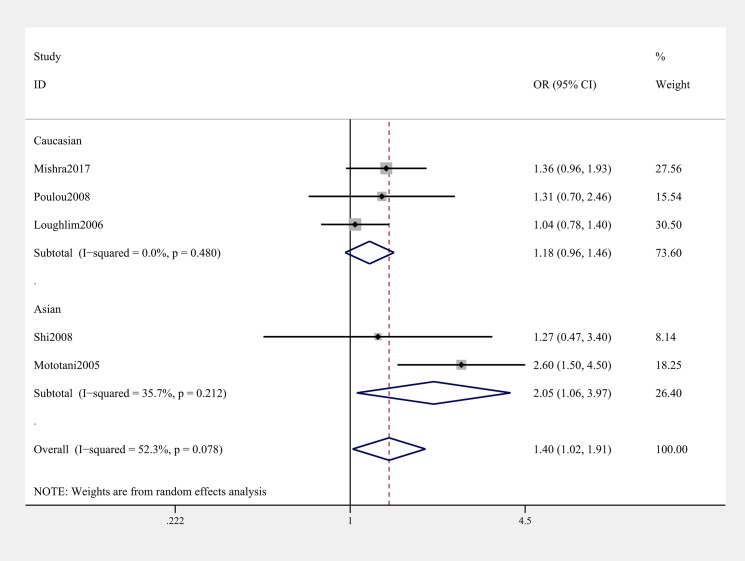
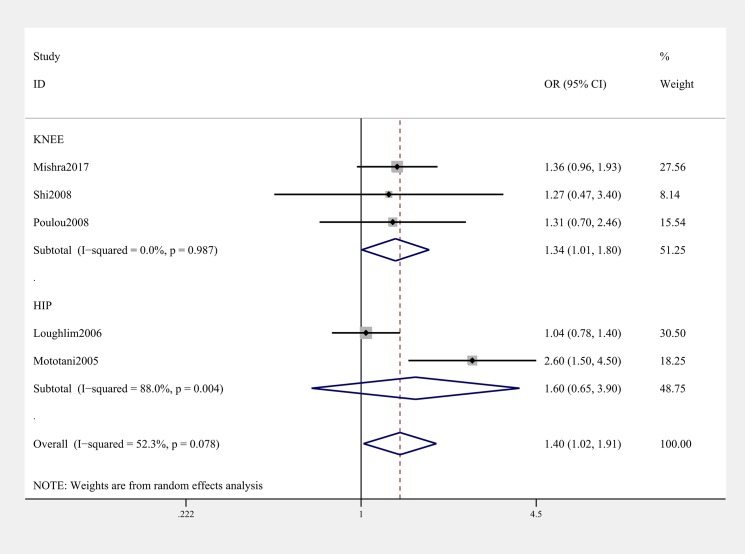
General analysis showed rs12885713 polymorphism of CALM1 gene increased OA risk (OR & 95% CI: 1.11 [1.02–1.22] in T vs. C; 1.40 [1.02–1.91] in TT vs. CC, Table 3 & Figure 2). Stratification analysis by ethnicity showed that the rs12885713 polymorphism increased the risk of OA among Asians (OR & 95% CI: 1.24 [1.03–1.51] in T vs. C; OR & 95% CI: 2.21 [1.39–3.50] in TT vs. TC + CC; 2.05 [1.06–3.97] in TT vs. CC, Table 3 and Figure 3). Subgroup analysis by OA type revealed that the rs12885713 polymorphism increased the risk of knee OA (OR & 95% CI: 1.34 [1.01, 1.80] in TT vs. CC, Table 3 and Figure 4), but not hip OA.
Table 3. Meta-analysis of the association between CALM1 polymorphisms and OA risk.
| SNP | Comparison | Category | Category | Studies | OR (95% CI) | P-value | P for heterogeneity |
|---|---|---|---|---|---|---|---|
| rs12885713 | T vs. C | Total (Fixed model) | 5 | 1.11 (1.02–1.22) | 0.022 | 0.221 | |
| Allele model | Ethnicity | Asian | 2 | 1.24 (1.03–1.51) | 0.024 | 0.140 | |
| Caucasian | 3 | 1.08 (0.97–1.19) | 0.165 | 0.410 | |||
| OA type | Knee | 3 | 1.13 (0.99–1.30) | 0.079 | 0.735 | ||
| Hip | 2 | 1.10 (0.97–1.23) | 0.131 | 0.026 | |||
| Genotype method | TaqMan | 2 | 1.24 (1.08–1.43) | 0.002 | 0.286 | ||
| PCR-RFLP | 3 | 1.03 (0.91–1.16) | 0.665 | 0.792 | |||
| TT + TC vs. CC | Total (Fixed model) | 5 | 1.14 (0.99–1.32) | 0.071 | 0.732 | ||
| Dominant model | Ethnicity | Asian | 2 | 1.13 (0.89–1.43) | 0.324 | 0.327 | |
| Caucasian | 3 | 1.15 (0.96–1.38) | 0.129 | 0.594 | |||
| OA type | Knee | 3 | 1.15 (0.93–1.43) | 0.201 | 0.470 | ||
| Hip | 2 | 1.14 (0.93–1.38) | 0.202 | 0.480 | |||
| Genotype method | TaqMan | 2 | 1.26 (1.03–1.56) | 0.028 | 0.793 | ||
| PCR-RFLP | 3 | 1.04 (0.85–1.27) | 0.699 | 0.895 | |||
| TT vs. TC + CC | Total (Random model) | 5 | 1.30 (0.96–1.76) | 0.086 | 0.023 | ||
| Recessive model | Ethnicity | Asian | 5 | 2.21 (1.39–3.50) | 0.001 | 0.234 | |
| Caucasian | 2 | 1.07 (0.91–1.25) | 0.410 | 0.430 | |||
| OA type | Knee | 3 | 1.20 (0.95–1.52) | 0.120 | 0.902 | ||
| Hip | 2 | 1.54 (0.60–3.93) | 0.371 | 0.001 | |||
| Genotype method | TaqMan | 2 | 1.67 (0.77–3.61) | 0.192 | 0.010 | ||
| PCR-RFLP | 3 | 1.03 (0.86–1.24) | 0.742 | 0.514 | |||
| TT vs. CC | Total (Random model) | 5 | 1.40 (1.02–1.91) | 0.037 | 0.078 | ||
| Homozygote model | Ethnicity | Asian | 2 | 2.05 (1.06–3.97) | 0.033 | 0.212 | |
| Caucasian | 3 | 1.18 (0.96–1.46) | 0.120 | 0.480 | |||
| OA type | Knee | 3 | 1.34 (1.01–1.80) | 0.045 | 0.987 | ||
| Hip | 2 | 1.60 (0.65–3.90) | 0.305 | 0.004 | |||
| Genotype method | TaqMan | 2 | 1.82 (0.97–3.40) | 0.063 | 0.051 | ||
| PCR-RFLP | 3 | 1.10 (0.85–1.42) | 0.475 | 0.774 | |||
| TC vs. CC | Total (Fixed model) | 5 | 1.08 (0.93–1.26) | 0.332 | 0.800 | ||
| Heterozygote model | Ethnicity | Asian | 2 | 0.99 (0.77–1.28) | 0.951 | 0.663 | |
| Caucasian | 3 | 1.13 (0.93–1.37) | 0.206 | 0.672 | |||
| OA type | Knee | 3 | 1.10 (0.88–1.38) | 0.411 | 0.462 | ||
| Hip | 2 | 1.06 (0.86–1.30) | 0.572 | 0.827 | |||
| Genotype method | TaqMan | 2 | 1.14 (0.91–1.43) | 0.246 | 0.380 | ||
| PCR-RFLP | 3 | 1.03 (0.83–1.27) | 0.813 | 0.811 | |||
| rs2300496 | C vs. A | Total (Fixed model) | 2 | 1.23 (1.07–1.42) | 0.003 | 0.329 | |
| Allele model | |||||||
| CC + CA vs. AA dominant model | Total (Fixed model) | 2 | 1.21 (0.99–1.48) | 0.059 | 0.955 | ||
| CC vs. CA + AA | Total (Random model) | 2 | 1.67 (0.85–3.27) | 0.133 | 0.024 | ||
| Recessive model | |||||||
| CC vs. AA | Total (Random model) | 2 | 1.75 (0.95–3.21) | 0.072 | 0.055 | ||
| Homozygote model | |||||||
| CA vs. CC | Total (Fixed model) | 2 | 1.09 (0.88–1.35) | 0.432 | 0.641 | ||
| Heterozygote model | |||||||
| rs3213718 | T vs. C | Total (Fixed model) | 1.09 (0.98-1.21) | 0.105 | 0.153 | ||
| Allele model |
*Bold values are statistically significant (P<0.05).
Figure 2. Forest plot showing OR for the associations between the rs12885713 polymorphism and OA risk (T vs. C).
Figure 3. Stratification analysis by ethnicity showing OR for the association between the rs12885713 polymorphism and OA risk (TT vs. CC).
Figure 4. Stratification analysis by type of OA showing OR for the association between the rs12885713 polymorphism and OA risk (TT vs. CC).
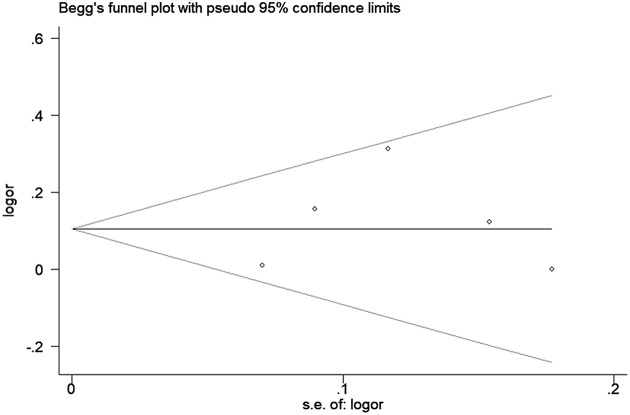
Sensitivity analysis was used to determine the pooled ORs regarding the effects of this SNP on OA risk; the results indicated that our data were stable and credible. The results of false-positive test also proved our findings (Supplementary Table S2). Neither Egger’s nor Begg’s tests revealed obvious publication bias for the rs12885713 polymorphism (Figure 5).
Figure 5. Begg’s tests between the rs12885713 polymorphism and OA (T vs. C).
Association between rs2300496/rs3213718 polymorphisms and OA susceptibility
The results of pooled analysis on the association between CALM1 gene rs2300496/ rs3213718 polymorphisms and OA risk are shown in Table 3. The C allele (OR & 95% CI: 1.23 [1.07–1.42] in C vs. A) for the rs2300496 polymorphism increased the risk of OA as verified by a false-positive test (Supplementary Table S2), whereas the association was not found under the other four genetic models. Thus, we hypothesized that the rs2300496 polymorphism of CALM1 gene may increase the risk of OA susceptibility.
Owing to the incomplete genotype distribution data reported by Valdes et al. [22], only an allele model was used for the rs3213718 polymorphism, which indicated no association. Stratification analysis was not performed, owing to data unavailability.
The rs3814843, rs2300500, and rs3179089 polymorphisms of the CALM1 gene were investigated in only one study [17,19], which reported significant associations (Table 2). Nevertheless, further replication studies are required to confirm the associations.
Functional predictions
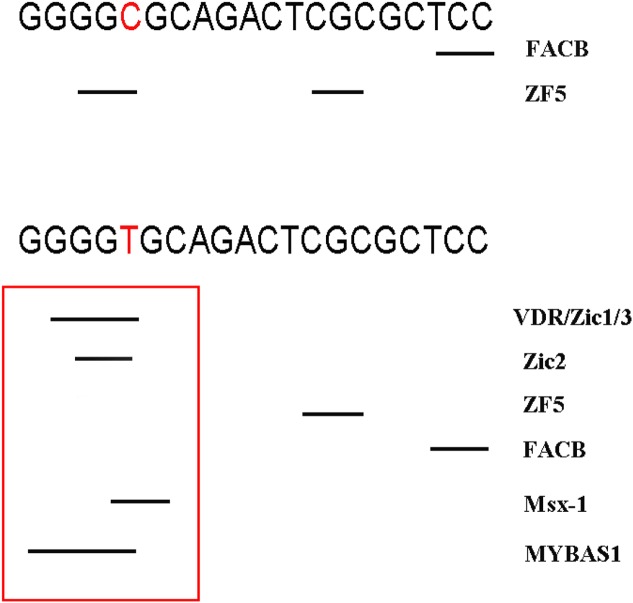
Rs12885713 was located in TFBS. As shown in Figure 6 for rs12885713, if nucleotide C was changed to T, four new TFBS of the VDR, Zic1, Zic3, and MYBAS appeared, thus indicating that polymorphisms of this site may change the transcriptional efficiency of CALM1.
Figure 6. Changed TFBS of rs12885713.
Two SNPs (rs3814843 and rs3179089) in the 3′-UTR of CALM1 may affect binding to microRNA. According to the MirSNP database (http://bioinfo.bjmu.edu.cn/mirsnp/search/), the CALM1 gene binds has-miR-497-5p when the nucleotide changes from A to C (for rs3814843). Has-miR-497-5p is a negative regulator of SMAD3 gene expression [36], and SMAD3 represses MMP13 expression, thereby maintaining articular cartilage and preventing OA [37]. We hypothesized that the minor allele of rs3814843 conferred susceptibility to OA by binding to has-miR-497-5p. For rs3179089, allelic changes affect binding to microRNAs, but these microRNAs have not been reported in the literature (Supplementary Figure S1).
Discussion
To our knowledge, this is the first meta-analysis to investigate the associations between 6 CALM1 gene SNPs and OA risk. Although the definite pathogenesis of OA remains unclear, genetic factors are considered to be strong determinants. Ca2+-CALM signaling has a known role in cartilage phenotype maintenance and chondrogenesis, and microarray analysis [17] has shown that CALM1 expression is elevated in both hip and knee OAs. Many studies [17–22] have explored the association between CALM1 gene SNPs and OA susceptibility. Mototani et al. [17] have found that the rs12885713 polymorphism in the core promoter region of CALM1 is associated with hip OA in a Japanese population and CALM1 expression is elevated in cultured chondrocytes and articular cartilage. Loughlin et al. [18] have suggested that the rs12885713 polymorphism is not a risk factor for OA in the U.K., a result confirmed by another Caucasian study from Greece [20]. A Chinese study [21] also did not find a significant association for this SNP, results similar to findings among Indians. However, Mishra et al. [19] have indicated that CALM1 gene rs12885713 polymorphism increases the risk of OA in females. The findings are clearly conflicting between Asians and Caucasians, possibly for the following six reasons. First, the inclusion criteria differed among studies. For example, Mototani et al. [17] used clinical symptoms and radiological evidence of joints, whereas Loughlin et al. [18] enrolled OA cases who underwent elective hip joint replacement. Second, the allele frequencies of the rs12885713 polymorphism in the cases were diverse. Third, the clinical phenotypes of OA were different. Fourth, the affected joint sites differed. Fifth, the genetic background of OA may vary among races. Finally, the sample sizes may also account.
Owing to their limited sample sizes, previous single studies may have been underpowered and thus have presented conflicting findings, especially given the diverse inheritance of the heterogeneous and complex OA etiology, different ethnicities, clinical heterogeneity, and other causes. Therefore, we conducted this meta-analysis. Our data showed that CALM1 gene rs12885713 polymorphism increases the risk of OA. Furthermore, stratification analyses by ethnicity and OA types indicated that this polymorphism increases the risk of OA among Asians and in the knee, respectively. There are several possible reasons for the different findings regarding the rs12885713 polymorphism between Caucasians and Asians. First, genetic heterogeneity for OA exists in different populations. Second, these discrepancies may be explained by clinical heterogeneity. Third, the sample sizes of the Asian populations were not large enough relative to Caucasian populations to support a clear conclusion. Additionally, the different OA types (knee and hip OA) and varying clinical parameters of different populations may also be potential reasons for the inconclusive findings. As for the conflicting findings according to the OA site, we believe that CALM1 gene rs12885713 polymorphism may be a specific variant for knee OA but not hip OA. Furthermore, the different characteristics of the OA groups (such as age and sex) and disease severity may also be possible reasons for the discrepancies. Finally, the varying environmental factors may also have contributed, because the interaction between genetic factors and environmental factors can eventually lead to the development of OA. Functional predictions indicated that the rs12885713 polymorphism may change the transcriptional efficiency of the CALM1 gene. Thus, we assumed that changes in the transcriptional function by rs12885713 polymorphism may eventually alter CALM1 protein translation, thereby increasing the risk of OA. In addition, we believe that the effect of the rs12885713 polymorphism may be subtle, because this SNPs may be in linkage disequilibrium with other variants affecting the risk of OA (Supplementary Figure S2). Thus, further studies investigating other SNPs are urgently needed. Our meta-analysis also showed that the CALM1 gene rs2300496 polymorphism, but not the rs3213718 polymorphism, may increase the risk of OA. As for other SNPs of the CALM1 gene, the rs3814843, rs2300500, and rs3179089 polymorphisms were significantly associated with OA risk, although further replication studies are needed to confirm whether these SNPs influence the genetic risk of OA.
Some limitations of this meta-analysis should be considered. First, owing to limited data, we were unable to conduct stratification analyses of other potential factors, such as age, sex, and OA onset age. Second, our results were based on unadjusted estimates of confounding factors, which might have affected the final results. Third, although funnel plots and Egger’s tests revealed no publication bias, selection bias could not be fully avoided, because only studies published in English were searched. Fourth, we were unable to assess potential gene–gene or gene–environment interactions because of the lack of relevant data. Fifth, the conclusions of some stratification analyses of the rs12885713 polymorphism should be interpreted with caution, owing to limited sample sizes. Sixth, clinical cases should be investigated in further studies to support these analytical results. Seventh, we can only infer but cannot conclude that the CALM1 gene rs12885713 polymorphism is a susceptibility locus for other types of OA, thus necessitating further investigation into more types of OA. Finally, five genetic models of inheritance were used; thus, type I error may have arisen through a lack of correction for multiple testing.
In conclusion, the present meta-analysis demonstrates that the rs12885713 and rs2300496 polymorphisms of the CALM1 gene, but not the rs3213718 polymorphism, may increase the risk of OA. Owing to the study limitations, further well-designed prospective studies with large sample sizes should be performed to confirm these findings.
Supporting information
Supplementary Figure 1.
Changed transcription factor binding sites (TFBS) of rs3814843 and rs3179089.
Supplemental Table. PRISMA 2009 Checklist.
Supplementary file 2. False-positive report probability values for associations between the CALM1 gene polymorphisms and OA risk.
Abbreviations
- CALM
calmodulin
- CI
confidence interval
- FPRP
false-positive report probability
- HWE
Hardy–Weinberg equilibrium
- NOS
Newcastle–Ottawa Scale
- OA
osteoarthritis
- OR
odds ratio
- SNP
single-nucleotide polymorphism
- SOC
source of control
- TFBS
transcription factor binding sites
- VDR
vitamin D receptor
Funding
The authors declare that there are no sources of funding to be acknowledged.
Author contribution
Conceptualization: Y.H.Y. and L.R.P.; Methodology: Y.H.Y. and H.Z.Y.; Software and data analysis: Z.C. and Z.Y.K.; Validation: Y.H.Y., H.Z.Y., and L.R.P.; Writing - original draft preparation: Y.H.Y.; Writing - review and editing: L.R.P.
Competing interests
The authors declare that there are no competing interests associated with the manuscript.
References
- 1.Valdes A.M. and Spector T.D. (2011) Genetic epidemiology of hip and knee osteoarthritis. Nat. Rev. Rheumatol. 7, 23–32 10.1038/nrrheum.2010.191 [DOI] [PubMed] [Google Scholar]
- 2.Dieppe P.A. and Lohmander L.S. (2005) Pathogenesis and management of pain in osteoarthritis. Lancet 365, 965–973 10.1016/S0140-6736(05)71086-2 [DOI] [PubMed] [Google Scholar]
- 3.Bijlsma J.W., Berenbaum F. and Lafeber F.P. (2011) Osteoarthritis: an update with relevance for clinical practice. Lancet 377, 2115–2126 10.1016/S0140-6736(11)60243-2 [DOI] [PubMed] [Google Scholar]
- 4.Loughlin J. (2005) The genetic epidemiology of human primary osteoarthritis: current status. Expert Rev. Mol. Med. 7, 1–12 10.1017/S1462399405009257 [DOI] [PubMed] [Google Scholar]
- 5.Pang H., Luo F., Dai F., Wu X.H. and Xu J.Z. (2013) Genome-wide association study for osteoarthritis. Lancet 381, 372–373, discussion 373 10.1016/S0140-6736(13)60167-1 [DOI] [PubMed] [Google Scholar]
- 6.Kerkhof H.J., Lories R.J., Meulenbelt I., Jonsdottir I., Valdes A.M., Arp P.. et al. (2010) A genome-wide association study identifies an osteoarthritis susceptibility locus on chromosome 7q22. Arthritis Rheum. 62, 499–510 [DOI] [PMC free article] [PubMed] [Google Scholar]
- 7.arc O.C., arc O.C., Zeggini E., Panoutsopoulou K., Southam L., Rayner N.W.. et al. (2012) Identification of new susceptibility loci for osteoarthritis (arcOGEN): a genome-wide association study. Lancet 380, 815–823 10.1016/S0140-6736(12)60681-3 [DOI] [PMC free article] [PubMed] [Google Scholar]
- 8.Gao S.T., Lv Z.T. and Sheng W.B. (2018) The association between rs12901499 polymorphism in SMAD3 gene and risk of osteoarthritis: a meta-analysis. Ther. Clin. Risk Manag. 14, 929–936 10.2147/TCRM.S164409 [DOI] [PMC free article] [PubMed] [Google Scholar]
- 9.Lv Z.T., Liang S., Huang X.J., Cheng P., Zhu W.T. and Chen A.M. (2017) Association between ADAM12 single-nucleotide polymorphisms and knee osteoarthritis: a meta-analysis. Biomed. Res. Int. 2017 10.1155/2017/5398181 [DOI] [PMC free article] [PubMed] [Google Scholar]
- 10.Pan F., Tian J., Winzenberg T., Ding C. and Jones G. (2014) Association between GDF5 rs143383 polymorphism and knee osteoarthritis: an updated meta-analysis based on 23,995 subjects. BMC Musculoskelet. Disord. 15, 404 10.1186/1471-2474-15-404 [DOI] [PMC free article] [PubMed] [Google Scholar]
- 11.Miyamoto Y., Mabuchi A., Shi D., Kubo T., Takatori Y., Saito S.. et al. (2007) A functional polymorphism in the 5′ UTR of GDF5 is associated with susceptibility to osteoarthritis. Nat. Genet. 39, 529–533 10.1038/2005 [DOI] [PubMed] [Google Scholar]
- 12.Zhu Z.H., Jin X.Z., Zhang W., Chen M., Ye D.Q., Zhai Y.. et al. (2014) Associations between vitamin D receptor gene polymorphisms and osteoarthritis: an updated meta-analysis. Rheumatology (Oxford) 53, 998–1008 10.1093/rheumatology/ket418 [DOI] [PubMed] [Google Scholar]
- 13.Dai X., Wang C., Dai J., Shi D., Xu Z., Chen D.. et al. (2014) Association of single nucleotide polymorphisms in estrogen receptor alpha gene with susceptibility to knee osteoarthritis: a case-control study in a Chinese Han population. Biomed Res. Int 2014, 151457 10.1155/2014/151457 [DOI] [PMC free article] [PubMed] [Google Scholar]
- 14.Berridge M.J., Bootman M.D. and Lipp P. (1998) Calcium–a life and death signal. Nature 395, 645–648 10.1038/27094 [DOI] [PubMed] [Google Scholar]
- 15.Valhmu W.B., Stazzone E.J., Bachrach N.M., Saed-Nejad F., Fischer S.G., Mow V.C.. et al. (1998) Load-controlled compression of articular cartilage induces a transient stimulation of aggrecan gene expression. Arch. Biochem. Biophys. 353, 29–36 10.1006/abbi.1998.0633 [DOI] [PubMed] [Google Scholar]
- 16.Valhmu W.B. and Raia F.J. (2002) Myo-Inositol 1,4,5-trisphosphate and Ca(2+)/calmodulin-dependent factors mediate transduction of compression-induced signals in bovine articular chondrocytes. Biochem. J. 361, 689–696 10.1042/bj3610689 [DOI] [PMC free article] [PubMed] [Google Scholar]
- 17.Mototani H., Mabuchi A., Saito S., Fujioka M., Iida A., Takatori Y.. et al. (2005) A functional single nucleotide polymorphism in the core promoter region of CALM1 is associated with hip osteoarthritis in Japanese. Hum. Mol. Genet. 14, 1009–1017 10.1093/hmg/ddi093 [DOI] [PubMed] [Google Scholar]
- 18.Loughlin J., Sinsheimer J.S., Carr A. and Chapman K. (2006) The CALM1 core promoter polymorphism is not associated with hip osteoarthritis in a United Kingdom Caucasian population. Osteoarthr. Cartil. 14, 295–298 10.1016/j.joca.2005.11.001 [DOI] [PubMed] [Google Scholar]
- 19.Mishra A., Srivastava R.N., Awasthi S., Parmar D. and Mishra P. (2017) Expression of genes and their polymorphism influences the risk of knee osteoarthritis. J. Nucleic Acids 2017, 3138254 10.1155/2017/3138254 [DOI] [PMC free article] [PubMed] [Google Scholar]
- 20.Poulou M., Kaliakatsos M., Tsezou A., Kanavakis E., Malizos K.N. and Tzetis M. (2008) Association of the CALM1 core promoter polymorphism with knee osteoarthritis in patients of Greek origin. Genet. Test. 12, 263–265 10.1089/gte.2007.0114 [DOI] [PubMed] [Google Scholar]
- 21.Shi D., Ni H., Dai J., Qin J., Xu Y., Zhu L.. et al. (2008) Lack of association between the CALM1 core promoter polymorphism (-16C/T) and susceptibility to knee osteoarthritis in a Chinese Han population. BMC Med. Genet. 9, 91 10.1186/1471-2350-9-91 [DOI] [PMC free article] [PubMed] [Google Scholar]
- 22.Valdes A.M., Loughlin J., Oene M.V., Chapman K., Surdulescu G.L., Doherty M.. et al. (2007) Sex and ethnic differences in the association of ASPN, CALM1, COL2A1, COMP, and FRZB with genetic susceptibility to osteoarthritis of the knee. Arthritis Rheum. 56, 137–146 10.1002/art.22301 [DOI] [PubMed] [Google Scholar]
- 23.Moher D., Liberati A., Tetzlaff J., Altman D.G. and Group P. (2010) Preferred reporting items for systematic reviews and meta-analyses: the PRISMA statement. Int. J. Surg. 8, 336–341 10.1016/j.ijsu.2010.02.007 [DOI] [PubMed] [Google Scholar]
- 24.Stang A. (2010) Critical evaluation of the Newcastle-Ottawa scale for the assessment of the quality of nonrandomized studies in meta-analyses. Eur. J. Epidemiol. 25, 603–605 10.1007/s10654-010-9491-z [DOI] [PubMed] [Google Scholar]
- 25.Higgins J.P., Thompson S.G., Deeks J.J. and Altman D.G. (2003) Measuring inconsistency in meta-analyses. BMJ 327, 557–560 10.1136/bmj.327.7414.557 [DOI] [PMC free article] [PubMed] [Google Scholar]
- 26.Higgins J.P. and Thompson S.G. (2002) Quantifying heterogeneity in a meta-analysis. Stat. Med. 21, 1539–1558 10.1002/sim.1186 [DOI] [PubMed] [Google Scholar]
- 27.Mantel N. and Haenszel W. (1959) Statistical aspects of the analysis of data from retrospective studies of disease. J. Natl. Cancer Inst. 22, 719–748 [PubMed] [Google Scholar]
- 28.DerSimonian R. and Laird N. (1986) Meta-analysis in clinical trials. Control. Clin. Trials 7, 177–188 10.1016/0197-2456(86)90046-2 [DOI] [PubMed] [Google Scholar]
- 29.Peters J.L., Sutton A.J., Jones D.R., Abrams K.R. and Rushton L. (2006) Comparison of two methods to detect publication bias in meta-analysis. JAMA 295, 676–680 10.1001/jama.295.6.676 [DOI] [PubMed] [Google Scholar]
- 30.Wacholder S., Chanock S., Garcia-Closas M., El Ghormli L. and Rothman N. (2004) Assessing the probability that a positive report is false: an approach for molecular epidemiology studies. J. Natl. Cancer Inst. 96, 434–442 10.1093/jnci/djh075 [DOI] [PMC free article] [PubMed] [Google Scholar]
- 31.Tong X., Ma Y., Deng H., Wang X., Liu S., Yan Z.. et al. (2016) The SDF-1 rs1801157 polymorphism is associated with cancer risk: an update pooled analysis and FPRP test of 17,876 participants. Sci. Rep. 6, 27466 10.1038/srep27466 [DOI] [PMC free article] [PubMed] [Google Scholar]
- 32.Tong X., Zheng B., Tong Q., Liu S., Peng S., Yang X.. et al. (2015) The MIF -173G/C gene polymorphism increase gastrointestinal cancer and hematological malignancy risk: evidence from a meta-analysis and FPRP test. Int. J. Clin. Exp. Med 8, 15949–15957 [PMC free article] [PubMed] [Google Scholar]
- 33.Fang D. and Ye Y. (2017) C-reactive protein gene rs1205 polymorphism is not associated with the risk of colorectal cancer. Biosci. Rep. 37, BSR20170872 10.1042/BSR20170872 [DOI] [PMC free article] [PubMed] [Google Scholar]
- 34.Wang M.J., Xu X.L., Yao G.L., Yu Q., Zhu C.F., Kong Z.J.. et al. (2016) MYO9B gene polymorphisms are associated with the risk of inflammatory bowel diseases. Oncotarget 7, 58862–58875 [DOI] [PMC free article] [PubMed] [Google Scholar]
- 35.Wang M., Yang J. and Su J. (2017) Relationship between the polymorphism in exon 5 of BACE1 gene and Alzheimer’s disease. Aging Clin. Exp. Res. 29, 105–113 10.1007/s40520-016-0539-0 [DOI] [PubMed] [Google Scholar]
- 36.Jafarzadeh M., Soltani B.M., Dokanehiifard S., Kay M., Aghdami N. and Hosseinkhani S. (2016) Experimental evidences for hsa-miR-497-5p as a negative regulator of SMAD3 gene expression. Gene 586, 216–221 10.1016/j.gene.2016.04.003 [DOI] [PubMed] [Google Scholar]
- 37.Chen C.G., Thuillier D., Chin E.N. and Alliston T. (2012) Chondrocyte-intrinsic Smad3 represses Runx2-inducible matrix metalloproteinase 13 expression to maintain articular cartilage and prevent osteoarthritis. Arthritis Rheum. 64, 3278–3289 10.1002/art.34566 [DOI] [PMC free article] [PubMed] [Google Scholar]


