Abstract
This study investigated effects of skeletal muscle cooling on the metabolic response and kinetics of pulmonary oxygen uptake (O2) and skeletal muscle deoxygenation during submaximal exercise. In the cooling condition (C), after immersion of the lower body into 12°C water for 30 min, eight healthy males performed 30‐min cycling exercise at the lactate threshold while undergoing thigh cooling by a water‐circulating pad. In the normal condition (N) as control, they conducted the same exercise protocol without cooling. Blood lactate concentration was significantly higher in C than N at 10 min after onset of exercise (4.0 ± 1.7 and 2.4 ± 1.2 mmol/L in C and N, P < 0.05). The percent change in the tissue oxygen saturation of the vastus lateralis, measured by a near‐infrared spectroscopy, was significantly lower in C at 2, 8, 10, and 20 min after the exercise onset compared with N (P < 0.05). The percent change in deoxy hemoglobin+myoglobin concentration (Deoxy[Hb+Mb]) showed a transient peak at the onset of exercise and significantly higher value in C at 10, 20, and 30 min after the exercise onset (P < 0.05). Compared to N, slower O2 kinetics (mean response time) was observed in C (45.6 ± 7.8 and 36.1 ± 7.7 sec in C and N, P < 0.05). The mean response time in C relative to N was significantly correlated with the transient peak of Deoxy[Hb+Mb] in C (r = 0.84, P < 0.05). These results suggest that lower oxygen delivery to the hypothermic skeletal muscle might induce greater glycolytic metabolism during exercise and slower O2 kinetics at the onset of exercise.
Keywords: Cold skeletal muscle, glycolytic metabolism, near‐infrared spectroscopy
Introduction
There are many situations where humans perform in cold environments during sports events, winter outdoor occupations, and natural disasters like flooding and tsunamis. Cold‐induced impairment of exercise performance including lower maximal force, velocity, and muscle endurance with lower skeletal muscle temperature (T muscle) has been reported and summarized in several articles (Clarke et al. 1958; Heus et al. 1995; Racinais and Oksa 2010; Wakabayashi et al. 2015). The physiological mechanism for the performance impairment induced by cold has been studied extensively in relation to neuromuscular function using electromyography (EMG). The lower shift of EMG frequency with lower T muscle is generally observed during exercise in cold (Bigland‐Ritchie et al. 1981; Mucke and Heuer 1989; Oksa et al. 1997; Petrofsky and Laymon 2005; Wakabayashi et al. 2017) and is associated with a reduction of the muscle conduction velocity (Bigland‐Ritchie et al. 1981). Because of the lower contractility of each muscle fiber with low T muscle, greater numbers of motor units are recruited to maintain the same work load in thermoneutral condition (Mallette et al. 2018).
Some studies have undertaken the measurement of pulmonary oxygen uptake (O2) to evaluate the effect of low T muscle on the whole body metabolism. Shiojiri et al. (1997) suggested that the slower pulmonary O2 response with low T muscle at the onset of exercise was due to decreased O2 extraction and/or impairment of oxidative reactions in the cold skeletal muscle. However, due to the lack of direct measurement of muscle metabolism, it is still not clear how hypothermic skeletal muscle contributes to delayed O2 kinetics. Bowen et al. (2013) investigated the association between delayed O2 kinetics in hypoxic conditions and the transient peak of the skeletal muscle deoxygenation measured by near‐infrared spectroscopy (NIRS). Similar to what is present with hypoxia (Bowen et al. 2013), in cold muscle, transient deoxygenation reflecting lower O2 delivery relative to the muscle O2 consumption would be expected because of the lower muscle perfusion with blood (i.e., lower O2 delivery) in the cold (Rennie et al. 1980; Thorsson et al. 1985; Gregson et al. 2011). Additionally, fast‐twitch fiber recruitment and anaerobic metabolism are expected to be increased in the cold (Rome et al. 1992; Fujimoto et al. 2016). It is known that larger proportion of fast‐twitch fiber slows O2 kinetics in vitro (Crow and Kushmerick 1982) and in vivo (Barstow et al. 1996; Pringle et al. 2003). Thus, fast‐twitch fiber recruitment with hypothermic skeletal muscle could also delay O2 kinetics, although these possibilities have yet to be examined.
Accordingly, the purpose of this study was to investigate the effect of lower T muscle on the muscle and whole body metabolic response during lactate threshold (LT) exercise in human on cold exposure. The LT work rate was chosen for detecting difference between cold and normal conditions, even with a slight recruitment of glycolytic metabolism in cold. It was hypothesized that, in comparison with normothermic condition, greater blood lactate concentration would be observed with hypothermic skeletal muscle, and transient peak of the skeletal muscle deoxygenation would result in slower O2 kinetics at the onset of exercise in cold.
Methods
Participants
Eight healthy males (mean ± standard deviation height: 173.4 ± 5.4 cm, body weight: 71.7 ± 12.4 kg) participated in this study. They were informed of the experimental procedures and gave their written consent before participation. All experimental procedures in this study were designed according to the principle of the Helsinki Declaration and approved by the Human Subjects Committee of the University of Tsukuba.
Procedures
Prior to the main experiment, participants performed an incremental exercise test for assessing their LT using a bicycle ergometer (PowerMax VII, Konami). Participants performed an intermittent incremental cycling protocol consisting of 4‐min pedaling at 60 rpm and 2‐min rest interval. They started the first stage from 1.0 kp and gradually increased intensity by 0.3 kp every stage until their blood lactate concentration (La) was higher than 4.0 mmol/L. During the stage interval, capillary blood was sampled from their fingertip. Based on the La of each stage, the LT work rate was determined by the linear regression fitting model with least mean squared error using Lactate‐E software (Newell et al. 2007).
The participants performed 30‐min constant work rate exercise in both cooling (C) and normal (N) condition in random order on separate days. They sat on the seat of the ergometer (PowerMax VII, Konami) for 3 min for measuring resting baseline values. In C, participants underwent pre‐cooling by immersing their lower body into 12°C water for 30 min while remaining at rest, and then exited the immersion pool and performed 30‐min cycling exercise at the LT work rate at 60 rpm with cooling applied to their thighs. Both thighs were wrapped by several water perfusion cooling pads, through which 5°C water was circulated using a thermostatic bath system (LTB‐400, ASONE). In N, they conducted a similar exercise protocol without any cooling. The LT work rate was chosen for clearly detecting the recruitment of anaerobic metabolism in C compared to N.
Measurements and analysis
The vastus lateralis T muscle was estimated continuously, except during immersion, using a deep body temperature monitor (CM‐210, TERUMO) which detects the tissue temperature 5–10 mm below the skin surface using the zero‐heat‐flow‐method (Yamakage and Namiki 2003). This monitor measures skin surface temperature beneath a thermal insulating pad containing a heater, which equilibrates the skin temperature with the deep tissue temperature when heat flow from the skin is maintained at zero. The consistency between T muscle measured using a needle thermocouple and the zero‐heat‐flow‐method was evaluated (Togawa et al. 1976). The skin temperature on the thigh (T thigh) was also measured using a thermistor sensor (PD‐K161, TERUMO).
Changes in the concentrations of oxygenated and deoxygenated hemoglobin and myoglobin (Oxy[Hb+Mb] and Deoxy[Hb+Mb]) in the vastus lateralis muscle were continuously measured using spatially resolved near‐infrared spectroscopy (NIRS) (BOM‐L1TR, Omegawave). The data were sampled using an A/D converter (Powerlab/16SP, AD Instruments) and recorded at 0.1 second intervals using a laptop computer. The optodes of the NIRS were housed in an optically dense black vinyl holder to ensure distance between an illuminant and two detectors at 20 (detector 1) and 40 mm (detector 2), respectively. The illuminant generated three wavelengths of near‐infrared light (780, 810 and 830 nm). The optodes were attached to the skin above the vastus lateralis using double‐sided adhesive tape. The Oxy[Hb+Mb] and Deoxy[Hb+Mb] concentrations only in the deep tissue region (Oxy[Hb+Mb]2‐1 and Deoxy[Hb+Mb]2‐1) were calculated from the [Hb+Mb] concentrations measured at the two detectors (detector 1 and 2) using the following formulae (Kashima 2003).
where L 1 and L 2 represent length from the illuminant to the detector 1 and 2, respectively. This method enabled us to focus on the muscle oxygenation excluding the effect of the skin blood flow on [Hb+Mb] concentrations (Ando et al. 2010). Total [Hb+Mb] and tissue O2 saturation (StO2) was calculated by the following formulas.
Percent change of Oxy[Hb+Mb], Deoxy[Hb+Mb], total[Hb+Mb] and StO2 from the baseline period before cooling was calculated for the following analyses, since the NIRS technique cannot measure the absolute [Hb+Mb] concentration and reference values for both conditions are set at thermoneutral baseline.
La concentration was measured at baseline, every 2 min in the first 10‐min exercise and every 10 min in the latter 20 min using a portable lactate analyzer (Lactate Pro LT‐1710, Arkray Inc). Breath‐by‐breath O2 was continuously measured by an automated respirometer (Metalyzer 3B, Cortex) and was interpolated at 5‐sec intervals. The kinetics of O2 at the onset of exercise was analyzed using the first 6‐min data excluding the initial 20 sec, since this study focused on the primary phase reflecting the kinetics of O2 consumption in the exercising muscle. To reduce the breath‐by‐breath O2 fluctuation, the data were smoothed using a 3‐point moving average. The O2 response was fitted to the following exponential equation using nonlinear least squares regression. The fitting of the exponential curve and 3‐point moving average for each participant was evaluated by coefficient of determination (R 2).
where O2 (base): O2 at the baseline before exercise onset, Amp: amplitude between the baseline and steady state (6 min after onset of exercise), TD: time delay, τ: time constant of the exponential function. Mean response time (MRT) was calculated according to the following formulae (Sietsema et al. 1994).
where O2 deficit: subtracting 6‐min cumulative O2 from the required O2, i.e., the product of O2 at 6 min and the duration (6 min), O2 (6): O2 at 6 min after exercise onset. The increment in O2 between minutes 2 and 6 (∆O2 (6–2)) was calculated for assessing the slow component of O2 kinetics (Whipp and Wasserman 1986). Additionally, O2 amplitude between baseline and 30 min after the onset of exercise (∆O2 (30–base)) was calculated.
Statistical analysis
Data from time‐course measurements (T muscle, T thigh, O2, La, percent change of Oxy[Hb+Mb], Deoxy[Hb+Mb], total[Hb+Mb] and StO2) were evaluated using repeated measures two‐way (condition × time) analysis of variance (ANOVA). If Mauchly's sphericity test was not satisfied, the degrees of freedom were adjusted by Greenhouse‐Geisser's ε. Paired Student's t‐test with Holm's multiple comparisons adjustment (Holm 1979) was conducted between conditions at each time point. Parameters of O2 kinetics (baseline, Amp, TD, τ, MRT, O2 deficit and ∆O2 (6–2) and ∆O2 (30–base)) were compared between conditions using paired t‐test. Pearson correlation coefficient was calculated to examine the relationships between parameters of O2 kinetics and muscle deoxygenation. Cohen's d and partial η 2 (η p 2) was calculated for assessing effect size for paired t‐test and ANOVA, respectively. Statistical significance was established at P < 0.05. All data are presented as mean values and standard deviation (SD).
Results
Body temperature
T muscle and T thigh during exercise are shown in Figure 1. For both temperature variables, significant main effect of time (F 2.4, 16.6 = 228.4, η p 2 = 0.98, P < 0.001; F 1.7, 12.1 = 69.0, = 0.99, P < 0.001), condition (F 1, 7 = 623.8, = 0.99, P < 0.001; F 1, 7 = 368.3, = 0.98, P < 0.001), and a significant interaction between those factors (F 2.1, 14.7 = 75.1, = 0.99, P < 0.001; F 2.1, 14.9 = 15.2, = 0.69, P < 0.001) were detected in the two‐way ANOVA. The lower body cold immersion decreased T muscle to 22.7°C on average. After the onset of exercise T muscle in C gradually recovered, though it was significantly lower than N throughout the 30‐min exercise (P < 0.05). T thigh was about 21°C in C at the onset of exercise, then gradually increased during exercise, although it was significantly lower than that in N throughout the 30‐min exercise (P < 0.05).
Figure 1.
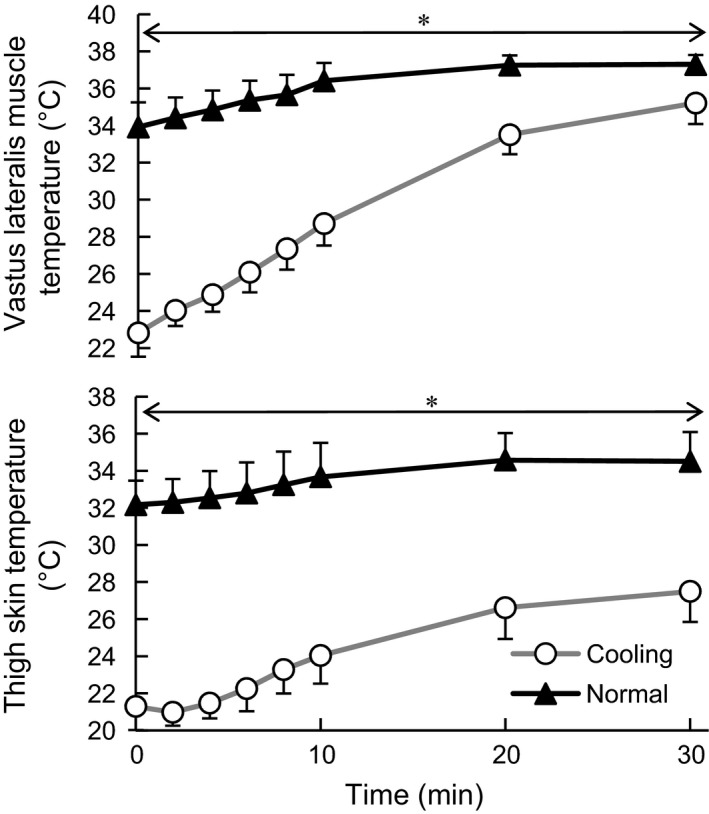
The vastus lateralis muscle temperature and thigh skin temperature during exercise. Values are mean ± SD of the cooling and normal conditions *Significant difference between conditions (P < 0.05).
Pulmonary oxygen uptake and blood lactate concentration
O2 during exercise showed a significant main effect of time (F 1.1, 8.0 = 64.8, = 0.90, P < 0.001, Fig. 2). No significant difference was observed between conditions in O2 at any time point during exercise.
Figure 2.
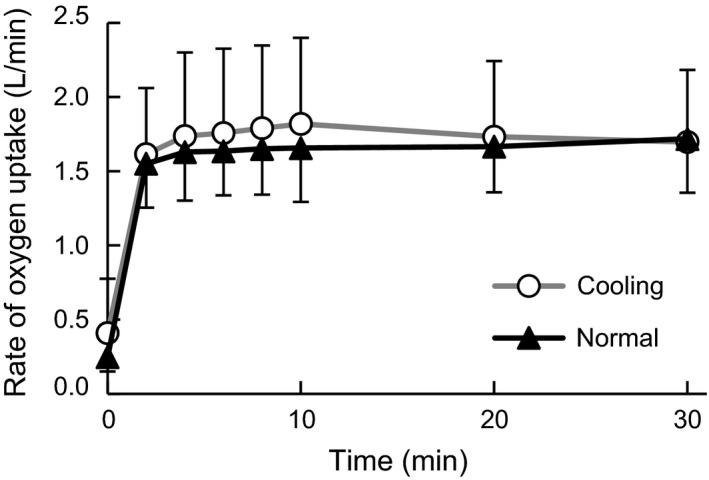
Change in the rate of oxygen uptake during the experiment. Values are mean ± SD of the cooling and normal conditions.
La showed significant main effect of time (F 1.9, 13.4 = 10.1, = 0.59, P < 0.001), condition (F 1, 7 = 20.3, = 0.74, P < 0.001), and a significant interaction between those factors (F 2.96, 20.7 = 6.7, = 0.49, P < 0.001, Fig. 3). La was significantly higher in C than that in N at 8 min (d = 1.25, P < 0.05) and 10 min (d = 1.14, P < 0.05) after onset of exercise.
Figure 3.
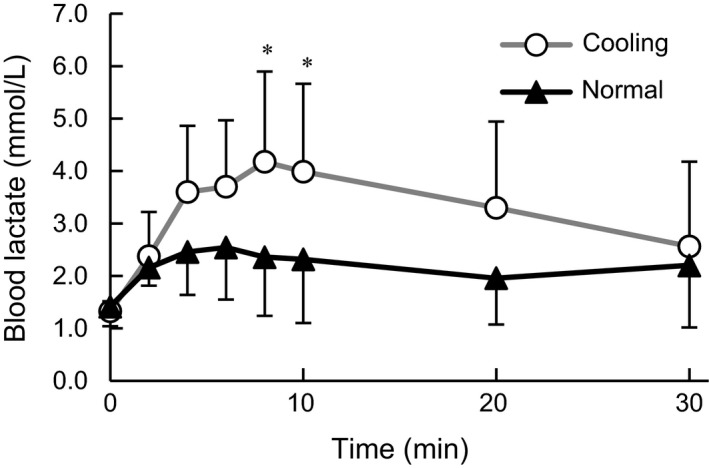
Change in the blood lactate concentration during exercise. Values are mean ± SD of each cooling and normal condition. * Significant difference between conditions (P < 0.05).
Skeletal muscle oxygenation
The percent change in Oxy, Deoxy, and total [Hb+Mb] in the vastus lateralis relative to the resting baseline before cooling are shown in Figure 4. The Oxy[Hb+Mb] showed significant main effect of time (F 1.8, 12.4 = 5.7, = 0.45, P < 0.05) and condition (F 1, 7 = 8.1, = 0.54, P < 0.05). At the onset of exercise the Oxy[Hb+Mb] in C was significantly lower than that in N (d = 2.79, P < 0.01). The Deoxy[Hb+Mb] showed significant main effect of time (F 1.7, 11.7 = 4.9, = 0.41, P < 0.05) and condition (F 1, 7 = 17.9, = 0.72, P < 0.01). The Deoxy[Hb+Mb] was significantly higher in C at the onset of exercise (d = 1.11, P < 0.05) and at 10 (d = 0.69, P < 0.05), 20 (d = 0.45, P < 0.05) and 30 min (d = 0.40, P < 0.05) after the onset. The total [Hb+Mb] showed main effect of time (F 1.6, 11.5 = 16.3, = 0.70, P < 0.001) and no difference was observed between conditions.
Figure 4.
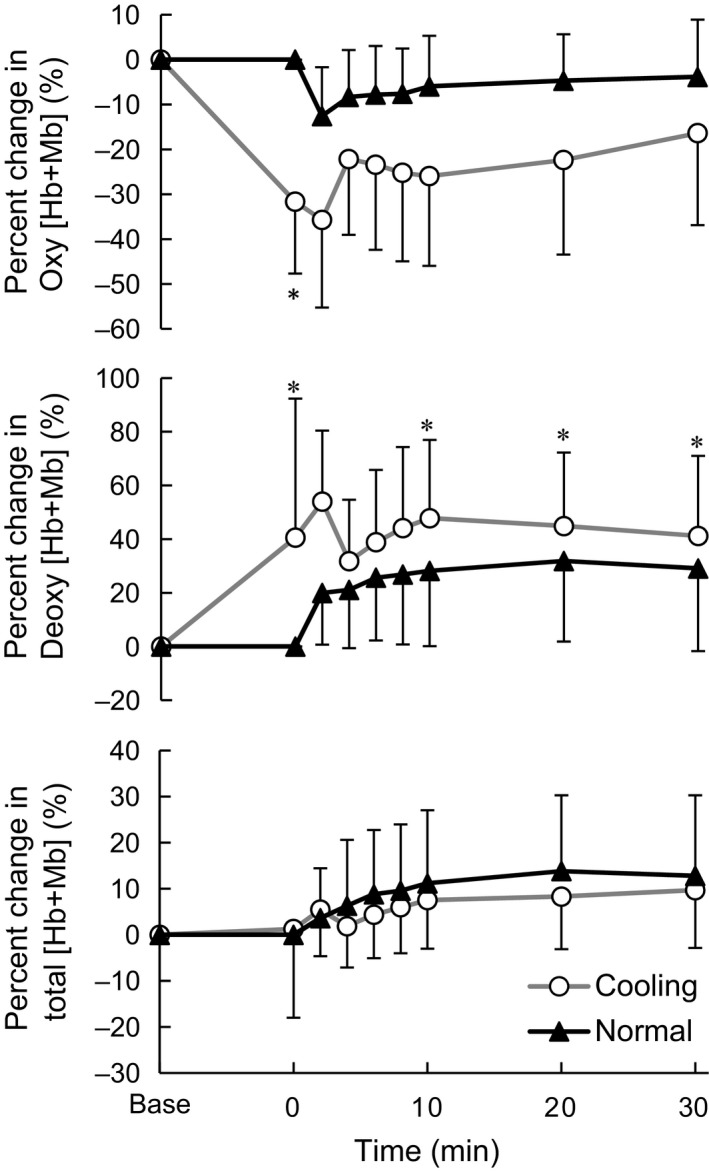
Percent change in the oxy, deoxy, and total hemoglobin and myoglobin in the vastus lateralis. Values are mean ± SD of each cooling and normal condition. *Significant difference between conditions (P < 0.05).
The percent change in StO2 in the vastus lateralis relative to the resting baseline before cooling are shown in Figure 5. StO2 showed a significant main effect of condition (F 1.7, 11.7 = 23.1, = 0.77, P < 0.001) and a significant interaction between those factors (F 2.0, 14.3 = 5.2, = 0.43, P < 0.05). The percent change in StO2 was significantly lower in C at the onset of exercise (d = 2.49, P < 0.05), 2 (d = 1.70, P < 0.05), 8 (d = 1.02, P < 0.05), 10 (d = 1.12, P < 0.05), and 20 min (d = 0.88, P < 0.05) after the onset.
Figure 5.
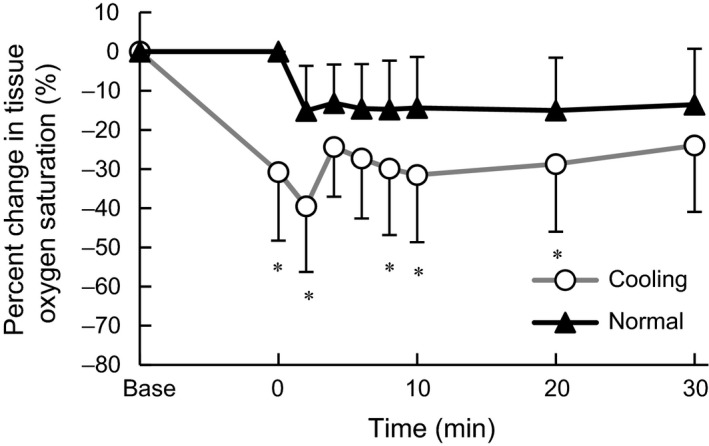
Percent change in the tissue oxygen saturation in the vastus lateralis. Values are mean ± SD of each cooling and normal condition. *Significant difference between conditions (P < 0.05).
Kinetics of pulmonary oxygen uptake and muscle deoxy hemoglobin
The parameters of O2 kinetics during the first 6 min of exercise are shown in Table 1. Compared to N, condition C showed significantly longer time constant of O2 kinetics (τ O2) (d = 1.23, P < 0.05) and MRT (d = 1.23, P < 0.01). There were no significant differences between conditions in O2 (base), Amp, TD, initial 6‐min O2 deficit or ∆O2 (30–base). No difference was observed between Amp (i.e., ∆O2 between baseline and 6 min) and ∆O2 (30–base) (i.e., Amp at the 30th min) in each condition. ∆O2 (6–2) was significantly greater in C (d = 0.97, P < 0.05) and significantly correlated with the La concentration averaged during 2 to 6 min (r = 0.71, P < 0.05). A transient peak in the Deoxy[Hb+Mb] (76.5 ± 33.5%) in the vastus lateralis was observed only in C at 41.3 ± 8.4 sec after onset of exercise. The peak Deoxy[Hb+Mb] in C was significantly correlated with differences between conditions in MRT, initial 6‐min O2 deficit and ∆O2 (6–2) (r = 0.84, 0.74 and 0.80, respectively, P < 0.05, Fig. 6) and tended to be correlated with the τ O2 (r = 0.68, P = 0.06). The percentage of the τ O2 in C relative to N was significantly correlated with the peak Deoxy[Hb+Mb] in C (r = 0.71, P < 0.05).
Table 1.
Oxygen uptake kinetics during the first 6 min of exercise
| Cooling | Normal | |
|---|---|---|
| Baseline (L/min) | 0.41 ± 0.37 [0.15–0.66] | 0.25 ± 0.10 [0.18–0.31] |
| Amplitude (L/min) | 1.28 ± 0.22 [1.13–1.48] | 1.39 ± 0.30 [1.18–1.60] |
| Time delay (sec) | 11.4 ± 10.7 [4.0–18.8] | 16.3 ± 3.2 [14.1–18.5] |
| Time constant (sec) | 39.0 ± 13.7 [29.5–48.5] | 25.7 ± 6.8 [21.0–30.5]a |
| R 2 value of regression curve | 0.84 ± 0.05 [0.81–0.88] | 0.83 ± 0.10 [0.76–0.90] |
| Mean response time (sec) | 45.6 ± 7.8 [40.2–51.0] | 36.1 ± 7.7 [30.7–41.4]a |
| Initial 6‐min O2 deficit (L) | 0.98 ± 0.30 [0.77–1.19] | 0.85 ± 0.28 [0.66–1.04] |
| ∆O2 (6–2) (L/min) | 0.09 ± 0.07 [0.04–0.14] | 0.03 ± 0.03 [0.01–0.05]a |
| ∆O2 (30–base) (L/min) | 1.29 ± 0.30 [1.08–1.50] | 1.47 ± 0.35 [1.23–1.72] |
Values are means ± standard deviation and [95% confidential interval].
Significant difference between conditions (P < 0.05).
∆O2 (6–2) and ∆O2 (30–base): the increment in oxygen uptake between minutes 2 and 6, and between baseline and minute 30.
Figure 6.
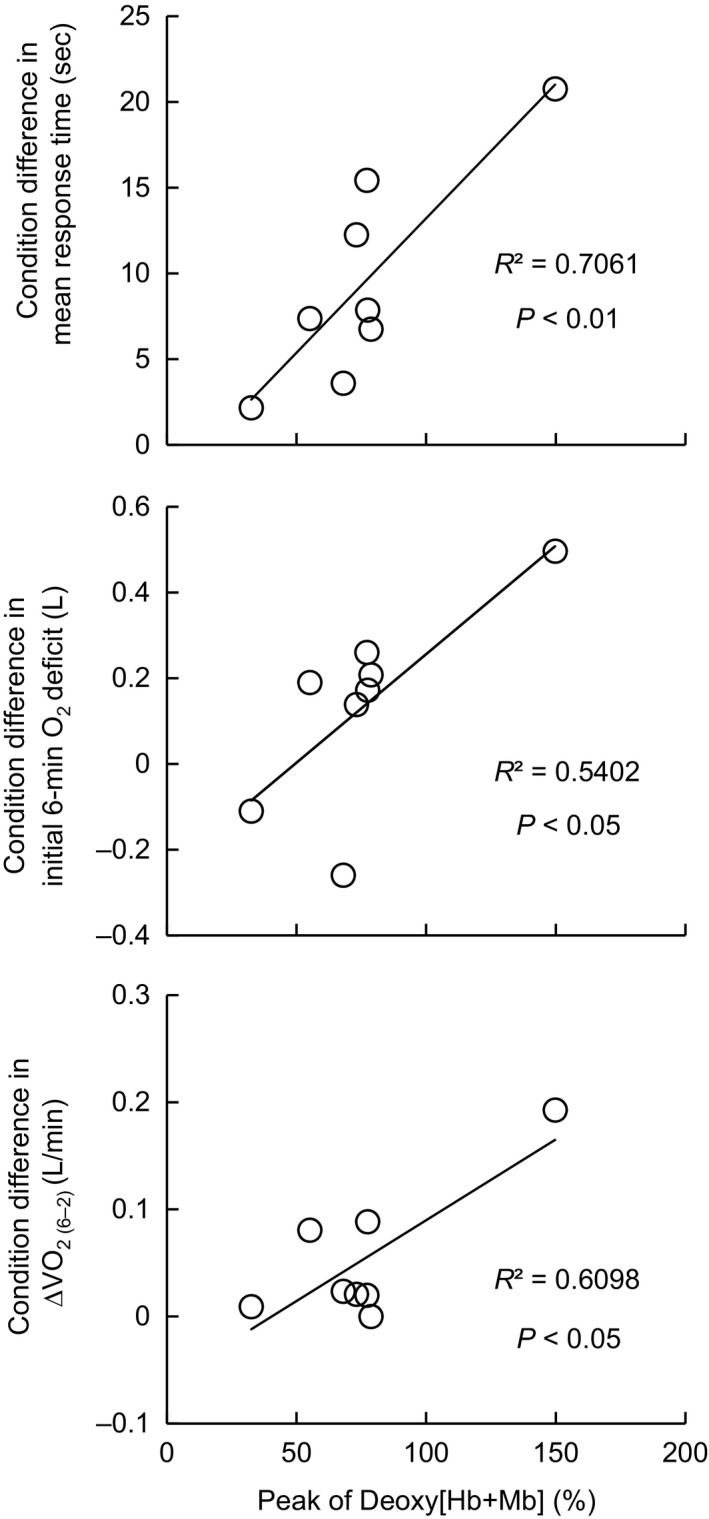
The condition differences in O2 mean response time, initial 6‐min O2 deficit, and ∆O2 (6–2) as a function of the transient peak Deoxy[Hb+Mb] in the vastus lateralis in cooling condition. ∆O2 (6–2): the increment in oxygen uptake between minutes 2 and 6.
Discussion
This study investigated the effect of muscle cooling on pulmonary O2 kinetics and muscle metabolism during exercise at LT work rate. The major finding of the present study was that at the onset of exercise, transient peak muscle deoxygenation was observed in C, which is associated with the delay of pulmonary O2 kinetics relative to N. Additionally, significantly higher La concentration was observed in C compared to N during exercise.
Anaerobic metabolism in hypothermic skeletal muscle
After 30‐min cold immersion, the vastus lateralis T muscle declined to 22.7°C on average, which was below T muscle inducing impairment of muscle endurance and maximal force (Clarke et al. 1958; Heus et al. 1995; Wakabayashi et al. 2015). Since an elevation of La concentration was associated with lowering of T muscle (Figs. 1 and 3), we suggest that the reduction of T muscle would increase recruitment of glycolytic metabolism during exercise. Similar to current observation, greater anaerobic metabolism in cold water was reported in a previous study which showed higher minute ventilation to O2 ratio (VE/O2) during an incremental exercise test in cold (18°C) compared to warm water (Fujimoto et al. 2016). Since we set the LT work rate predetermined in normal condition for both conditions, participants actually exercised at LT work rate (moderate intensity) in N and above LT (heavy intensity) in C. The potential mechanism for the greater contribution of the glycolytic metabolism with hypothermic skeletal muscle is discussed as follows.
In this study no direct measurement of muscle blood flow was conducted; however, cold‐induced muscle vasoconstriction (Rennie et al. 1980) seemed to be one of the major factors inducing the anaerobic metabolism. However, the percent change in the total [Hb+Mb] indicates no difference between conditions in the microvascular Hb volume and muscle O2 diffusion capacity (Fukuoka et al. 2015). The significantly lower StO2 in C might be attributed in part to less blood perfusion in the hypothermic skeletal muscle (Rennie et al. 1980; Thorsson et al. 1985; Gregson et al. 2011) and leftward shift of oxyhemoglobin dissociation curve with lower temperature (Severinghaus 1958; Astrup et al. 1965). The larger increase of Deoxy[Hb+Mb] in C during exercise suggests the lower muscle blood flow/O2 delivery relative to O2 consumption (Koga et al. 2012, 2015). Based on these observations by the NIRS method, less tissue oxygenation (lower StO2) due to lower O2 delivery relative to O2 consumption (higher Deoxy[Hb+Mb]) might induce the greater anaerobic contribution in C. Additionally, lower blood perfusion may also impair the lactate utilization in the skeletal muscle (Gladden et al. 1992; Gladden 2000) resulting in the greater La concentration in C.
In addition to differences in O2 transport to the working muscle due to the cold‐induced muscle vasoconstriction, reduction of T muscle per se slows ATP utilization (Edwards et al. 1972) and slows Ca2+ release and uptake from the sarcoplasmic reticulum (Kossler et al. 1987; Herve et al. 1992). Previous studies have also reported that a greater number of motor units were recruited in cold environment in order to maintain the same work load compared to neutral conditions (Mallette et al. 2018). Because of the greater cold sensitivity and lower power output of slow‐twitch fibers (Ranatunga 1984), fast‐twitch fibers were recruited to a greater extent in a cold environment compared to warm condition even at moderate‐intensity exercise in scup (Rome et al. 1992). Thus, the greater anaerobic contribution with hypothermic skeletal muscle might be attributed to the relatively more recruitment of the fast‐twitch fibers relying more on glycolytic energy transfer, which may be associated to the larger O2 slow component (see below).
Kinetics of oxygen uptake and Deoxy[Hb+Mb] at the onset of exercise
At the onset of exercise (i.e., at the time of the lowest T muscle was recorded), the longer τ O2 and MRT observed in C was consistent with a previous study (Shiojiri et al. 1997). Shiojiri et al. (1997) suggested that the delay of O2 kinetics was due to decreased O2 extraction and/or impairment of oxidative reactions based on similar cardiac output in C and N conditions. In the present study, the transient peak in Deoxy[Hb+Mb] in C indicates possible greater O2 extraction fraction (Koga et al. 2012, 2014) and less oxygen delivery to muscle oxygen uptake. The different interpretation for the O2 extraction between the present and previous studies (Shiojiri et al. 1997) might be attributed to exercise intensity, that was above anaerobic threshold (AT) in the present cooling condition, while below AT in the previous study (Shiojiri et al. 1997). The lower blood flow to the working muscle in cold (Rennie et al. 1980) might have been reflected in the transient peak of Deoxy[Hb+Mb] and the lower StO2 in C (Figs. 4 and 5). The peak Deoxy[Hb+Mb] was correlated with the ∆MRT between conditions and τ O2 in C relative to N. Additionally, the condition differences in O2 deficit and ∆O2 (6–2) were also strongly correlated with the peak Deoxy[Hb+Mb] in C (Fig. 6). Based on these observations, we suggest that the slower O2 kinetics in C would be caused by the limitation of aerobic energy provision due to less blood perfusion in the working muscle. Similar to the present study, Bowen et al. (2013) reported delay of O2 kinetics in hypoxia and correlation with transient peak of skeletal muscle Deoxy[Hb+Mb] assessed using time resolved near‐infrared spectroscopy. In terms of lower O2 delivery to the working muscle, a similar mechanism in the slowed O2 kinetics is plausible in a hypoxic environment and muscle cooling condition. For example, there have been several studies reporting delay of O2 kinetics with interventions to limit O2 delivery to the working muscle (Hughson and Smyth 1983; Hughson et al. 1991; Goodwin et al. 2012).
As explained above, fast‐twitch fibers might be recruited more in the cooling condition (Ranatunga 1984; Rome et al. 1992). Relating to previous studies (Barstow et al. 1996; Pringle et al. 2003) reporting delay of O2 kinetics in participants with a greater percentage of fast‐twitch fibers, slower O2 kinetics observed in C of the present study might indicate the greater recruitment of fast‐twitch fibers in C. Additionally, although the exercise intensity was set at the same absolute work rate for both N and C, the larger ∆O2 (6–2) in C was observed as shown (Table 1). Concerning the significant correlation between the ∆O2 (6–2) and La concentration averaged during 2 to 6 min, the larger recruitment of glycolytic metabolism in C would increase slow component and delay O2 kinetics (Whipp and Wasserman 1986; Wasserman 1987).
Methodological limitation
In this study, we choose the LT work rate predetermined in normal condition for assessing recruitment of anaerobic metabolism with hypothermic skeletal muscle even with a slight increase over the threshold in C. Thus, participants might exercise in moderate and heavy intensity domains in N and C, respectively. It might have been more appropriate to have participants exercising in the moderate‐intensity domain (e.g., at 80% LT) in both conditions to determine whether anaerobic contribution was elevated in C but not in N, and also whether O2 primary kinetics slowed and/or slow component was created in C during moderate‐intensity exercise.
Conclusion
One of the major findings in this study was that exercise with hypothermic skeletal muscle increased recruitment of glycolytic metabolism as shown in the significantly higher blood lactate concentration even at lactate threshold workload that was predetermined in thermoneutral environment. Our second major finding was the delay of oxygen uptake kinetics at the onset of exercise after pre‐cooling and a significant correlation with the transient peak of deoxy hemoglobin in the working muscle.
Conflict of Interest
None declared.
Acknowledgments
The authors wish to thank all those who participated in this study. We also would like to express our thanks to Dr Martin Barwood for English proof reading.
Wakabayashi H., Osawa M., Koga S., Li K., Sakaue H., Sengoku Y., Takagi H.. Effects of muscle cooling on kinetics of pulmonary oxygen uptake and muscle deoxygenation at the onset of exercise. Physiol Rep, 6 (21), 2018, e13910, https://doi.org/10.14814/phy2.13910
Funding Information
This study was supported by a Grant‐in‐Aid for Scientific Research (No. 15K1267105) from the Japan Society for the Promotion of Science and Advanced Research Initiative for Human High Performance (ARIHHP), University of Tsukuba.
References
- Ando, S. , Yamada Y., Kokubu M.. 2010. Reaction time to peripheral visual stimuli during exercise under hypoxia. J. Appl. Physiol. (1985) 108:1210–1216. [DOI] [PubMed] [Google Scholar]
- Astrup, P. , Engel K., Severinghaus J. W., and Munson E.. 1965. The influence of temperature and pH on the dissociation curve of oxyhemoglobin of human blood. Scand. J. Clin. Lab. Invest. 17:515–523. [DOI] [PubMed] [Google Scholar]
- Barstow, T. J. , Jones A. M., Nguyen P. H., and Casaburi R.. 1996. Influence of muscle fiber type and pedal frequency on oxygen uptake kinetics of heavy exercise. J. Appl. Physiol. 81:1642–1650. [DOI] [PubMed] [Google Scholar]
- Bigland‐Ritchie, B. , Donovan E. F., and Roussos C. S.. 1981. Conduction velocity and EMG power spectrum changes in fatigue of sustained maximal efforts. J. Appl. Physiol. Respir. Environ. Exerc. Physiol. 51:1300–1305. [DOI] [PubMed] [Google Scholar]
- Bowen, T. S. , Rossiter H. B., Benson A. P., Amano T., Kondo N., Kowalchuk J. M., et al. 2013. Slowed oxygen uptake kinetics in hypoxia correlate with the transient peak and reduced spatial distribution of absolute skeletal muscle deoxygenation. Exp. Physiol. 98:1585–1596. [DOI] [PubMed] [Google Scholar]
- Clarke, R. S. , Hellon R. F., and Lind A. R.. 1958. The duration of sustained contractions of the human forearm at different muscle temperatures. J. Physiol. 143:454–473. [DOI] [PMC free article] [PubMed] [Google Scholar]
- Crow, M. T. , and Kushmerick M. J.. 1982. Chemical energetics of slow‐ and fast‐twitch muscles of the mouse. J. Gen. Physiol. 79:147–166. [DOI] [PMC free article] [PubMed] [Google Scholar]
- Edwards, R. H. , Harris R. C., Hultman E., Kaijser L., Koh D., and Nordesjo L. O.. 1972. Effect of temperature on muscle energy metabolism and endurance during successive isometric contractions, sustained to fatigue, of the quadriceps muscle in man. J. Physiol. 220:335–352. [DOI] [PMC free article] [PubMed] [Google Scholar]
- Fujimoto, T. , Sasaki Y., Wakabayashi H., Sengoku Y., Tsubakimoto S., and Nishiyasu T.. 2016. Maximal workload but not peak oxygen uptake is decreased during immersed incremental exercise at cooler temperatures. Eur. J. Appl. Physiol. 116:1819–1827. [DOI] [PubMed] [Google Scholar]
- Fukuoka, Y. , Poole D. C., Barstow T. J., Kondo N., Nishiwaki M., Okushima D., et al. 2015. Reduction of VO2 slow component by priming exercise: novel mechanistic insights from time‐resolved near‐infrared spectroscopy. Physiol. Rep. 3:e12432. [DOI] [PMC free article] [PubMed] [Google Scholar]
- Gladden, L. B. 2000. Muscle as a consumer of lactate. Med. Sci. Sports Exerc. 32:764–771. [DOI] [PubMed] [Google Scholar]
- Gladden, L. B. , Crawford R. E., and Webster M. J.. 1992. Effect of blood flow on net lactate uptake during steady‐level contractions in canine skeletal muscle. J. Appl. Physiol. 72:1826–1830. [DOI] [PubMed] [Google Scholar]
- Goodwin, M. L. , Hernandez A., Lai N., Cabrera M. E., and Gladden L. B.. 2012. VO2 on‐kinetics in isolated canine muscle in situ during slowed convective O2 delivery. J. Appl. Physiol. 112:9–19. [DOI] [PubMed] [Google Scholar]
- Gregson, W. , Black M. A., Jones H., Milson J., Morton J., Dawson B., et al. 2011. Influence of cold water immersion on limb and cutaneous blood flow at rest. Am. J. Sports Med. 39:1316–1323. [DOI] [PubMed] [Google Scholar]
- Herve, J. C. , Yamaoka K., Twist V. W., Powell T., Ellory J. C., and Wang L. C.. 1992. Temperature dependence of electrophysiological properties of guinea pig and ground squirrel myocytes. Am. J. Physiol. 263:R177–R184. [DOI] [PubMed] [Google Scholar]
- Heus, R. , Daanen H. A., and Havenith G.. 1995. Physiological criteria for functioning of hands in the cold: a review. Appl. Ergon. 26:5–13. [DOI] [PubMed] [Google Scholar]
- Holm, S. 1979. A Simple Sequentially Rejective Multiple Test Procedure. Scand. J. Stat. 6:65–70. [Google Scholar]
- Hughson, R. L. , and Smyth G. A.. 1983. Slower Adaptation of VO2 to steady state of submaximal exercise with beta‐blockade. Eur. J. Appl. Physiol. 52:107–110. [DOI] [PubMed] [Google Scholar]
- Hughson, R. L. , Xing H. C., Borkhoff C., and Butler G. C.. 1991. Kinetics of ventilation and gas exchange during supine and upright cycle exercise. Eur. J. Appl. Physiol. 63:300–307. [DOI] [PubMed] [Google Scholar]
- Kashima, S. 2003. Spectroscopic measurement of blood volume and its oxygenation in a small volume of tissue using red laser lights and differential calculation between two point detections. Opt. Laser Technol. 35:485–489. [Google Scholar]
- Koga, S. , Kano Y., Barstow T. J., Ferreira L. F., Ohmae E., Sudo M., et al. 2012. Kinetics of muscle deoxygenation and microvascular PO2 during contractions in rat: comparison of optical spectroscopy and phosphorescence‐quenching techniques. J. Appl. Physiol. (1985) 112:26–32. [DOI] [PubMed] [Google Scholar]
- Koga, S. , Rossiter H. B., Heinonen I., Musch T. I., and Poole D. C.. 2014. Dynamic heterogeneity of exercising muscle blood flow and O2 utilization. Med. Sci. Sports Exerc. 46:860–876. [DOI] [PubMed] [Google Scholar]
- Koga, S. , Barstow T. J., Okushima D., Rossiter H. B., Kondo N., Ohmae E., et al. 2015. Validation of a high‐power, time‐resolved, near‐infrared spectroscopy system for measurement of superficial and deep muscle deoxygenation during exercise. J. Appl. Physiol. (1985) 118:1435–1442. [DOI] [PubMed] [Google Scholar]
- Kossler, F. , Lange F., and Kuchler G.. 1987. Isometric twitch and tetanic contraction of frog skeletal muscles at temperatures between 0 to 30 degrees C. Biomed. Biochim. Acta 46:809–813. [PubMed] [Google Scholar]
- Mallette, M. M. , Green L. A., Gabriel D. A., and Cheung S. S.. 2018. The effects of local forearm muscle cooling on motor unit properties. Eur. J. Appl. Physiol. 118:401–410. [DOI] [PubMed] [Google Scholar]
- Mucke, R. , and Heuer D.. 1989. Behaviour of EMG‐parameters and conduction velocity in contractions with different muscle temperatures. Biomed. Biochim. Acta 48:S459–S464. [PubMed] [Google Scholar]
- Newell, J. , Higgins D., Madden N., Cruickshank J., Einbeck J., McMillan K., et al. 2007. Software for calculating blood lactate endurance markers. J. Sports Sci. 25:1403–1409. [DOI] [PubMed] [Google Scholar]
- Oksa, J. , Rintamaki H., and Rissanen S.. 1997. Muscle performance and electromyogram activity of the lower leg muscles with different levels of cold exposure. Eur. J. Appl. Physiol. 75:484–490. [DOI] [PubMed] [Google Scholar]
- Petrofsky, J. , and Laymon M.. 2005. Muscle temperature and EMG amplitude and frequency during isometric exercise. Aviat. Space Environ. Med. 76:1024–1030. [PubMed] [Google Scholar]
- Pringle, J. S. , Doust J. H., Carter H., Tolfrey K., Campbell I. T., Sakkas G. K., et al. 2003. Oxygen uptake kinetics during moderate, heavy and severe intensity “submaximal” exercise in humans: the influence of muscle fibre type and capillarisation. Eur. J. Appl. Physiol. 89:289–300. [DOI] [PubMed] [Google Scholar]
- Racinais, S. , and Oksa J.. 2010. Temperature and neuromuscular function. Scand. J. Med. Sci. Sports 20(Suppl 3):1–18. [DOI] [PubMed] [Google Scholar]
- Ranatunga, K. W. 1984. The force‐velocity relation of rat fast‐ and slow‐twitch muscles examined at different temperatures. J. Physiol. 351:517–529. [DOI] [PMC free article] [PubMed] [Google Scholar]
- Rennie, D. , Park Y., Veicsteinas A., and Pendergast D.. 1980. Metabolic and circulatory adaptation to cold water stress Pp. 315–321 in Cerretelli P. and Whipp B. J., eds. Exercise bioenergetics and gas exchange. Elsevier/North‐Holland Biomedical Press, Amsterdam, The Netherlands. [Google Scholar]
- Rome, L.C. , Choi I. H., Lutz G., and Sosnicki A.. 1992. The influence of temperature on muscle function in the fast swimming scup. I. Shortening velocity and muscle recruitment during swimming. J. Exp. Biol. 163:259–279. [DOI] [PubMed] [Google Scholar]
- Severinghaus, J. W. 1958. Oxyhemoglobin dissociation curve correction for temperature and pH variation in human blood. J. Appl. Physiol. 12:485–486. [DOI] [PubMed] [Google Scholar]
- Shiojiri, T. , Shibasaki M., Aoki K., Kondo N., and Koga S.. 1997. Effects of reduced muscle temperature on the oxygen uptake kinetics at the start of exercise. Acta Physiol. Scand. 159:327–333. [DOI] [PubMed] [Google Scholar]
- Sietsema, K. E. , Ben‐Dov I., Zhang Y. Y., Sullivan C., and Wasserman K.. 1994. Dynamics of oxygen uptake for submaximal exercise and recovery in patients with chronic heart failure. Chest 105:1693–1700. [DOI] [PubMed] [Google Scholar]
- Thorsson, O. , Lilja B., Ahlgren L., Hemdal B., and Westlin N.. 1985. The effect of local cold application on intramuscular blood flow at rest and after running. Med. Sci. Sports Exerc. 17:710–713. [DOI] [PubMed] [Google Scholar]
- Togawa, T. , Nemoto T., Yamazaki T., and Kobayashi T.. 1976. A modified internal temperature measurement device. Med. Biol. Eng. 14:361–364. [DOI] [PubMed] [Google Scholar]
- Wakabayashi, H. , Oksa J., and Tipton M. J.. 2015. Exercise performance in acute and chronic cold exposure. J. Phys. Fit. Sports Med. 4:177–185. [Google Scholar]
- Wakabayashi, H. , Wijayanto T., and Tochihara Y.. 2017. Neuromuscular function during knee extension exercise after cold water immersion. J. Physiol. Anthropol. 36:28. [DOI] [PMC free article] [PubMed] [Google Scholar]
- Wasserman, K . 1987. Determinants and detection of anaerobic threshold and consequences of exercise above it. Circulation 76:VI29–VI39. [PubMed] [Google Scholar]
- Whipp, B. J. , and Wasserman K.. 1986. Effect of anaerobiosis on the kinetics of O2 uptake during exercise. Fed. Proc. 45:2942–2947. [PubMed] [Google Scholar]
- Yamakage, M. , and Namiki A.. 2003. Deep temperature monitoring using a zero‐heat‐flow method. J. Anesth. 17:108–115. [DOI] [PubMed] [Google Scholar]


