

Abstract
Key points
Insulin sensitivity (as determined by a hyperinsulinaemic‐euglyceamic clamp) decreased 15% after reduced activity. Despite not fully returning to baseline physical activity levels, insulin sensitivity unexpectedly, rebounded above that recorded before 2 weeks of reduced physical activity by 14% after the recovery period.
Changes in insulin sensitivity in response to reduced activity were primarily driven by men but, not women.
There were modest changes in ceramides (nuclear/myofibrillar fraction and serum) following reduced activity and recovery but, in the absence of major changes to body composition (i.e. fat mass), ceramides were not related to changes in inactivity‐induced insulin sensitivity in healthy older adults.
Abstract
Older adults are at risk of physical inactivity as they encounter debilitating life events. It is not known how insulin sensitivity is affected by modest short‐term physical inactivity and recovery in healthy older adults, nor how insulin sensitivity is related to changes in serum and muscle ceramide content. Healthy older adults (aged 64–82 years, five females, seven males) were assessed before (PRE), after 2 weeks of reduced physical activity (RA) and following 2 weeks of recovery (REC). Insulin sensitivity (hyperinsulinaemic‐euglyceamic clamp), lean mass, muscle function, skeletal muscle subfraction, fibre‐specific, and serum ceramide content and indices of skeletal muscle inflammation were assessed. Insulin sensitivity decreased by 15 ± 6% at RA (driven by men) but rebounded above PRE by 14 ± 5% at REC. Mid‐plantar flexor muscle area and leg strength decreased with RA, although only muscle size returned to baseline levels following REC. Body fat did not change and only minimal changes in muscle inflammation were noted across the intervention. Serum and intramuscular ceramides (nuclear/myofibrillar fraction) were modestly increased at RA and REC. However, ceramides were not related to changes in inactivity‐induced insulin sensitivity in healthy older adults. Short‐term inactivity induced insulin resistance in older adults in the absence of significant changes in body composition (i.e. fat mass) are not related to changes in ceramides.
Keywords: aging, physical inactivity, metabolism, reduced activity
Key points
Insulin sensitivity (as determined by a hyperinsulinaemic‐euglyceamic clamp) decreased 15% after reduced activity. Despite not fully returning to baseline physical activity levels, insulin sensitivity unexpectedly, rebounded above that recorded before 2 weeks of reduced physical activity by 14% after the recovery period.
Changes in insulin sensitivity in response to reduced activity were primarily driven by men but, not women.
There were modest changes in ceramides (nuclear/myofibrillar fraction and serum) following reduced activity and recovery but, in the absence of major changes to body composition (i.e. fat mass), ceramides were not related to changes in inactivity‐induced insulin sensitivity in healthy older adults.
Introduction
Metabolic dysfunction and muscle atrophy are two prominent consequences of physical inactivity. Older adults have a greater probability of becoming physically inactive as a result of unavoidable crisis events in life (e.g. sickness, hospitalization) (Gill et al. 2001) and, as such, are at risk of the development of diabetes and possibly the development of muscle sarcopenia (Gill et al. 2001; Bell et al. 2016). The molecular and cellular events underlying these negative consequences of physical inactivity in older adults are largely unknown, thus impeding the development of effective therapeutic interventions.
Our laboratory has explored the role for localized skeletal muscle inflammation and lipid intermediate accumulation (i.e. ceramides) as potential contributors of some of the inactivity‐induced consequences on health (Kwon et al. 2015, 2016). These findings with respect to physical inactivity/disuse are intriguing because increased skeletal muscle Toll‐like receptor 4 (TLR4), inflammation and ceramide are mechanistically linked to the pronounced metabolic disturbances, such as diabetes and subsequent insulin resistance caused by diet (Dasu et al. 2010; Frisard et al. 2010), as suggested by rodent research (Summers & Goodpaster, 2016; Chaurasia & Summers, 2018). However, such data in humans are inconsistent (Skovbro et al. 2008; Bosma et al. 2012; Petersen & Jurczak, 2016). Although many rodent studies have shown ceramide accumulation with muscle disuse (Bryndina et al. 2014; Lee et al. 2015; Kwon et al. 2016; Bryndina et al. 2018), a recent clinical trial demonstrated that skeletal muscle lipid intermediates did not increase after 7 days of bed rest in young healthy adults (Dirks et al. 2016). However, gaps with respect to unravelling the relationship between ceramides and inactivity‐induced insulin resistance remain. First, Dirks et al. (2016) did not provide correlative data between measures of insulin sensitivity and these intermediates. Second, it was recently reported that intramuscular (im) subcellular localization of ceramide is important for maximizing the sensitivity of its relationship with insulin resistance (Perreault et al. 2018) and, as such, these ceramides have not been examined with such specificity during physical inactivity. Insulin sensitivity using the gold standard, hyperinsulinaemic‐euglyceamic clamps, has not been assessed during and after reduced activity (RA) in older adults (Bell et al. 2016). Lastly, older adults have a greater probability of accumulating skeletal muscle ceramides compared to younger adults (Rivas et al. 2012). Thus, we speculate that the relationship between inactivity‐induced insulin resistance and ceramides may be more apparent in the context of ageing, as investigated in the present study using hyperinsulinaemic‐euglyceamic clamps, along with a comprehensive evaluation of fibre‐specific ceramides, ceramide intramuscular subfractions and serum.
Therefore, the present study aimed to investigate changes in insulin sensitivity, muscle ceramide content and muscle inflammatory signalling (TLR4‐related) after a 2‐week period of sedentary behaviour (RA) and after a 2‐week period of a return to normal ambulatory activity. As an exploratory objective, we investigated the differences between men and women after physical inactivity and recovery (REC) because sex‐based differences following inactivity and ambulatory REC in healthy older adults are relatively unknown. We hypothesized that 2 weeks of physical inactivity in older adults would reduce insulin sensitivity and increase ceramides and inflammatory signalling and that these responses would be restored to baseline levels following a return to normal physical activity. Second, changes in insulin sensitivity were hypothesized to correlate with changes in serum and muscle ceramides.
Methods
General experimental design (Fig. 1)
Figure 1. Experimental design and step counts.
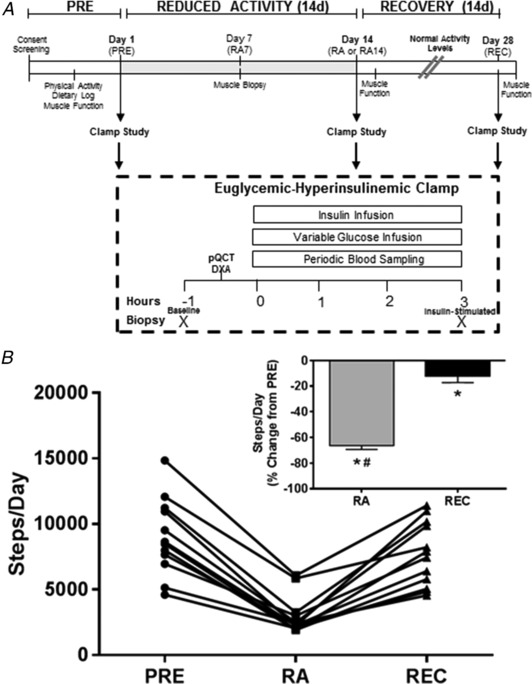
A, experimental design for the 2‐week RA and REC study. B, daily step counts in healthy older adults (n = 12) at baseline (PRE), after the 2 week RA and after normal ambulatory REC periods. Percentage change, from PRE, of step counts (inset). *Different from PRE (P < 0.05). #Different from RA (P < 0.05). Data are the mean ± SEM.
Healthy older adults were assessed for muscle and metabolic end‐points with respect to four periods: Before (PRE), walking step reduction of physical activity at 7 (RA7) and 14 days (RA14: decrease of 75% of normal activity) and following 14 days of REC to baseline physical activity level. Measurements at each of these periods included muscle function (isometric knee and ankle strength and leg power), lean mass and mid‐calf muscle area [dual‐energy X‐ray absorptiometry (DXA) and peripheral quantitative computed tomography (pQCT)] and insulin sensitivity (hyperinsulinaemic‐euglyceamic clamp) coupled with muscle biopsies for im sphingolipids and indices of muscle inflammatory markers associated with the TLR4 signalling pathway. In the case of RA7, only a muscle biopsy was collected.
Subjects
We recruited 12 (seven males and five females) healthy, community dwelling, glucose tolerant subjects from the Salt Lake City area between the ages of 60–85 years and with a body mass index (BMI) <30 kg m−2. Healthy subjects were recruited and screened similarly as reported previously (Reidy et al. 2018). All subjects provided their written informed consent. The study was approved by the University of Utah Institutional Review Board (no. 00084354) and conformed with the Declaration of Helsinki and Title 45, US Code of Federal Regulations, Part 46, ‘Protection of Human Subjects’. This study was registered at the clinical trials registry at ClinicalTrials.org (NCT02971098).
RA and REC period
After completion of the first hyperinsulinaemic‐euglyceamic clamp experiment (day 1 – PRE), participants were instructed to adhere to 14 days of reduced physical activity at their home as conducted previously (Krogh‐Madsen et al. 2010; Breen et al. 2013). The goal was for the participant to reduce their daily step counts by 75% of their baseline (PRE) activity levels as determined by the accelerometer given to the subject and worn for 2 weeks before PRE. The participants were informed that their normal diet should remain unaltered during the RA and REC periods. Following the hyperinsulinaemic‐euglyceamic clamp study (day 14 – RA14), all participants were asked to return to their day‐to‐day habitual activities (e.g. walking). After the 14 day REC period (day 28 – REC), subjects underwent a final hyperinsulinaemic‐euglyceamic clamp study coupled with muscle biopsies. Muscle function [strength, power and 6 min walk test (6MW)] were re‐assessed similarly afterwards.
Physical activity monitoring and baseline dietary record
Subjects were given a step activity monitor (Omron, Kyoto, Japan) to measure their step count at PRE and for use as feedback during the RA and REC periods. The habitual dietary assessment was measured ∼2 weeks prior to PRE and was recorded over a 3 day period using the Automated Self‐Administered 24 h dietary recall (ASA‐24) offered by the National Cancer Institute (Rockville, MD, USA). The participant was instructed by a research team member on how to properly conduct this reporting. Caloric and macronutrient intake was later calculated using Food Processor Nutrition Analysis software (ESHA Research Inc., Salem, OR, USA). Participants were verbally encouraged to maintain their normal dietary habits during the RA and REC periods.
Lean mass and mid‐plantar flexor muscle area and muscle function
Total and leg lean mass and mid‐plantar flexor muscle area were assessed via DXA and pQCT, respectively, and were conducted by a trained technician at the University of Utah's Center for Clinical and Translational Sciences, Clinical Research Unit (CCTS). These tests were performed prior to the hyperinsulinaemic‐euglyceamic clamp studies but after the baseline muscle biopsy (Fig. 1). Muscle function tests were performed after the biopsies for RA and REC but not after PRE. Mid‐plantar flexor muscle area was conducted (Stevenson et al. 2009) and muscle function was assessed via knee extension strength, knee extension power and the 6MW. These tests occurred before the RA protocol and were repeated within 24 h after completing the RA and REC period. Isometric strength was assessed unilaterally in both legs with maximal voluntary isometric (at a 60° knee angle) contractions produced by the knee extensors and plantar and dorsi flexor muscles (at a 0° angle) on a dynamometer (Humac Norm; CSMi Solutions, Stoughton, MA, USA). For lower extremity extension power testing, a Nottingham power rig (Queen's Medical Centre, Nottingham, UK) was used. Finally, the strength and power tests were followed by the 6MW (Reidy et al. 2018).
Hyperinsulinaemic‐euglyceamic clamp and muscle biopsies
For measurements of insulin sensitivity, subjects arrived in the morning at the CCTS after an overnight fast, completed a DXA and pQCT scan, underwent a baseline thigh muscle biopsy (see below), and then participated in a ∼3 h hyperinsulinaemic‐euglyceamic clamp (Marcus et al. 2013). To assess insulin sensitivity during the clamp, insulin was infused at a constant rate of 80 mU m−2 min−1 (Coker et al. 2014). This insulin dose was used to determine insulin resistance primarily at the skeletal muscle level (DeFronzo et al. 1981; Coker et al. 2014). Serum blood glucose samples were assessed at 5 min intervals and the glucose infusion rate (mL min−1) was adjusted accordingly to target a 5 mmol L−1 blood glucose concentration. The steady‐state period was defined as a constant glucose infusion rate held for 30 min. Vastus lateralis muscle biopsies (5 mm Bergström needle with manual suction) (Reidy et al. 2018) were sampled (∼150 mg) on the right thigh before and then on the left thigh after the clamp for measurement of fasting and insulin‐stimulated im sphingolipids and muscle cell inflammatory signalling end‐points associated with TLR4 signalling. A portion of the muscle sample was prepared for histological examination (fibre‐type cross‐sectional area and fibre‐specific ceramide content) and frozen in liquid nitrogen cooled isopentane. The remaining muscle sample was quickly dissected of visible connective tissue and fat, rinsed with saline, and then frozen in liquid nitrogen and stored at ‐80°C for immunoblotting and lipidomic analysis. The DXA and pQCT scans and hyperinsulinaemic‐euglyceamic clamp with muscle biopsies were repeated similarly at 14 days (RA14) of reduced‐activity and following return to habitual physical activity (REC). Insulin sensitivity data (glucose infusion rate) are reported as mg kg−1 lean mass min−1 or percent change.
Serum glucose and insulin
Serum collected during the clamp was assessed for glucose using a standard glucose analyser (YSI, Yellow Springs, OH, USA). Serum insulin (EMD Millipore, Billerica, MA, USA) was determined at baseline and at the final time point of the clamp.
Serum and skeletal muscle lipid extraction
Lipids were extracted from 10–30 mg of muscle tissue and homogenized with beads in 300 μL of ice‐cold PBS (pH 7.4) for 5 min at 4°C. Serum lipids were extracted from 20 μL of baseline serum mixed in in 200 μL of ice‐cold PBS. Each sample was spiked with internal standards to quantify levels of individual lipids. These standards were obtained from Avanti Polar Lipids (Alabaster, AL, USA) and included C17 ceramide (d18:1/17:0) N‐heptadecanoyl‐d‐erythro‐sphingosine (#860517), C17 sphingomyelin (d18:1/17:0) N‐heptadecanoyl‐d‐erythro‐sphingosylphosphorylcholine (#860585), C18:1 dihydroceramide (d18:0/18:1(9Z)) | 860624 and lactosyl (ß) C24 ceramide N‐(tetracosanoyl)‐1‐ß‐lactosyl‐sphing‐4‐ene (#110762). After 15 min of incubation in chilled methanol with a brief vortex every 5 min, samples were pelleted at 15,000 g for 5 min at 4°C. The supernatant was removed and mixed with 30 μL of 1 m KOH (in methanol). Following overnight incubation at 50°C in a sand bath, the samples were concentrated in a speedvac at room temperature to ∼200–300 uL of the remaining sample. Next, 25 μL of glacial acetic acid, 300 μL of ddH2O and 500 μL of liquid chromatography (LC) grade methyl tertiary‐butyl ether were added, vortexed and pelleted at 15,000 g for 2 min at 4°C. The last step was repeated without the addition of ddH2O and then the samples were completely dehydrated in a speedvac at RT for 4 h and stored at −20°C until LC‐mass spectrometry (MS) analysis.
Skeletal muscle subfraction lipid extraction
Skeletal muscle subfraction lipids were extracted from 31.9 ± 12.9 mg of muscle tissue and homogenized in a glass mortar and pestle on ice in 20× volume of freshly made ice‐cold sucrose (0.3 m) Hepes (0.5 m) buffer. Samples were lightly homogenized in buffer and incubated on ice for 10 min on ice. Thereafter, samples were homogenized for exactly 45 seconds at 800 r.p.m., followed by 30 min of incubation on ice and a repeat homogenization for 5 s at 800 r.p.m. to ensure thorough lysis. Homogenate was centrifuged at 4°C for 10 min at 1.3 g to yield a nuclear/myofibrillar pellet. To remove residual supernatant from the pellet tube, excess supernatant was extracted after a repeat spin (5 min). Supernatant collected from the initial spin was placed in a new tube and centrifuged at 4°C for 20 min at 20.0 g separate a mitochondrial/reticulum/plasma membrane enhanced pellet from cytoplasmic supernatant. To remove residual cytoplasmic supernatant from the pellet tube, excess supernatant was extracted after a repeat spin (5 min). The nuclear/myofibrillar pellet was resuspended in same volume used for lysis of tissue, whereas the mitochondrial/reticulum/plasma membrane enhanced pellet was resuspened in 65 μL of lysis buffer with vigorous pipetting and vortexing. Then, 10 μL of each fraction was taken for assessment of protein content (Bradford) and some aliquots were taken for immunoblot verification of fraction enrichment. Sample volumes submitted for lipid extraction were 200 μL of the nuclear/myofibrillar fraction and 50 μL each of the mitochondrial/reticulum/plasma membrane enhanced and cytoplasmic fractions. Each sample was spiked with internal standards in methanol mixed with 200 μL of ice cold PBS to quantify the levels of individual lipids. These standards were obtained from Avanti Polar Lipids and included C17 ceramide (d18:1/17:0) (#860517), C17 sphingomyelin (d18:1/17:0) (#860585), C18:1 dihydroceramide (d18:0/18:1(9Z)) | (#860624) C16 ceramide‐d7 (d18:1‐d7/16:0) | (#860676), C18 ceramide‐d7 (d18:1‐d7/18:0) | (#860677), C24 ceramide‐d7 (d18:1‐d7/24:0) | (#860678), C24:1 ceramide‐d7 (d18:1‐d7/24:1(15Z)) (#860679) and diacylglycerol 15:0‐18:1‐d7 (#791647). Following addition of 225 μL of ice cold methanol and 750 μL of methyl tert‐butyl ether, samples were incubated at 4°C for 15 min on an orbital shaker. Next, samples were pelleted at 15,000 g for 10 min at 4°C. The top 70% of the upper phase was removed and then the samples were completely dehydrated in a speedvac at 37°C and stored at −20°C until LC‐MS analysis.
LC‐MS analysis
Before analysis, lipid extracts were resuspended in 200 μL of HPLC grade methanol, pelleted and the clear supernatant was transferred to glass vials. Lipid extracts were separated on an Acquity UPLC CSH C18 1.7 μm 2.1 × 50 mm (Waters, Milford, MA, USA) column maintained at 60°C connected to an Agilent HiP 1290 Sampler and Agilent 1290 Infinity pump, equipped with an Agilent 1290 Flex Cube and an Agilent 6490 triple quadrupole mass spectrometer (Agilent Technologies Inc., Santa Clara, CA, USA). Sphingolipids were detected using dynamic multiple reaction monitoring in positive ion mode. Source gas temperature was set to 210°C, with a gas (N2) flow of 11 L min−1 and a nebulizer pressure of 30 psi. Sheath gas temperature was 400°C, sheath gas (N2) flow was 12 L min−1, capillary voltage was 4000 V, nozzle voltage was 500 V, high pressure RF was 190 V and low pressure RF was 120 V. The injection volume was 2 μL and the samples were analysed in a randomized order with the pooled quality control sample injection eight times throughout the sample queue. Mobile phase A consists of ACN:H2O (60:40 v/v) in 10 mm ammonium formate and 0.1% formic acid, and mobile phase B consists of IPA:ACN:H2O (90:9:1 v/v) in 10 mm ammonium formate and 0.1% formic acid. The chromatography gradient started at 15% mobile phase B, increased to 30% B over 1 min, increased to 60% B from 1–2 min, increased to 80% B from 2–10 min, and increased to 99% B from 10–10.2 min, where it was held until 14 min. Post‐time was 5 min and the flow rate was 0.35 mL min−1 throughout. Collision energies and cell accelerator voltages were optimized using sphingolipid standards with dynamic multiple reaction monitoring transitions as [M+H]+→[m/z = 284.3] for dihydroceramides, [M‐H2O+H]+→[m/z = 264.2] for ceramides and [M+H]+→[m/z = 184.4] for all sphingomyelins. Sphingolipids without available standards were identified based on high resolution LC/MS, quasi‐molecular ion and characteristic product ions. Their retention times were either taken from high resolution LC/MS data or inferred from the available sphingolipid standards. The results from LC‐MS experiments were collected using an Agilent Mass Hunter Workstation and analysed using the software package Agilent Mass Hunter Quant B.07.00. Sphingolipids were quantitated based on peak area ratios to the standards added to the samples prior to extraction. Serum and skeletal muscle subfraction lipid samples were processed as one batch each. Because participant samples for whole homogenate muscle sphingolipids were processed and run as separate batches (i.e. a batch was composed of samples from four subjects), absolute values of lipids were not comparable between runs. Therefore, we calculated the data as the change across baseline and in response to insulin stimulation. To examine baseline changes during the intervention, data are reported as a percentage of PRE baseline or percentage of RA baseline, with PRE or RA baseline set to 100. Values for insulin stimulation are reported as a percentage of baseline levels during each period (PRE, RA and REC was set to 100).
Immunoblotting
Proteins related to the inflammation and stress signalling pathways associated with TLR4 signalling were determined within the baseline and insulin stimulated muscle biopsy sample using standard western blotting procedures as described previously (Drummond et al. 2013; Tanner et al. 2015). Frozen muscle biopsy samples (∼30 mg) were homogenized 1:10 (w/v) using a glass tube and mechanically‐driven pestle grinder in an ice cold buffer containing 50 mm Tris (pH 7.5), 250 mm mannitol, 40 mm NaF, 5 mm pyrophosphate, 1 mm EDTA, 1 mm EGTA and 1% Triton X‐100 with a protease inhibitor cocktail. Homogenates were centrifuged at 9.6 g for 10 min at 4°C. After centrifugation, the upper phase (supernatant) was collected and the protein concentration was determined using a modified Bradford protein assay and measured with a spectrophotometer (EPOCH; BioTek, Winooski, VT, USA). Proteins from the supernatant fraction were separated via PAGE (7.5% or 12%), transferred onto a polyvinylidene difluoride membrane, and incubated with primary and secondary antibodies directed against the proteins of interest. Chemiluminescence reagent (ECL Plus, Thermo Scientific, Waltham, MA, USA) was applied to each blot for 5 min. Membranes were exposed on a ChemiDoc XRS (Bio‐Rad, Hercules, CA, USA) and quantified with Image Lab software (Bio‐Rad). Membranes containing phosphodetected proteins were stripped (25 mm glycine, pH 2.0 and 1% SDS) of primary and secondary antibodies and then re‐probed for total protein. PRE baseline and insulin‐stimulated samples for PRE, RA7 (only baseline), RA14 and REC were loaded onto a single gel/participant. Additional wells on the gel were complemented with a molecular ladder. Data from phosphospecific proteins were normalized to total protein levels of the target protein, whereas total proteins were normalized to GAPDH. To examine baseline changes during the intervention, data are reported as the fold change from PRE baseline, with PRE baseline set to 1. Data for insulin stimulation are reported as the fold change from baseline levels with the baseline at each time point set to 1.
Antibodies
The specific antibodies (Cell Signaling Technologies, Danvers, MA, USA) (diluted in 5% BSA or 2% non‐fat dry milk) used to detect target proteins were: phospho‐AKT (Ser473, dilution 1:500; #9271), total AKT (dilution 1:1000, #9272), phospho‐p38 (Thr180/Tyr182, dilution 1:1000; #4511), total p38 (dilution 1:1000, #8690), total Ikβα (dilution 1:1000; #9242) and GAPDH (dilution 1:20,000). TLR4 was purchased from Santa Cruz Biotechnology (Santa Cruz, CA, USA; dilution 1:4000; sc‐293072) and SPT2 was purchased from Abcam (Cambridge, MA, USA; dilution 1:2000; ab23696). Secondary antibodies (dilution 1:6000) were purchased from Santa Cruz Biotechnology.
Immunofluorescence
Samples were removed from the cork at −25°C in a Microtome PLUS (Triangle Biomedical Sciences, Durham, NC, USA) where they were cut into 8 μm cross‐sections. Baseline and insulin‐stimulated muscle samples at PRE, RA7 (only baseline), RA14, and REC for the same subject were placed on the same slide (Fisherbrand Superfrost/Plus microscope slides; Fisher Scientific Co., Pittsburgh, PA, USA). Following cutting, a hydrophobic marker (H‐4000; Vector Laboratories, Burlingame, CA, USA) separated the sections, which were dried at room temperature and then stored at −20°C until staining. Myofibre myosin heavy chain (MHC) type, ceramide content and cross‐sectional areas (CSA) were then determined: slides were fixed for at least 30 min at room temperature in 2% depolymerized paraformaldehyde supplemented with 0.15% picric acid in 0.1 m Sorensen's phosphate buffer. After washes, sections were incubated for 60 min in anti‐ceramide IgM antibody (C8104; dilution 1:100; Sigma, St Louis, MO, USA) and washed. Next, incubation for 30 min with goat anti‐mouse IgM Iconjugated to biotin (M31515; dilution 1:1000; Invitrogen, Carlsbad, CA, USA) was followed by a washing set and then 60 min of incubation of Streptevadin‐Dylight 549 (SA‐5549; dilution 1:500; Vector Laboratories) and anti‐MHC2a antibody (type 2a myofibres: SC.71 IgG1; dilution 1:75; Developmental Studies Hybridoma Bank, Iowa City, IA, USA). After another wash, sections were incubated with goat anti‐mouse IgG1, Alexa Fluor 647 conjugated 2˚Ab (Cat#A21240; dilution 1:500; Invitrogen) and WGA 488 (dilution 1:50). All antibody dilutions and washes were conducted with immunobuffer (50 mm glycine, 0.25% BSA, 0.03% saponin and 0.05% sodium azide in PBS) as reported in Nordby et al. (2010). Slides were mounted with fluorescence mounting media (H‐4000; Vector Laboratories) and dried before imaging. All images were captured, under identical LUT settings, at 100× magnification using a fluorescence microscope (a fully automated Ti‐E inverted widefield microscope; Nikon, Tokyo, Japan; along with a high sensitivity Andor Clara CCD camera; Oxford Instruments, Abingdon, UK) with Nikon NIS‐Elements multiplatform acquisition software. Image processing and analysis was conducted using Fiji (Image J; NIH, Bethesda, MD, USA) and SMASH (Smith & Barton, 2014). For each image, the numbers of muscle fibres for pure MHC type IIa (purple‐converted to blue in Fiji for analysis in SMASH) and MHC I (negative stain) were counted, and CSA for MHC type IIa+ and IIa− (possible MHC I) fibres were measured. For the ceramide analysis, brightness and contrast was set at a constant value for all the images and ceramide intensity was quantitated with the intensity function in SMASH. A total of 526 ± 35 muscle fibres per section (MHC IIa–: 263 ± 17; MHC IIa+: 260 ± 20) were analysed for fibre type distribution, ceramide intensity and CSA. In total, 83 sections were analysed because one participant did not have sufficient tissue at the insulin‐stimulated RA14 time point.
Statistical analysis
Values are reported as raw values or change scores expressed as the mean ± SEM. Primary outcome data were evaluated for equal variances and normality. The main hypothesis to be tested is that reduced physical inactivity in older adults would decrease insulin sensitivity and increase ceramide levels and TLR4 signalling. Second, we hypothesized that these cellular events would be reversed following REC. Third, changes at baseline in specific ceramide species (C16, C18) would be correlated with the change in insulin sensitivity (glucose infusion rate at RA14 vs. PRE) because these species have been linked to metabolic derangement (Summers & Goodpaster, 2016). A priori, we set the primary comparisons of interest (i.e. the changes from PRE to RA, RA to REC and PRE to REC) to test for these effects using individual t tests. These specific comparisons enabled us to test our specific hypotheses. To test for sex effects, statistics were conducted with a two‐way ANOVA with either Sidak or Tukey's post hoc tests as appropriate. P ≤ 0.05 was considered statistically significant. Trends were noted as 0.05 < P < 0.10. All analyses and figures were conducted using Prism, version 6.0f (GraphPad Software Inc., La Jolla, CA, USA).
Results
Baseline subject information and physical activity level
Healthy older adults (five females and seven males, 70 ± 2 years, 31 ± 2% fat and 49 ± 3 g of total lean mass) participated in the study. Males were heavier (men: 82 ± 3 kg; women: 67 ± 5 kg) and had a higher resting glucose (men: 97 ± 2 mg dL−1; women: 86 ± 3 mg dL−1). BMI (men: 25.8 ± 0.8 kg m−2; women: 25.7 ± 0.4 kg m−2) and HbA1c % (men: 5.6 ± 0.1; women: 5.5 ± 0.1) and macronutrient intake were not different between sexes. Step counts per day (Fig. 1) decreased from PRE (9008 ± 845 steps day−1) to RA (2994 ± 417 steps day−1; −66.3 ± 3.0% of PRE) (P < 0.0001) and this was not recovered after REC (7723 ± 708 steps day−1; −12.5 ± 4.8% of PRE) (P = 0.041). Step counts were not different between men and women.
Insulin sensitivity
Resting and clamp insulin, as well as insulin metabolic clearance rate, were not changed (P > 0.10) at baseline throughout the intervention (Table 1). However, resting insulin was higher (P < 0.05) in men than in women, especially after RA (Table 1). Insulin sensitivity (Fig. 2), assessed by the glucose infusion rate (GIR) was 14.3 ± 1.4 mg kg−1 LM min−1 at PRE, decreased (15 ± 6%; P = 0.032) to 12.5 ± 1.7 mg kg−1 LM min−1 at RA followed by a ∼39% rebound from RA to REC to 16.6 ± 1.9 mg kg−1 LM min−1 such that GIR was 14 ± 5% higher (P = 0.027) than PRE (Fig. 2A). The absolute values were higher in women than in men (Fig. 2 B) regardless of how the data were expressed (data not shown). The decrease in GIR at RA was driven by men (−25.4 ± 6.2%; P = 0.006) (Fig. 2 B). Likewise, men (52.5 ± 9.6%; P < 0.001) but not women (19.3 ± 10.3; P = 0.14) increased GIR from RA to REC (P = 0.043) (Fig. 2 C). Similar patterns in the change data were seen when the data was expressed as absolute GIR normalized to body weight but not relative to insulin (data not shown).
Table 1.
Fasting and clamp values and metabolic clearance rate (MCR) of insulin in older men and women before (PRE), after 2 weeks of RA and 2 weeks of REC
| PRE | RA | REC | |
|---|---|---|---|
| Fasting insulin (μU mL−1) | |||
| Men | 7.6 ± 1.9 | 9.1 ± 2.7∧ | 5.5 ± 1.7 |
| Women | 4.0 ± 1.8 | 1.8 ± 0.6 | 2.1 ± 0.5 |
| Clamp insulin (μU mL−1) | |||
| Men | 201.9 ± 23.0 | 206.7 ± 27.1 | 201.1 ± 31.3 |
| Women | 174.8 ± 26.0 | 216.9 ± 39.0 | 191.4 ± 21.0 |
| MCR [mL·(BSA min)−1] | |||
| Men | 445.2 ± 50.1 | 454 ± 65.1 | 469.3 ± 67.2 |
| Women | 501.3 ± 59.3 | 413.8 ± 60.8 | 441.9 ± 45.3 |
Data are the mean ± SEM. ∧ P < 0.05 vs. women.
Figure 2. Insulin sensitivity.
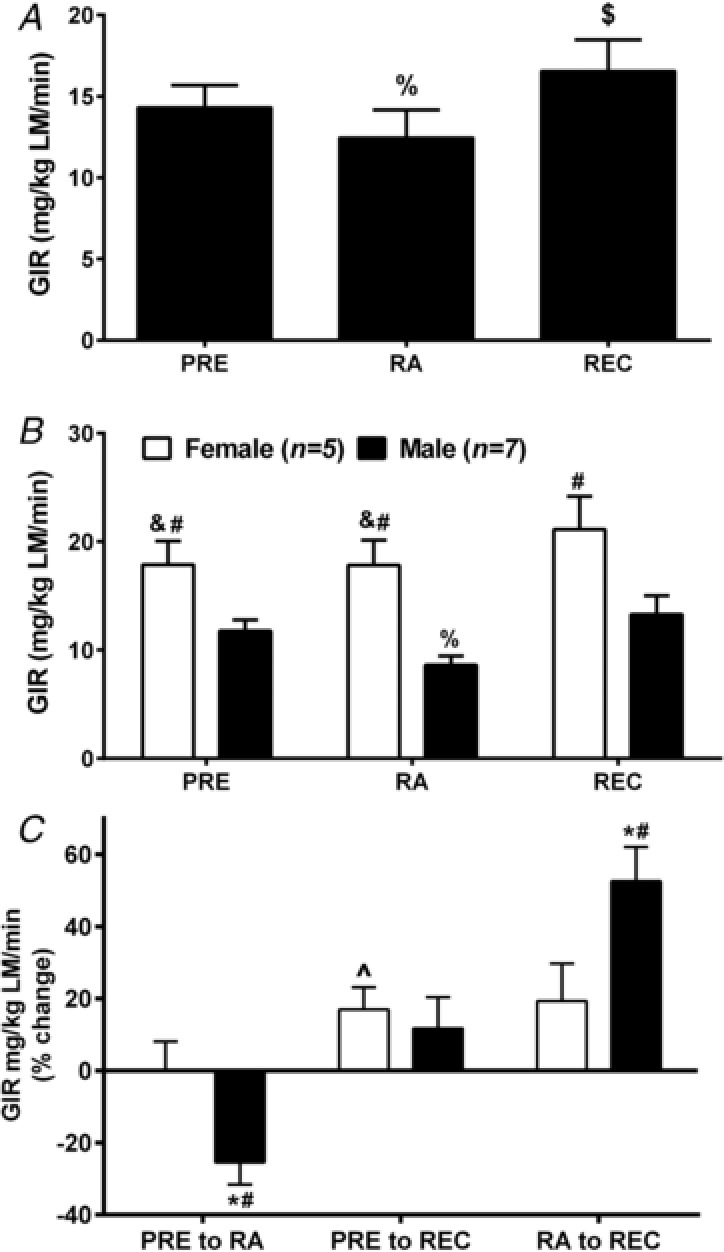
Insulin sensitivity (GIR; mg kg−1 FFM min−1) in healthy older adults at PRE, following 2 weeks of RA and then 2 weeks of REC to normal activity pooled (A) and by sex (B). Percentage changes (PRE to RA, PRE to REC and RA to REC) in glucose infusion rate (GIR; mg kg−1 FFM min−1) in healthy older adults by sex (C). at RA and REC. * P < 0.05, ∧ P = 0.052, difference from 0; #P < 0.05 sex difference; &P < 0.05 vs. REC; %P < 0.05 vs. PRE and REC; $P < 0.05 vs. RA and REC. Data are the mean ± SEM.
Body tissue composition, muscle morphology and muscle function
The men had greater lean mass and less fat% (P < 0.001) than women but similar amounts of total fat mass. Total lean mass, trunk lean mass, fat mass and body fat% were unchanged during the interventions. Following removal of an outlier, leg lean mass (LLM) (Table 2) decreased following RA (−1.3 ± 0.5%; P = 0.033). A sex effect (P = 0.022) was noted such that women (+2.3 ± 0.4%) but not men (−0.8 ± 1.0%) were able to recover LLM. Mid‐plantar flexor muscle area (Table 2) significantly decreased (P = 0.029) at RA by 2.4 ± 0.9% (vs. PRE) and this was primarily driven by women (P = 0.012) but returned to PRE at REC. MHC IIa− (which describes probable MHC I myofibres) were larger than MHC IIa+ myofibres (P = 0.016) (Fig. 4A). MHC IIa+ % was not different across time points and was 48 ± 2% on average. No change in myofibre‐type specific cross‐sectional area or minimum diameter was observed across time periods. Knee extension strength (Table 2) decreased (−8.0 ± 3.5%; P = 0.048) after RA and remained lower at REC (−7.4 ± 1.5%; P < 0.001) vs. PRE. Knee extension power and the 6MW test were unchanged across the time periods (data not shown).
Table 2.
Leg lean mass, mid‐planar flexor muscle area and knee extension (KE) strength RA (% of PRE) and REC (% of RA in healthy older adults)
| RA | REC | REC | |
|---|---|---|---|
| % of PRE (100%) | % of RA (100%) | ||
| Leg lean mass | 98.7 ± 0.5* | 99.8 ± 1.1 | 100.5 ± 0.7 |
| MPF muscle area | 97.6 ± 0.9* | 99.0 ± 1.4 | 101.6 ± 1.7 |
| KE strength | 92.9 ± 3.8* | 92.8 ± 1.6* | 101.5 ± 4.8 |
Data are the mean ± SEM. MPF, mid‐planar flexor. P value test for difference between PRE and respective time point of interest and between respective time points of comparison. * P < 0.05 significant change vs. comparator. Comparator (PRE or RA) set at 100%.
Figure 4. Skeletal muscle subfraction lipid intermediates.
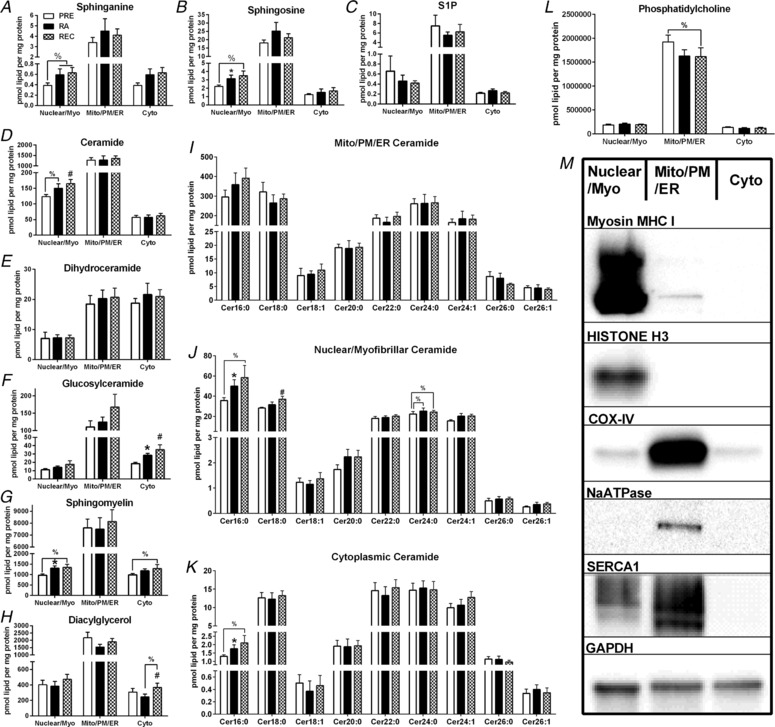
Skeletal muscle mitochondrial/reticulum/plasma membrane, nuclear/myofibrillar and cytoplasmic sphinaganine (A), sphingosine (B), sphingosine‐1‐phosphate (S1P) (C), ceramide (D), dihydroceramide (E), glucosylceramide (F), sphingomyelin (G) and diacylglycerol (H) totals at PRE, RA and REC in healthy older adults. Skeletal muscle mitochondrial/reticulum/plasma membrane (I), nuclear/myofibrillar (J) and cytoplasmic (K) ceramide species at PRE, RA and REC in healthy older adults. Skeletal muscle mitochondrial/reticulum/plasma membrane, nuclear/myofibrillar and cytoplasmic phosphatidylcholine (L) and representative immunoblotting image of the fractionation (M). Data are the mean ± SEM. * P < 0.05 PRE vs. RA; #P < 0.05 PRE vs. REC, %P < 0.10.
Muscle inflammation cell signalling (Fig. 3)
JNK (Thr183/Tyr185) tended (P = 0.075) to increase at RA14 compared to PRE and was decreased (P = 0.013) in response to insulin stimulation (vs. PRE baseline). Total IκBα increased (P = 0.036) at RA compared to PRE. TLR4 increased (P = 0.011) in response to RA‐insulin stimulation compared to PRE‐insulin stimulation (P < 0.001). Following insulin stimulation, AKT (Ser473) was elevated compared to baseline at all time periods (P < 0.01). Total SPT2 tended (P = 0.084) to increase following insulin stimulation at REC (vs. REC baseline). There were no sex differences in the muscle inflammation data (data not shown).
Myofibre specific ceramide content
Myofibre‐type specific ceramide content (Fig. 3 B–C) was not different over the time periods. However, MHC IIa− myofibres displayed greater ceramide intensity than MHC IIa+ myofibres (P = 0.036).
Figure 3. Muscle and myofiber ceramide and immunoblotting.
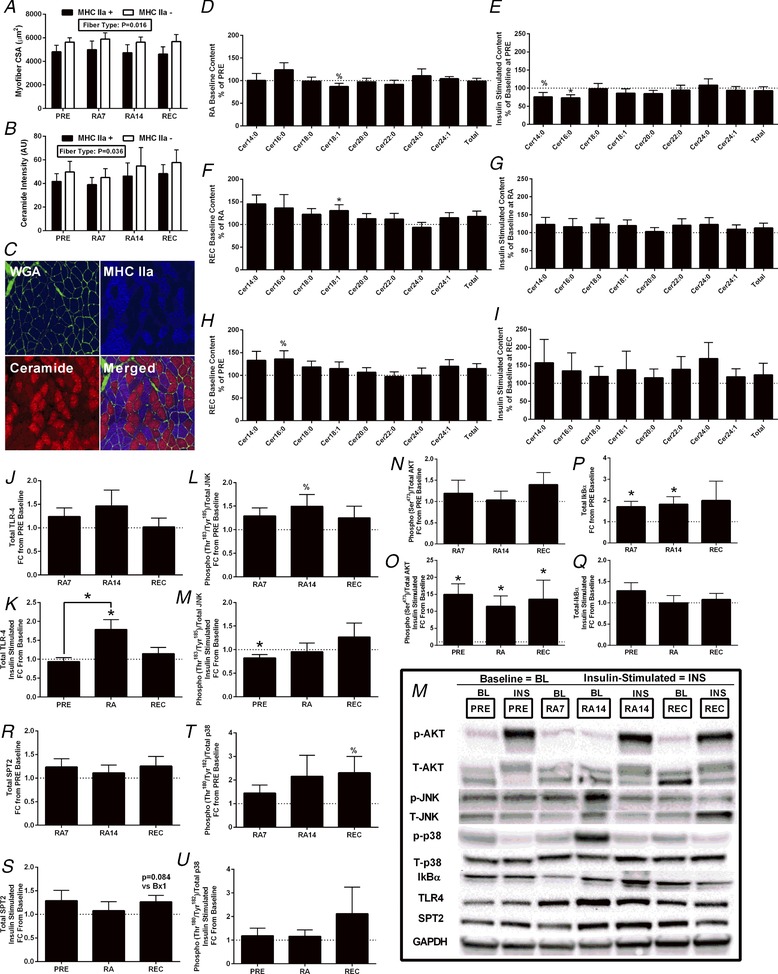
Vastus lateralis myofibre muscle cross‐sectional area, myofibre type‐specific ceramide content and total and species‐specific ceramide content at baseline (PRE), and at RA7, RA14 and REC, in healthy older adults (n = 12). Muscle cross‐sections are immunofluorecent analysis of MHC IIa positive and negative (MHC I) myofibres for cross‐sectional area (A) and ceramide intensity (B). A representative image of sections and immunofluorescence staining is shown (C). Basal changes (D, F and H) in intramuscular ceramide content from PRE to RA (D), RA to REC (F) and PRE to REC (H). Insulin stimulated changes (E, G and I) in ceramide content at PRE (E), RA (G) and REC (I). 100% is the reference value. Vastus lateralis myofibre immunoblotting of TLR4 (J and K), phospho‐JNK (Thr183/Tyr185)/JNK (L and M), phospho‐AKT (Ser473)/AKT (N and O), IκBα (P and Q) and SPT2 (R and S), as well as phospho‐p38 (Thr180/Tyr182)/p38 (T and U), during the 2 week RA and after ambulatory REC periods as the fold change from PRE baseline (J, L, N, P, R and T), and at RA7, RA14 and REC, and the fold change in response to insulin stimulation (K, M, O, Q, S and U) at PRE, RA14 and REC in healthy older adults (n = 12). Example immunoblotting images are shown (M). Data are the mean ± SEM. * P < 0.05; %P < 0.10. Significant change vs. comparator. Comparator (PRE, RA or REC) set at 1 or 100%. [Color figure can be viewed at http://wileyonlinelibrary.com]
Sphingolipids within skeletal muscle homogenate
Total abundance of ceramide, dihydroceramide, glucosylceramide and sphingomyelin content did not change at baseline or in response to insulin stimulation (data not shown), whereas only a few individual species of ceramide were altered following the interventions (Fig. 3 D–I and Table 3) or altered by sex (data not shown). Baseline CerC16:0 content tended to increase (P = 0.064) at RA7 (data not shown) and at REC (P = 0.072) vs. PRE. Baseline CerC18:1 content tended to decrease (P = 0.095) at RA14 vs. PRE and increased from RA to REC. Following insulin stimulation (relative to baseline), CerC14:0 tended to decrease (P = 0.074), whereas CerC16:0 (P = 0.009) was lower at PRE; thus, the change in insulin‐simulated CerC16:0 content (relative to baseline) was significantly less at PRE compared to RA (P < 0.001). No other ceramide species changed in response to insulin stimulation following the interventions. There were no sex‐differences with ceramide content or species in response to insulin stimulation following the interventions. Total or species specific dihydroceramide, glucosylceramide and sphingomyelin content did not change with insulin stimulation or at baseline across the interventions (data not shown).
Table 3.
Changes in serum, muscle homogenate and muscle subfraction sphingolipids in healthy older men and women after 2 weeks of reduced activity (PRE to RA) and after 2 weeks of recovery (RA to REC)
| Serum | Muscle homogenate | Mito/ER/PM | Nuclear/myofibrillar | Cytoplasmic | |
|---|---|---|---|---|---|
| RA vs. PRE | |||||
| Dihydroceramides | NC | ↑ 24:1 | NC | NC | NC |
| Ceramides | ↑ 22:0 | NC | NC | ↑ 16:0 | NC |
| Dihydro glycosylceramides | NC | – | ↑ 24:1 | NC | NC |
| Glycosylceramides | NC | NC | NC | NC | ↑ 24:0, Total |
| Dihydro‐sphingomyelin | NC | – | ↑ 20:0 | ↑ 18:0, Total | NC |
| Sphingomyelin | NC | NC | ↓ 18:0 | ↑ Total, 16:0 | ↑ Total, 16:0 |
| Sphingosine‐1‐phosphate | – | – | NC | NC | NC |
| Sphinganine, Sphingosine | NC | – | NC | p = 0.04‐0.08 to ↑ | NC |
| REC vs. RA | |||||
| Dihydroceramides | NC | NC | NC | NC | NC |
| Ceramides | NC | ↑ 14:0,18:1 | NC | NC | NC |
| Dihydro glycosylceramides | NC | – | ↓ 24:1 | NC | NC |
| Glycosylceramides | NC | NC | NC | NC | ↑ 18:0 |
| Dihydro‐sphingomyelin | NC | – | NC | NC | NC |
| Sphingomyelin | NC | NC | NC | NC | NC |
| Sphingosine‐1‐phosphate | – | – | NC | NC | NC |
| Sphinganine, Sphingosine | NC | – | NC | NC | NC |
Only significant changes are shown for specific species or totals. NC, no change; ↑, increase; ↓, decrease. Mito/ER/PM, mitochondrial/endoplasmic reticulum/plasma membrane.
Sphingolipids and diacylglycerols within skeletal muscle mitochondrial/endoplasmic reticulum/plasma membrane fraction
Total sphinganine (Fig. 4 A), sphingosine (Fig. 4 B), sphingosine‐1‐phosphate (Fig. 4 C), ceramide (Fig. 4 D), dihydroceramide (Fig. 4 E), glucosylceramides (Fig. 4 F), sphingomyelin (Fig. 4 A), diacylglycerol (Fig. 4 H), dihydro‐glucosylceramides (data not shown) and dihydro‐sphingomyelin (data not shown) content did not change at baseline and only a few individual species (values were altered following the interventions (Figs. 4, 5, 6 and Tables 3 and 4) or different by sex (data not shown). Additionally, phosphatidylcholine was most abundant in the mitochondrial/plasma membrane/endoplasmic reticulum fraction and showed a trend to decrease from PRE to REC (Fig. 4 L).
Figure 5. Skeletal muscle subfraction diacylglycerol.
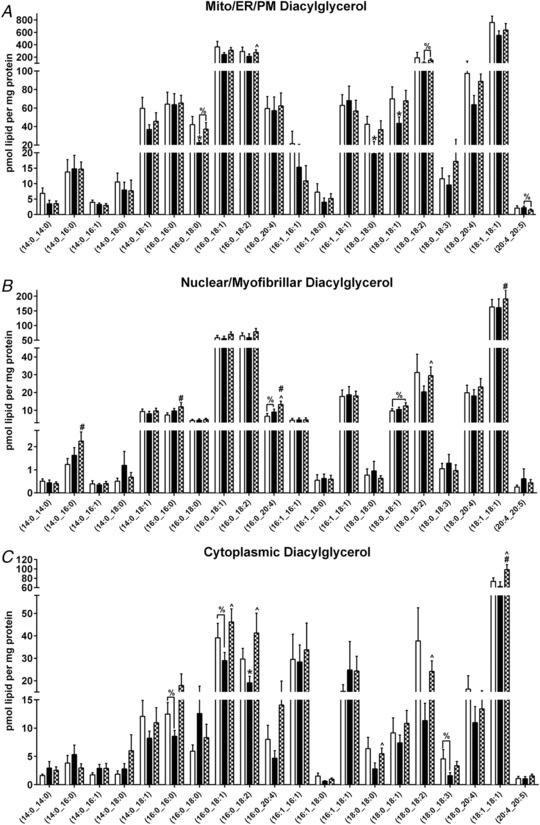
Skeletal muscle subfraction [Mito (A); Nuclear (B); Cyto (C)] diacylglycerol at PRE, RA and REC in healthy older adults. Data are the mean ± SEM. * P < 0.05 PRE vs. RA, #P < 0.05 PRE vs. REC, ∧ P < 0.05 RA vs. REC, %P < 0.10.
Figure 6. Skeletal muscle subfraction and serum sphingolipids.
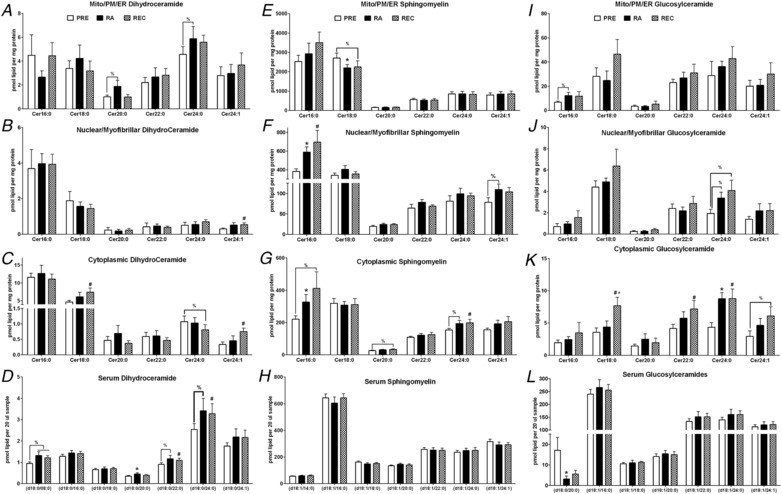
Skeletal muscle subfraction (A, B, C, E, F, G, I, J and K) and serum (D, H and L) dihydroceramide (A, B, C and D), sphingomyelin (E, F, G and H) and glucosylceramide (I, J, K and L) at PRE, RA and REC in healthy older adults. Data are the mean ± SEM. * P < 0.05 PRE vs. RA, #P < 0.05 PRE vs. REC, ∧ P < 0.05 RA vs. REC, %P < 0.10.
Table 4.
Changes in muscle subfraction diacylglycerols and phosphatidylcholine in healthy older men and women after 2 weeks of reduced activity (PRE to RA) and after 2 weeks of recovery (RA to REC)
| Mito/ER/PM | Nuclear/myofibrillar | Cytoplasmic | |
|---|---|---|---|
| Diacylglycerol | |||
| REC vs. RA | ↑ (16:0_18:2), (18:0_18:2) | ↑ (16:0_20:4) & (18:0_18:2) | ↑ (16:0_18:1), (16:0_18:2), (18:0_18:0), (18:0_18:2), (18:1_18:1), (18:2_18:2) |
| RA vs. PRE | ↓ (16:0_18:0), (18:0_18:0), (18:0_18:1) | NC | ↑ (16:0_18:2) |
| Phosphatidylcholine | |||
| REC vs. RA | NC | NC | NC |
| RA vs. PRE | NC | NC | NC |
Only significant changes are shown for specific species or totals. NC, no change; ↑, increase; ↓, decrease. Mito/ER/PM, mitochondrial/endoplasmic reticulum/plasma membrane.
Sphingolipids and diacylglycerols within skeletal muscle nuclear/myofibrillar fraction
Increases in sphingosine (P < 0.05) (Fig. 4 B) and a tendency for sphinganine (P < 0.10) (Fig. 4 A) were observed from PRE to RA and from PRE to REC. Total diacylglycerol (Fig. 4 H), dihydroceramide (Fig. 4 E), dihydro‐glucosylceramides (data not shown), glucosylceramides (Fig. 4 F) or sphingosine‐1‐phosphate (Fig. 4 C) content did not change (P > 0.10) at baseline and only a few individual species were altered following the interventions (Figs. 4, 5, 6 and Tables 3 and 4) or were different by sex (data not shown). Total ceramide (Fig. 4 D) tended to increase from PRE to RA (P < 0.1) and increased from PRE to REC. Total dihydro‐sphingomyelin (data not shown) and sphingomyelin (Fig. 4 G) increased from PRE to RA. Total sphingomyelin tended to increase from PRE to REC (P < 0.10).
Sphingolipids and diacylglycerols within skeletal muscle cytoplasmic fraction
Total ceramide, dihydroceramide (Fig. 4 E), dihydro‐glucosylceramides, dihydro‐sphingomyelin, sphingomyelin (Fig. 4 G), sphingosine‐1‐phosphate (Fig. 4 C), sphingosine (Fig. 4 B) or sphinganine (Fig. 4 A) content did not change at baseline and only a few individual species were altered following the interventions (Figs. 4, 5, 6 and Tables 3 and 4) or were different by sex (data not shown). Total diacylglycerol (Fig. 4 H) increased from PRE to REC and tended to increase from RA to REC (P < 0.10). Total glucosylceramide (Fig. 4 F) increased from PRE to REC and from RA to REC (P < 0.05). Total sphingomyelin (Fig. 4G) tended to increase from PRE to REC (P < 0.10).
Serum sphingolipid content
Serum total ceramide (Fig. 7 A) tended to increase at REC from PRE (P = 0.055) but no changes were seen from RA to REC or PRE to RA. Serum total dihydro‐glucosylceramides, glucosylceramides, phytoceramides dihydro‐sphingomyelin and sphingomyelin did not change at baseline (Fig. 7 A). Serum ceramides with a second double bond in the sphingoid backbone (i.e. d18:2‐Cer) also known as sphingadiene‐containing ceramides, total ceramides (trend) and dihydroceramides were increased from PRE to REC (Fig. 7 A). Serum sphingosine and sphinganine did not change at baseline (data not shown). Select ceramide moieties increased from PRE to REC (Fig. 7 B). Notable sex‐differences in serum ceramides were seen in response to RA (vs. PRE) (Fig. 7C). Serum ceramide 12:0, 20:0 and 24:0 tended to change more in men, whereas 18:0, 18:1, 22:0, 22:1, 24:1, 26:0, 26:1 and total serum ceramide increased more in men than women from PRE to RA. Men demonstrated significant increases in serum ceramide 22:0, 24:0, 24:1 and total ceramide, whereas women demonstrated a significant decrease in ceramide 18:0 and 20:0.
Figure 7. Serum sphingolipids and sex‐specific ceramide changes.
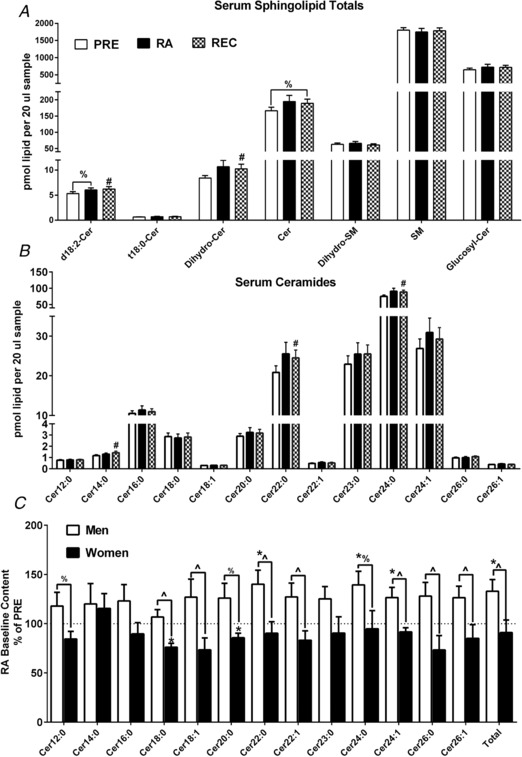
Serum sphingolipid totals (A) at PRE, RA and REC in healthy older adults. Serum ceramide species (B) at PRE, RA and REC in healthy older adults. Sex‐specific baseline changes from PRE to RA (presented as RA as % of PRE) in serum ceramide species (C) in healthy older adults. Data are the mean ± SEM. * P < 0.05 PRE vs. RA; #P < 0.05 PRE vs. REC; ∧ P < 0.05 sex difference. %P < 0.10.
Correlations
The change in GIR (mg kg−1 LM min−1) from PRE to RA was not related to baseline total ceramide (r = 0.483; P = 0.11), CerC16:0 (r = 0.496; P = 0.10) or CerC18:0 (r = −0.164; P = 0.61). Nor was there a relationship with insulin‐stimulated total ceramide (r = 0.246; P = 0.44), CerC16:0 (r = −0.143; P = 0.66) or CerC18:0 ceramide (r = 0.170; P = 0.60). There were no significant relationships between skeletal muscle homogenate, mitochondrial/plasma membrane/endoplasmic reticulum, nuclear/myofibrillar, cytoplasmic and serum CerC16:0, CerC18:0 and total ceramide (r = 0.25; P > 0.10) (Fig. 8).
Figure 8. Associations between ceramide and insulin sensitivity.
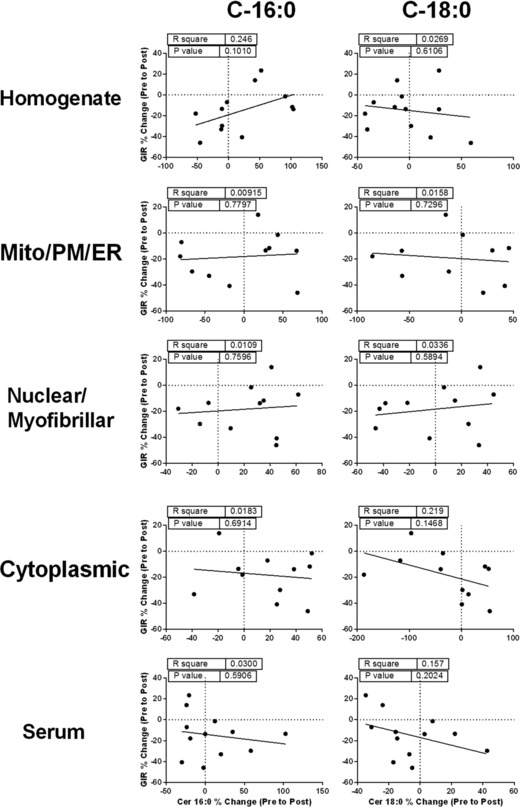
Correlation analysis to test the association between the change in insulin sensitivity during physical inactivity (GIR % change from PRE to RA) and the change in ceramides (ceramide 16:0. 18:0 and total) implicated in skeletal muscle insulin resistance in serum and skeletal muscle homogenate and subfraction (mitochondrial/endoplasmic reticulum/plasma membrane, nuclear/myofibrillar and cytoplasmic enriched subfractions) from healthy older adults.
As an exploratory analysis, because insulin sensitivity in response to the intervention was robustly different between the sexes, we conducted these same relationships (data not shown). Although underpowered, there was a non‐statistical pattern for divergent relationships in CerC18:0 and insulin sensitivity between men and women, particularly in the skeletal muscle homogenate (men: r = −0.36, P = 0.42; women: r = 0.86, P = 0.06; difference in slopes: P = 0.052) and serum (men: r = 0.37, P = 0.42; women: r = −0.73, P = 0.16; difference in slopes: P = 0.10).
There were no significant correlations between markers of muscle inflammation and the change in insulin sensitivity following inactivity (r 2 = 0.01–0.26, P = 0.09–0.90). Intriguingly, there was a very strong negative relationship (r = −0.909; P < 0.001) between resting glucose and the change in GIR (mg kg−1 LM min−1) from PRE to RA.
Discussion
In the present study, we examined the effects of 2 weeks of a modest reduction of physical activity followed by a REC period of normal ambulation on insulin sensitivity (via the gold‐standard hyperinsulinaemic‐euglyceamic clamp), ceramides (and other sphingolipids) and muscle inflammatory signalling in healthy older adults. The major finding was that healthy older men and women incur a ∼15% reduction in insulin sensitivity after RA which rebounded ∼40% after REC despite physical activity levels not fully returning to PRE levels. The decrease in insulin sensitivity following step reduction was not associated with the amount of step reduction, as has been demonstrated previously (Krogh‐Madsen et al. 2010), suggesting that the magnitude of the decrease was not proportional to the change in activity and that a ceiling effect is present and probably inter‐dependent. There were minor decreases in muscle mass and strength (and no changes in body fat) with RA but strength loss did not reverse with REC. Exploratory examination of sex‐differences revealed startling insulin sensitivity divergences between men and women such that women remained metabolically resilient during these changes in physical activity levels. Despite large changes in insulin sensitivity following RA and REC and minor changes in body composition, there were only modest increases in ceramides in the nuclear/myofibrillar and serum fractions in response to RA and REC but, overall, these changes were not strongly associated with insulin sensitivity. Despite relationships between ceramides and inactivity induced‐insulin resistance not being evidently present in this study, further work is warranted to examine sexual dimorphism in insulin resistance and the role of ceramides.
Our primary hypothesis was that ceramide and inflammatory levels would increase after physical inactivity and be correlated with physical inactivity‐induced insulin resistance, as suggested previously (Kwon et al. 2015; Kwon et al. 2016). Despite minor increases in select ceramide species across interventions, we did not observe a clear relationship with key ceramide species previously linked to insulin resistance (C16:0 and C18:0) or note major changes reflective of increased inflammatory signalling (i.e. TLR4, p38, Ikβα). However, we did observe non‐statistical sex‐specific patterns for divergence in the relationship between C18:0 in the muscle homogenate and serum with insulin sensitivity. Even with a relatively low sample size, we clearly demonstrated that men and women differentially handle serum ceramides following inactivity and that the accumulation of skeletal muscle C18:0 may possibly be associated with a worsening of insulin resistance following inactivity in older men but not older women. This relationship certainly warrants further validation in a larger clinical trial. Serum and nuclear/myofibrillar ceramides were the most dynamic (predominantly increased) across the interventions. However, because most of these changes were not reversed following REC (despite insulin sensitivity rebounding to exceed PRE‐levels), ceramides may not be strongly linked to insulin resistance in this context. We propose several alternative theories for this.
First, it is possible that ceramides are not linked to early changes in insulin sensitivity with such modest, yet rapid, alterations in metabolic function such as that seen following reduced physical activity (present study) or bed rest (Dirks et al. 2016), as opposed to diet and disease states where the mechanisms of insulin resistance are more gradual and complex. Indeed, cross‐sectional examination of exercise trained and sedentary healthy younger (Helge et al. 2004; Chow et al. 2014), middle‐aged (Skovbro et al. 2008) or older (Amati et al. 2011) adults reveals no difference in skeletal muscle ceramide contents or species despite rather distinct ranges of insulin sensitivity. Also, it has been demonstrated that healthy young men with normal BMI placed on 7 days of bed rest show remarkable decreases in insulin sensitivity (∼29%) and muscle mass (∼3%) without any major concomitant changes in skeletal muscle lipid species (Dirks et al. 2016). These findings suggest that the accumulation of ceramides may not be a key factor in the development of insulin resistance with inactivity. Second, ceramides may be only linked to insulin resistance in cases of extreme of body mass (Skovbro et al. 2008; Chee et al. 2016), diet‐induced metabolic dysfunction (Summers & Goodpaster, 2016; Covington et al. 2017) and severity of metabolic disease (Bosma et al. 2012; Summers & Goodpaster, 2016; Perreault et al. 2018). Thus, the absence of body composition changes in the present study may indicate minimal involvement from ceramides during the initial stages of inactivity‐induced insulin resistance. However, other inactivity studies have demonstrated that increased visceral fat (Thyfault & Krogh‐Madsen, 2011) and longer duration inactivity studies (>1 month of bed rest) result in the inevitable accumulation of body fat (Bergouignan et al. 2011). We posit that skeletal muscle ceramide content may not be involved in the development of insulin resistance from physical inactivity but may rather serve as a promoter or catalyst to maintain and worsen metabolic dysfunction. One intriguing speculation is that longer periods of inactivity with accumulation of visceral fat would demonstrate stronger associations with ceramide and inactivity‐induced insulin resistance. It is also interesting to speculate that the increased ceramide content (in the serum and nuclear/myofibrillar fraction) following RA was not restored following REC may predispose individuals to future diet‐induced metabolic dysfunction, although this remains to be tested. Finally, it is unclear whether this relationship would change if ceramide flux was assessed rather than capturing static measurements (Blachnio‐Zabielska et al. 2012; Chung et al. 2017).
We examined the skeletal muscle nuclear/myofibrillar, mitochondrial/plasma membrane/endoplasmic reticulum and the cytoplasmic enriched subfractions in attempt to improve the sensitivity of the relationship of these lipid intermediates with insulin sensitivity. Indeed, it has been shown that ceramides contained in the muscle subfraction enriched in the lipid membranes (subsarcolemmal) are more closely associated with insulin sensitivity in humans (Chung et al. 2017; Chung et al. 2018). This is probably because of the proximity of these lipid intermediates to the cell membranes, thus increasing the probability of causing inhibition of key insulin signalling events (Bergman et al. 2012; Bergman et al. 2018; Perreault et al. 2018). Even more recent work has validated the importance of not only plasma membrane (subsarcolemmal), but also mitochondrial/endoplasmic reticulum, and nuclear enriched subfraction localization of select ceramide and diacylglycerol species, as well as their relationship with insulin sensitivity (Perreault et al. 2018). Our samples included plasma membrane (subsarcolemmal) and mitochondrial/endoplasmic reticulum enrichment in the same fraction but did not demonstrate similar relationships as described previously. This may be a result of the larger sample sizes in the cross‐sectional study by Perreault et al. (2018) vs. our longitudinal study, although, in our opinion, we consider the discordant findings between the studies are more probably a result of the exclusion of obesity and metabolic disease in the present study. For example, there were no differences in total, mitochondrial/endoplasmic reticulum, nuclear, sarcolemmal or cytosolic ceramide content and composition between athletes vs. lean controls, although the subcellular ceramide localization of C‐18:0 and insulin sensitivity was highly correlated (Perreault et al. 2018). On further inspection, the data reported by Perreault et al. (2018) suggest that the relationship between ceramide and insulin sensitivity may have been driven by the inclusion of metabolically unhealthy participants. On the other hand, Perreault et al. (2018) demonstrated an inverse association between desaturated 1,2 diacylglycerol and insulin sensitivity when athletes were excluded and a positive relationship between mitochondrial/endoplasmic reticulum 1,2 diacylglycerol or nuclear 1,2 diacylglycerol and IS with the inclusion of athletes. This is further evidence for a specialization of physical activity to unexpectedly influence the relationship of skeletal muscle lipid storage and insulin in the context of lipid‐induced insulin resistance. Although a handful of diacylglycerol species were observed to be influenced by inactivity and restored upon REC, we did not find a relationship between the localization and composition of diacylglycerol with insulin sensitivity in this longitudinal study of physical inactivity.
One of the most interesting, yet unexpected, findings of the present study was the rebound of insulin sensitivity following 2 weeks of REC such that it was ∼15% higher than PRE values even though the participants did not achieve baseline activity level status. This is probably a result of the relatively healthy condition of our participants, which is in contrast to pre‐diabetic, overweight older adults who were unable to recover their impaired glycemic control following a 2 week REC from step reduction (McGlory et al. 2018). Similar to the REC response in healthy younger adults (Knudsen et al. 2012), our finding is metabolically encouraging for healthy older adults who may have restricted physical activity because of a short‐term illness or injury. This finding is reminiscent of the super‐compensation of rat skeletal glucose uptake during early reloading following hindlimb suspension (Henriksen & Tischler, 1988). It is tempting to speculate that healthy skeletal muscle metabolism retains some memory, possibly similar to the ‘epigenetic memory’ associated to the resistance training‐induced regrowth of muscle tissue following deconditioning in humans (Seaborne et al. 2018). Yet, the exact mechanism for the overshoot in insulin sensitivity is unknown and is an exciting area of further investigation.
In our exploratory analysis, we noted a striking finding that women (but not men) maintained their insulin sensitivity following 2 weeks of reduced physical activity. A possible explanation for the divergent sex differences in insulin sensitivity with RA may be related to differences in fuel homeostasis (Blanc et al. 2000b) where peripheral glucose uptake is minimally affected in women compared to men after bed rest (Blanc et al. 2000a). It is important to note that the studies by Blanc et al. (2000a,b) examined healthy premenopausal females and the sex‐differences in that study are probably, but not always (Magkos et al. 2010), related to the divergent hormonal milieu between men and women (Blaak, 2008). This probably does not explain our findings because the present study included healthy postmenopausal females. Yet, even in the postmenopausal state, females in the present study were more insulin sensitive than men, regardless of how the data were normalized, as supported by the results of another study (Magkos et al. 2010). We did not observe a difference in circulating insulin levels between the sexes during the clamp; however, baseline levels of circulating insulin and glucose were higher in men. Interestingly, fasting glucose was strongly correlated (r = −0.909; P < 0.001) with the reduction of insulin sensitivity after RA. Thus, it is possible that higher glucose levels predisposed men to greater alterations in insulin sensitivity following RA. It is important to note that the remarkable sex‐differences in the present study were observed with a small sample size; therefore, future studies with larger cohorts of men and women will be necessary to unravel sex differences in skeletal muscle insulin sensitivity (Magkos et al. 2010).
Finally, it is not surprising that we demonstrated minimal muscle atrophy in healthy older adults. In a similar population of older adults on short‐term (5 days) bed rest, we demonstrated a ∼4% and ∼10% decrease in leg lean mass and myofibre cross‐sectional area, respectively (Reidy et al. 2018). Yet, with 2 weeks of sedentary behaviour, and in agreement to a recent study (McGlory et al. 2018), we report only a ∼1% decrease in leg lean mass and no change in myofibre cross‐sectional area. We also assessed mid‐plantar flexor muscle area with pQCT and discovered a higher magnitude of muscle atrophy (∼3%), suggesting that the majority of the leg lean mass changes occurred in the lower limb. Concurrently, we observed a 7% decrease in knee extension strength following RA that was not restored after REC. These data suggest that more intentional rehabilitation (Devries et al. 2015) may be needed to fully recuperate strength, which would be extremely important for vulnerable older adults with low muscle volume and weakness (Bell et al. 2016).
A limitation to the present study is that we did not assess dietary intake during the interventions (though subjects were encouraged to maintain their normal baseline diet); thus, dietary modifications could have influenced changes in insulin sensitivity and ceramide accumulation during RA and ambulatory REC periods (Krogh‐Madsen et al. 2014). Typically, RA studies in older adults show that the reduction in steps is paralleled by a reduction in energy intake (Breen et al. 2013; Devries et al. 2015; McGlory et al. 2018) and probably involves minor changes in habitual dietary intake (Breen et al. 2013). However, these prior studies also show reductions in glucose tolerance and surrogates of insulin sensitivity; therefore, the dietary modifications in the present study were probably modest.
In conclusion, 2 weeks of RA caused reduction in insulin sensitivity in healthy older adults, a sensitivity level that surpassed baseline levels following 2 weeks of ambulatory REC. These alterations were more prominent in men than women and, although there were modest changes in serum and muscle ceramides, they appear to occur independent of associations with early changes in insulin sensitivity caused by physical inactivity. It is intriguing to speculate that the relationship between ceramides and inactivity‐induced insulin resistance may be sex‐dependent, although this is in need of further examination.
Additional information
Competing interests
The authors declare that they have no competing interests.
Author contributions
MJD, PTR and AIM designed the research proposal. PTR, AIM, ZM, VRM, NY, PNH, RLM, MTR, YKL and MJD conducted the research. PTR, AIM, ZM, VRM, NY and MJD analysed the data. PTR, AIM, ZM and MJD wrote the paper. PTR and MJD have primary responsibility for the final content. All authors read and approved final draft of manuscript submitted for publication.
Funding
The present study received funding from NIA R01AG050781, NCATS UL1TR001067 and University of Utah Fluorescence Microscopy Core Facility, as well as PTR fellowship support from the Jeane B. Kempner Award and NIAMS F32 AR072481‐01.
Acknowledgements
We acknowledge the CCTS for their nursing staff assistance on the clinical study days. We are also grateful for the laboratory of Scott Summers with respect to assistance with the extraction and analysis of sphingolipids.
Biography
Paul Reidy received his Bachelor's Degree in Exercise Science from Anderson University. Subsequently, he studied Exercise Physiology under the mentoring of Dr Matthew Harber in the Master's program at the Ball State University Human Performance Laboratory. Thereafter, Paul moved to Galveston, Texas, to receive his doctoral training in nutrition, human protein metabolism and clinical trials with Dr Blake Rasmussen at the University of Texas Medical Branch. During his post‐doctoral fellowship with Dr Micah Drummond, he is studying the mechanisms behind disuse and muscle rehabilitation/recovery in ageing skeletal muscle.

Edited by: Scott Powers & Bettina Mittendorfer
Linked articles This article is highlighted in a Perspectives article by Padilla et al. To read this article, visit https://doi.org/10.1113/JP277110
This is an Editor's Choice article from the 1 November 2018 issue.
References
- Amati F, Dubé JJ, Alvarez‐Carnero E, Edreira MM, Chomentowski P, Coen PM, Switzer GE, Bickel PE, Stefanovic‐Racic M, Toledo FGS & Goodpaster BH (2011). Skeletal muscle triglycerides, diacylglycerols, and ceramides in insulin resistance: another paradox in endurance‐trained athletes? F1000Prime 60, 2588–2597. [DOI] [PMC free article] [PubMed] [Google Scholar]
- Bell KE, von Allmen MT, Devries MC & Phillips SM (2016). Muscle disuse as a pivotal problem in sarcopenia‐related muscle loss and dysfunction. J Frailty Aging 5, 33–41. [DOI] [PubMed] [Google Scholar]
- Bergman BC, Hunerdosse DM, Kerege A, Playdon MC & Perreault L (2012). Localisation and composition of skeletal muscle diacylglycerol predicts insulin resistance in humans. Diabetologia 55, 1140–1150. [DOI] [PMC free article] [PubMed] [Google Scholar]
- Bergman BC, Perreault L, Strauss A, Bacon S, Kerege A, Harrison K, Brozinick JT, Hunerdosse DM, Playdon MC, Holmes W, Bui HH, Sanders P, Siddall P, Wei T, Thomas MK, Kuo MS & Eckel RH (2018). Intramuscular triglyceride synthesis: importance in muscle lipid partitioning in humans. Am J Physiol Endocrinol Metab 314, E152–E164. [DOI] [PMC free article] [PubMed] [Google Scholar]
- Bergouignan A, Rudwill F, Simon C & Blanc S (2011). Physical inactivity as the culprit of metabolic inflexibility: evidence from bed‐rest studies. J Appl Physiol 111, 1201–1210. [DOI] [PubMed] [Google Scholar]
- Blaak E (2008). Sex differences in the control of glucose homeostasis. Curr Opin Clin Nutr Metab Care 11, 500–504. [DOI] [PubMed] [Google Scholar]
- Blachnio‐Zabielska AU, Persson XM, Koutsari C, Zabielski P & Jensen MD (2012). A liquid chromatography/tandem mass spectrometry method for measuring the in vivo incorporation of plasma free fatty acids into intramyocellular ceramides in humans. Rapid Commun Mass Spectrom 26, 1134–1140. [DOI] [PMC free article] [PubMed] [Google Scholar]
- Blanc S, Normand S, Pachiaudi C, Duvareille M & Gharib C (2000a). Leptin responses to physical inactivity induced by simulated weightlessness. Am J Physiol Regul Integr Comp Physiol 279, R891–R898. [DOI] [PubMed] [Google Scholar]
- Blanc S, Normand S, Pachiaudi C, Fortrat JO, Laville M & Gharib C (2000b). Fuel homeostasis during physical inactivity induced by bed rest. J Clin Endocrinol Metab 85, 2223–2233. [DOI] [PubMed] [Google Scholar]
- Bosma M, Kersten S, Hesselink MKC & Schrauwen P (2012). Re‐evaluating lipotoxic triggers in skeletal muscle: relating intramyocellular lipid metabolism to insulin sensitivity. Prog Lipid Res 51, 36–49. [DOI] [PubMed] [Google Scholar]
- Breen L, Stokes KA, Churchward‐Venne TA, Moore DR, Baker SK, Smith K, Atherton PJ & Phillips SM (2013). Two weeks of reduced activity decreases leg lean mass and induces ‘anabolic resistance’ of myofibrillar protein synthesis in healthy elderly. J Clin Endocrinol Metabol 98, 2604–2612. [DOI] [PubMed] [Google Scholar]
- Bryndina IG, Shalagina MN, Ovechkin SV & Ovchinina NG (2014). [Sphingolipids in skeletal muscles of C57B1/6 mice after short‐term simulated microgravity]. Ross Fiziol Zh Im I M Sechenova 100, 1280–1286. [PubMed] [Google Scholar]
- Bryndina IG, Shalagina MN, Sekunov AV, Zefirov AL & Petrov AM (2018). Clomipramine counteracts lipid raft disturbance due to short‐term muscle disuse. Neurosci Lett 664, 1–6. [DOI] [PubMed] [Google Scholar]
- Chaurasia B & Summers SA (2018). Ceramides – lipotoxic inducers of metabolic disorders: (trends in endocrinology and metabolism 26, 538–550; 2015). Trends Endocrinol Metab 26, 538–550. [Google Scholar]
- Chee C, Shannon CE, Burns A, Selby AL, Wilkinson D, Smith K, Greenhaff PL & Stephens FB (2016). relative contribution of intramyocellular lipid to whole‐body fat oxidation is reduced with age but subsarcolemmal lipid accumulation and insulin resistance are only associated with overweight individuals. Diabetes 65, 840–850. [DOI] [PMC free article] [PubMed] [Google Scholar]
- Chow LS, Mashek DG, Austin E, Eberly LE, Persson XM, Mashek MT, Seaquist ER & Jensen MD (2014). Training status diverges muscle diacylglycerol accumulation during free fatty acid elevation. Am J Physiol Endocrinol Metab 307, E124–E131. [DOI] [PMC free article] [PubMed] [Google Scholar]
- Chung JO, Koutsari C, Blachnio‐Zabielska AU, Hames KC & Jensen MD (2017). Intramyocellular ceramides: subcellular concentrations and fractional de novo synthesis in postabsorptive humans. Diabetes 66, 2082–2091. [DOI] [PMC free article] [PubMed] [Google Scholar]
- Chung JO, Koutsari C, Blachnio‐Zablieska AU, Hames KC & Jensen MD (2018). Effects of meal ingestion on intramyocellular ceramide concentrations and fractional de novo synthesis in humans. Am J Physiol Endocrinol Metab 314, E105–E114. [DOI] [PMC free article] [PubMed] [Google Scholar]
- Coker RH, Hays NP, Williams RH, Xu L, Wolfe RR & Evans WJ (2014). Bed rest worsens impairments in fat and glucose metabolism in older, overweight adults. J Gerontol A Biol Sci Med Sci 69, 363–370. [DOI] [PMC free article] [PubMed] [Google Scholar]
- Covington JD, Johannsen DL, Coen PM, Burk DH, Obanda DN, Ebenezer PJ, Tam CS, Goodpaster BH, Ravussin E & Bajpeyi S (2017). Intramyocellular lipid droplet size rather than total lipid content is related to insulin sensitivity after 8 weeks of overfeeding. Obesity 25, 2079–2087. [DOI] [PMC free article] [PubMed] [Google Scholar]
- Dasu MR, Devaraj S, Park S & Jialal I (2010). Increased toll‐like receptor (TLR) activation and TLR ligands in recently diagnosed type 2 diabetic subjects. Diabetes Care 33, 861–868. [DOI] [PMC free article] [PubMed] [Google Scholar]
- DeFronzo RA, Jacot E, Jequier E, Maeder E, Wahren J & Felber JP (1981). The effect of insulin on the disposal of intravenous glucose. Results from indirect calorimetry and hepatic and femoral venous catheterization. Diabetes 30, 1000–1007. [DOI] [PubMed] [Google Scholar]
- Devries MC, Breen L, Von Allmen M, MacDonald MJ, Moore DR, Offord EA, Horcajada MN, Breuille D & Phillips SM (2015). Low‐load resistance training during step‐reduction attenuates declines in muscle mass and strength and enhances anabolic sensitivity in older men. Physiol Rep 3, e12493. [DOI] [PMC free article] [PubMed] [Google Scholar]
- Dirks ML, Wall BT, van de Valk B, Holloway TM, Holloway GP, Chabowski A, Goossens GH & van Loon LJC (2016). One week of bed rest leads to substantial muscle atrophy and induces whole‐body insulin resistance in the absence of skeletal muscle lipid accumulation. Diabetes 65, 2862–2875. [DOI] [PubMed] [Google Scholar]
- Drummond MJ, Timmerman KL, Markofski MM, Walker DK, Dickinson JM, Jamaluddin M, Brasier AR, Rasmussen BB & Volpi E (2013). Short‐term bed rest increases TLR4 and IL‐6 expression in skeletal muscle of older adults. Am J Physiol Regul Integr Comp Physiol 305, R216–R223. [DOI] [PMC free article] [PubMed] [Google Scholar]
- Frisard MI, McMillan RP, Marchand J, Wahlberg KA, Wu Y, Voelker KA, Heilbronn L, Haynie K, Muoio B, Li L & Hulver MW (2010). Toll‐like receptor 4 modulates skeletal muscle substrate metabolism. Am J Physiol Endocrinol Metab 298, E988–E998. [DOI] [PMC free article] [PubMed] [Google Scholar]
- Gill TM, Desai MM, Gahbauer EA, Holford TR & Williams CS (2001). Restricted activity among community‐living older persons: incidence, precipitants, and health care utilization. Ann Intern Med 135, 313–321. [DOI] [PubMed] [Google Scholar]
- Helge JW, Dobrzyn A, Saltin B & Gorski J (2004). Exercise and training effects on ceramide metabolism in human skeletal muscle. Exp Physiol 89, 119–127. [DOI] [PubMed] [Google Scholar]
- Henriksen EJ & Tischler ME (1988). Glucose uptake in rat soleus: effect of acute unloading and subsequent reloading. J Appl Physiol 64, 1428–1432. [DOI] [PubMed] [Google Scholar]
- Knudsen SH, Hansen LS, Pedersen M, Dejgaard T, Hansen J, Hall GV, Thomsen C, Solomon TP, Pedersen BK & Krogh‐Madsen R (2012). Changes in insulin sensitivity precede changes in body composition during 14 days of step reduction combined with overfeeding in healthy young men. J Appl Physiol 113, 7–15. [DOI] [PubMed] [Google Scholar]
- Krogh‐Madsen R, Pedersen M, Solomon TPJ, Knudsen SH, Hansen LS, Karstoft K, Lehrskov‐Schmidt L, Pedersen KK, Thomsen C, Holst JJ & Pedersen BK (2014). Normal physical activity obliterates the deleterious effects of a high‐caloric intake. J Appl Physiol 116, 231–239. [DOI] [PubMed] [Google Scholar]
- Krogh‐Madsen R, Thyfault JP, Broholm C, Mortensen OH, Olsen RH, Mounier R, Plomgaard P, van Hall G, Booth FW & Pedersen BK (2010). A 2‐wk reduction of ambulatory activity attenuates peripheral insulin sensitivity. J Appl Physiol 108, 1034–1040. [DOI] [PubMed] [Google Scholar]
- Kwon OS, Nelson DS, Barrows KM, O'Connell RM & Drummond MJ (2016). Intramyocellular ceramides and skeletal muscle mitochondrial respiration are partially regulated by Toll‐like receptor 4 during hindlimb unloading. Am J Physiol Regul Integr Comp Physiol 311, R879–R887. [DOI] [PMC free article] [PubMed] [Google Scholar]
- Kwon OS, Tanner RE, Barrows KM, Runtsch M, Symons JD, Jalili T, Bikman BT, McClain DA, O'Connell RM & Drummond MJ (2015). MyD88 regulates physical inactivity‐induced skeletal muscle inflammation, ceramide biosynthesis signaling, and glucose intolerance. Am J Physiol Endocrinol Metab 309, E11–E21. [DOI] [PMC free article] [PubMed] [Google Scholar]
- Lee Y‐H, Seo D‐H, Park J‐H, Kabayama K, Opitz J, Lee KH, Kim H‐S & Kim T‐J (2015). Effect of oenothera odorata root extract on microgravity and disuse‐induced muscle atrophy. Evid Based Complement Alternat Med 2015, 130513. [DOI] [PMC free article] [PubMed] [Google Scholar]
- Magkos F, Wang X & Mittendorfer B (2010). Metabolic actions of insulin in men and women. Nutrition 26, 686–693. [DOI] [PMC free article] [PubMed] [Google Scholar]
- Marcus RL, Addison O, LaStayo PC, Hungerford R, Wende AR, Hoffman JM, Abel ED & McClain DA (2013). Regional muscle glucose uptake remains elevated one week after cessation of resistance training independent of altered insulin sensitivity response in older adults with type 2 diabetes. J Endocrinol Invest 36, 111–117. [DOI] [PMC free article] [PubMed] [Google Scholar]
- McGlory C, von Allmen MT, Stokes T, Morton RW, Hector AJ, Lago BA, Raphenya AR, Smith BK, McArthur AG, Steinberg GR, Baker SK & Phillips SM (2018). Failed recovery of glycemic control and myofibrillar protein synthesis with 2 wk of physical inactivity in overweight, prediabetic older adults. J Gerontol A Biol Sci Med Sci 73, 1070–1077. [DOI] [PMC free article] [PubMed] [Google Scholar]
- Nordby P, Prats C, Kristensen D, Ekroos K, Forsberg G, Andersen JL, Ploug T, Dela F, Storlien L & Helge JW (2010). Muscle ceramide content in man is higher in type I than type II fibers and not influenced by glycogen content. Eur J Appl Physiol 109, 935–943. [DOI] [PubMed] [Google Scholar]
- Perreault L, Newsom SA, Strauss A, Kerege A, Kahn DE, Harrison KA, Snell‐Bergeon JK, Nemkov T, D'Alessandro A, Jackman MR, MacLean PS & Bergman BC (2018). Intracellular localization of diacylglycerols and sphingolipids influences insulin sensitivity and mitochondrial function in human skeletal muscle. JCI Insight 3. [DOI] [PMC free article] [PubMed] [Google Scholar]
- Petersen MC & Jurczak MJ (2016). CrossTalk opposing view: Intramyocellular ceramide accumulation does not modulate insulin resistance. J Physiol 594, 3171–3174. [DOI] [PMC free article] [PubMed] [Google Scholar]
- Reidy PT, Lindsay CC, McKenzie AI, Fry CS, Supiano MA, Marcus RL, LaStayo PC & Drummond MJ (2018). Aging‐related effects of bed rest followed by eccentric exercise rehabilitation on skeletal muscle macrophages and insulin sensitivity. Exp Gerontol 107, 37–49. [DOI] [PMC free article] [PubMed] [Google Scholar]
- Rivas DA, Morris EP, Haran PH, Pasha EP, MdS Morais, Dolnikowski GG, Phillips EM & Fielding RA (2012). Increased ceramide content and NFκB signaling may contribute to the attenuation of anabolic signaling after resistance exercise in aged males. J Appl Physiol 113, 1727–1736. [DOI] [PMC free article] [PubMed] [Google Scholar]
- Seaborne RA, Strauss J, Cocks M, Shepherd S, O'Brien TD, van Someren KA, Bell PG, Murgatroyd C, Morton JP, Stewart CE & Sharples AP (2018). Human skeletal muscle possesses an epigenetic memory of hypertrophy. Sci Rep 8, 1898. [DOI] [PMC free article] [PubMed] [Google Scholar]
- Skovbro M, Baranowski M, Skov‐Jensen C, Flint A, Dela F, Gorski J & Helge JW (2008). Human skeletal muscle ceramide content is not a major factor in muscle insulin sensitivity. Diabetologia 51, 1253–1260. [DOI] [PubMed] [Google Scholar]
- Smith LR & Barton ER (2014). SMASH – semi‐automatic muscle analysis using segmentation of histology: a MATLAB application. Skelet Muscle 4, 21. [DOI] [PMC free article] [PubMed] [Google Scholar]
- Stevenson DA, Viskochil DH, Carey JC, Slater H, Murray M, Sheng X, D'Astous J, Hanson H, Schorry E & Moyer‐Mileur LJ (2009). Tibial geometry in individuals with neurofibromatosis type 1 without anterolateral bowing of the lower leg using peripheral quantitative computed tomography. Bone 44, 585–589. [DOI] [PMC free article] [PubMed] [Google Scholar]
- Summers SA & Goodpaster BH (2016). CrossTalk proposal: Intramyocellular ceramide accumulation does modulate insulin resistance. J Physiol 594, 3167–3170. [DOI] [PMC free article] [PubMed] [Google Scholar]
- Tanner RE, Brunker LB, Agergaard J, Barrows KM, Briggs RA, Kwon OS, Young LM, Hopkins PN, Volpi E, Marcus RL, LaStayo PC & Drummond MJ (2015). Age‐related differences in lean mass, protein synthesis and skeletal muscle markers of proteolysis after bed rest and exercise rehabilitation. J Physiol 593, 4259–4273. [DOI] [PMC free article] [PubMed] [Google Scholar]
- Thyfault JP & Krogh‐Madsen R (2011). Metabolic disruptions induced by reduced ambulatory activity in free‐living humans. J Appl Physiol 111, 1218–1224. [DOI] [PubMed] [Google Scholar]