Abstract
Surface‐enhanced Raman spectroscopy (SERS) is a surface‐sensitive technique that enhances Raman scattering by molecules adsorbed on nanostructures. The advantages of using SERS include high detection sensibility and fast analysis, thus it is a potentially promising tool for sensing metabolic cancer molecules in trace amounts. To explore this new method of lung cancer detection, we analyzed saliva samples from 61 lung cancer patients and 66 healthy controls. An SERS system and a nano‐modified chip were used in this study. Statistics were analyzed using support vector machine (SVM) and random forest algorithms. The leave‐one‐out algorithm was used based on SVM results to analyze differences in saliva between lung cancer patients and controls. There was a significant difference between the saliva of patients with lung cancer and healthy controls using the Raman spectrum; the intensity of the spectral line in lung cancer patients was weaker than in controls and 12 characteristic peaks were detected. Saliva SERS peaks have been characterized to refer to tissues, body fluids, and biological standard Raman peaks, but it is difficult to identify molecules with current information. The sensitivity and specificity of Raman spectroscopy data and SVM classification results of lung cancer patients and normal saliva samples were both 100%. Using the leave‐one‐out algorithm, the sensitivity was 95.08% and the specificity was 100%. The sensitivity of the random forest method was 96.72% and specificity was 100%. Our results show that SERS has the potential to detect lung cancer.
Keywords: Surface‐enhanced Raman spectroscopy, saliva, lung cancer, nano‐modified chip
Introduction
Lung cancer has the highest morbidity and mortality of all malignancies in China and continues to increase with the aging of the population. The average annual survival rate of lung cancer is only approximately 12%, but the five‐year survival rate can reach 70% after surgery for stage I lung cancer.1 Some of the important factors affecting lung cancer survival are non‐specific clinical symptoms and signs in the early stage, and the lack of a high positive rate of screening (e.g. chest X‐ray, sputum cytology, tumor marker, and low dose spiral computed tomography [CT]), in high‐risk populations. Effective screening and early detection has the potential to reduce lung cancer mortality.
Raman spectroscopy is a molecular scattering spectrum and an effective method to study the molecular structure of substances. Raman transitions are typically extremely weak, making their application limited. Surface‐enhanced Raman spectroscopy (SERS) was developed in the 1970s and is a surface‐sensitive technique that enhances Raman scattering by molecules adsorbed on rough metal surfaces or by nanostructures. The enhancement factor can be as high as 106~1015, indicating that the technique may detect single molecules.2 The key to SERS research is the preparation of a stable, highly sensitive SERS active substrate with good reproducibility, thus the substrates can realize trace analysis. Experiments have shown that the detection sensitivity of Raman spectroscopy increases with a decrease in the dimension of the particles on a sensing substrate surface. The sensitivity is significantly enhanced when the dimension of the particles on the substrate surface is < 100 nm. In recent years, the development of nanotechnology has given new life to SERS. SERS has shown great potential, not only in the field of material molecular structure investigation, but also trace chemical detection. In recent years, SERS has been used on the serum and saliva of breast, cervical, and nasopharyngeal cancer and positive results have been obtained.3, 4, 5 An important advantage of SERS detection technology is that testing of body fluid samples, such as serum, saliva, and urine, is noninvasive and fast.
Human saliva contains abundant proteins and metabolites. Many diseases can be diagnosed by an analysis of saliva.6 There are many advantages of using saliva for analysis, for instance, sample collection is easy and noninvasive, and the entire process of sample collection can be more conveniently monitored, compared to urine sample collection. As a newly available method, the saliva test will become an effective supplement, or perhaps even a replacement of other test methods, such as blood or urine tests.7
In this study, the saliva samples of 61 lung cancer patients were tested by a portable SERS system and comparison analysis was performed against the saliva samples of 66 healthy controls. The saliva was analyzed with a nano‐modified chip. Statistical analysis was performed using support vector machine (SVM) and random forest algorithms. The leave‐one‐out algorithm was used based on SVM results to analyze differences in saliva between lung cancer patients and controls.
Methods
Surface‐enhanced Raman spectroscopy
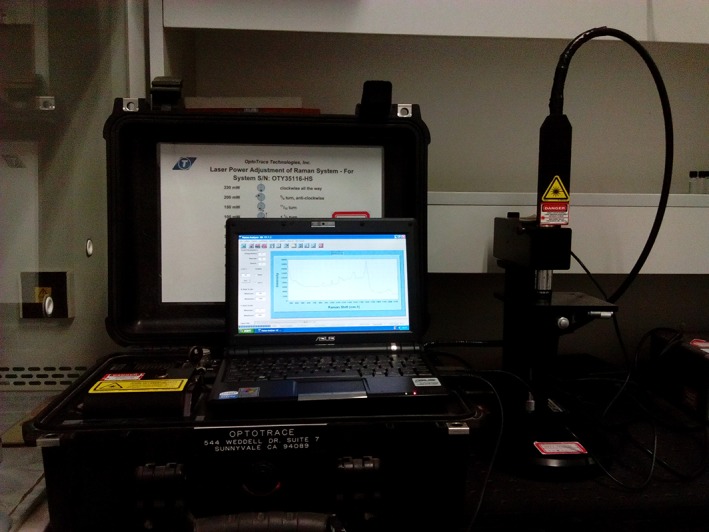
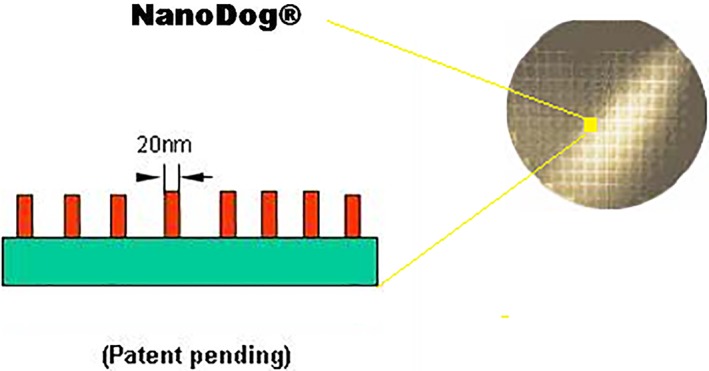
American OptoTrace Technologies, Inc. (Silicon Valley, CA, USA) provided the Raman spectrometer (RamTracerTM‐200 Raman Spectrometer) and nano‐modified chips. The gold nano‐modified chip is a patented product of OptoTrace Technologies. The main technical specifications of the RamTracer are: 0–300 mW, 785 nm, and frequency stabilized Laser; 2048 pixel CCD; spectral resolution< 6 cm−1; and spectral range: 250–2400 cm−1. It is portable equipment, with no special requirements for the test environment. This advantage made it possible to apply the SERS test system on wide‐band screening for the early detection of lung cancer. The Raman spectrometer and nano‐modified chip are shown in Figures 1 and 2.
Figure 1.

The RamTracer‐200 raman spectrometer.
Figure 2.

The surface micromorphology of the testing nano‐modified chip.
Sample collection and preparation
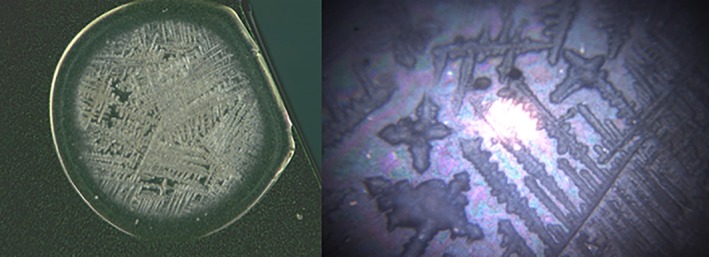
The saliva samples of 61 lung cancer patients who had not previously undergone treatment were collected at the Department of Thoracic Surgery, Xuanwu Hospital. The lung cancer patient sample included 37 men and 24 women at an average age of 64.98 years (range: 28–83). Eleven patients were at early stage and the remaining 50 were at late or uncertain stages. The 66 healthy control saliva samples were obtained from the students and teachers at China Capital University of Medical Science, who underwent health examinations before the experiments. All samples were collected using the following process: the mouth was rinsed with water 10 minutes before saliva collection, and then 1–1.5 mL of saliva was collected in a clean container. Saliva samples were centrifuged at 14 000 rpm for approximately 10 minutes. Only 1 μL of the centrifuged sample was transferred to the surface of a nano‐modified chip using a micropipette, one a time. A Raman test can be performed once the saliva sample has dried (3 minutes, above 20°C) (Fig 3). Each sample was analyzed using automatic mapping that scanned a sample area of about 750 × 750 μm and measured Raman spectra from three to six random points within the area, with five second accumulations at each point.
Figure 3.

A saliva drop on the chip.
Testing progress
The laser output power of the RamTracer‐200 Raman spectrometer was set to 100–200 mW. The signal to noise ratio is generally proportional to the power of the laser: the higher the power, the better the signal to noise ratio. The sample may be damaged if the power is too high. SERS scattering of the sample was performed using the RamTracer‐200 and the Raman spectrum related to the sample molecular structure was obtained. An almost straight zero baseline can be obtained using a manual point‐by‐point method of calibration (Raman Analyzer V4.5.0; American OptoTrace Technologies Inc.).
Statistic analysis
In order to discriminate and assign unknown lung cancers from saliva samples, a classification model was developed using supervised statistical methods. The SERS data are the high dimensional data of small samples and multiple indicators; therefore, the SVM and random forest algorithms are suitable to analyze such data. R software (a language and software platform for statistical computing and graphics; R Foundation for Statistical Computing, Vienna, Austria) was used to calculate the SVM algorithms. Cross validation testing was performed using the leave‐one‐out algorithm based on the SVM results to analyze the differences in saliva between the lung cancer patients and healthy controls.
Results
Statistical classification results
All 127 saliva samples were used in both training and test sets and then SVM was calculated. The classification results are shown in Table 1. The sensitivity and specificity were both 100%.
Table 1.
SVM classification results
| Saliva Sample | SERS Prediction | ||
|---|---|---|---|
| Lung Cancer | Normal | ||
| Lung Cancer | 61 | 61 | 0 |
| Normal | 66 | 0 | 66 |
SERS, surface‐enhanced Raman spectroscopy; SVM, support vector machine.
A leave‐one‐out algorithm was then calculated. One sample was used for the test set and the remainder for the training set. The results are shown in Table 2. The sensitivity and specificity were 95.08% and 100%, respectively.
Table 2.
Results of leave‐one‐out algorithm based on the SVM method
| Saliva Sample | SERS Prediction | ||
|---|---|---|---|
| Lung Cancer | Normal | ||
| Lung Cancer Normal |
61 | 58 | 3 |
| 66 | 0 | 66 | |
SERS, surface‐enhanced Raman spectroscopy; SVM, support vector machine.
All 127 saliva samples were used as training and test sets and the random forest algorithm was calculated. The classification results are shown in Table 3. The sensitivity was 96.72% and specificity was 100%.
Table 3.
Random forest classification results
| Saliva Sample | SERS prediction | ||
|---|---|---|---|
| Lung cancer | Normal | ||
| Lung Cancer Normal |
61 | 59 | 2 |
| 66 | 0 | 66 | |
SERS, surface‐enhanced Raman spectroscopy.
Raman spectrum analysis
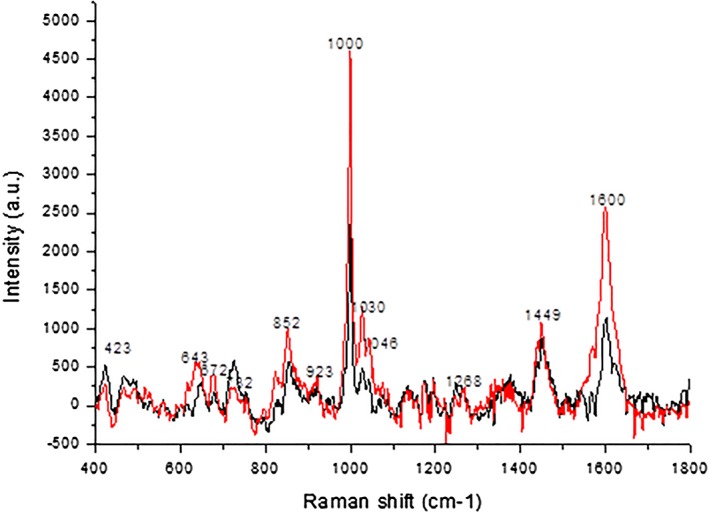
In order to determine the characteristic peaks in the lung cancer patients’ saliva, all 127 Raman spectra were further analyzed. Each spectrum of the 127 SERS was calibrated and energy‐sensitivity corrected, and then the spectral data were compiled into datasets. Figure 4 compares the average Raman spectrum of the saliva between the lung cancer patients and healthy controls. The horizontal axis is the Raman shift in cm−1 units, while the vertical axis is the intensity of Raman scattering. The Raman peaks in Figure 4 represent the characteristics of the molecular structure of the sample being tested. The chemical contents of the sample can be obtained by analyzing the peak position and the relative peak intensity. In medical research, comparison of the Raman spectra of samples from patients with certain diseases with those from healthy controls may reveal a distinctive Raman peak(s). This distinctive Raman peak can be considered a specific metabolic substance related to a disease and thus can be used to assist diagnosis.
Figure 4.

The average Raman spectra of the saliva of lung cancer patients and healthy controls ( ), lung cancer; (
 ), normal.
As Figure 4 shows, both the lung cancer and control Raman peaks appear in a range from 400 to 1800 cm−1. The origin software revealed 12 significant Raman characteristic peaks. The peak values of both lung cancer patients and controls were at a frequency shift of 1000 cm−1, followed by a frequency shift of 1600 cm−1. The spectral intensity of the saliva in controls was significantly higher than in lung cancer patients, at frequency shifts of 528 cm−1, 636 cm−1, 676 cm−1, 854 cm−1, 1000 cm−1, 1046 cm−1, 1263 cm−1, and 1604 cm−1. However, at frequency shifts of 423 cm−1 and 727 cm−1, the spectrum intensity of the saliva in the lung cancer patients was higher than in the controls. After review of the literature, we can infer that these peaks correspond to substances, as shown in Table 4. In general, the intensity of the spectral line in lung cancer patients was weaker than in the controls.
Table 4.
Tentative peak assignments for Raman saliva spectra
| Raman Shift/cm−1 | ΔI% | Major assignments | |
|---|---|---|---|
| Normal | Lung cancer | ||
| 423 ± 2 | 425 ± 3 | 89.41 | D‐glucose, deuterated glucose8, 9 |
| 643 ±3 | 650 ±2 | −24.97 | C‐H torsion, COO‐ wag; O‐C=O in plane deformation; C‐C‐C in phase deformation10, 11 |
| 672 ±2 | 672 ±1 | −90.82 | C–S stretch ofcysteine, cytosine/guanine |
| 732 ±3 | 726 ± 1 | 177.54 | C–S (protein)/CH2 rocking/adenine10, 11, 12, 13, 14 |
| 852 ±1 | 854 ±1 | −12.05 | Ring breathing mode of tyrosine and C–C stretch of proline ring10, 12, 15 |
| 923 ±2 | 924 ± 3 | −17.87 | C–C stretch of proline ring/glucose/lactic acid10 |
| 999 ±2 | 1000 ±2 | −48.84 | Symmetric ring breathing mode of phenylalanine10, 12, 14, 16 |
| 1030 ± 3 | 1026 ±1 | −60.93 | Stretching vibration of the ring, deformation in plane C‐H17 |
| 1046 ± 4, | 1050 ±2 | −66.47 | N‐ acetyl glucosamine, deuterated N‐acetyl glucosamine8, 9, 10 |
| 1268 ±2 | 1264 ± 3 | −2.28 | Amide III (C–N stretching mode of proteins, indicating mainly a‐helix conformation)10, 12 |
| 1449 ±2 | 1450 ±2 | −20.78 | Bending mode (C=C), phenylalanine, CH2 bending mode of proteins10, 11, 12, 13, 17 |
| 1600 ±2 | 1602 ±2 | −57.10 | C=C in‐plane bending mode of phenylalanine and tyrosine17, 18 |
IL is the average Raman spectrum of the lung cancer patients, while IC is the healthy controls: .
Discussion
Surface‐enhanced Raman spectroscopy is a surface‐sensitive technique that enhances Raman scattering by molecules adsorbed on nanostructures and has advantages of high detection sensibility and fast analysis. As such, it is a potentially promising tool for sensing metabolic cancer molecules in trace amounts. In recent years, improvements in chips via nanotechnology have greatly enhanced the application of SERS. Experiments have shown the possibility of using SERS of saliva as a method of lung cancer diagnosis.19, 20 In this study, significant differences were observed between the average Raman spectrum of controls and lung cancer patients. Twelve significant Raman characteristic peaks, ranging from 400 to 1800 cm−1 were detected. Because the spectral data were high dimensional and we had a small study sample, the traditional statistical methods could not provide adequate power for the classification samples, therefore SVM and random forest algorithms were calculated. Raman spectroscopy data of the saliva sample SVM classification results revealed high sensitivity and specificity of both lung cancer patients and healthy controls. These data demonstrate that SERS has the potential to detect lung cancer, but as we only had 11 patient samples in early stage, statistical analysis could not be performed to verify the value of the technique for the diagnosis of early‐stage lung cancer. In the future, the sample size included in the database will be expanded and more accurate mathematical models are being developed. SERS is expected to be a new method of fast, simple, and effective screening for early‐stage lung cancer.
Essential changes in the saliva SERS of lung cancer patients, including corresponding species, composition, and concentration, require further analysis of the SERS Raman peaks. The main reasons for differences in the Raman spectrum of body fluid are changes in protein residues and the content of nucleic acid molecules. Although we can obtain the ascription of Raman peaks of pure standard products with molecular structures from the literature, analysis of the corresponding substances of the spectral peaks of body fluid samples remains complex. The use of different substrates, laser frequency, detectors, temperatures, and sample solvents result in different consequences. The focus of our future research is to ascertain the material attribution of salivary peaks of the Raman spectrum in lung cancer patients in order to clarify the principle of this technology.
Disclosure
No authors report any conflict of interest.
Acknowledgments
This study was supported by and the Beijing Education Committee (KZ201010025018) and the Beijing Municipal Science and Technology Commission (D101100050010067).
References
- 1. Zheng RS, Zeng HM, Zuo TT et al Lung cancer incidence and mortality in China, 2011. Thorac Cancer 2015; 7: 94–9. [DOI] [PMC free article] [PubMed] [Google Scholar]
- 2. Doering WE, Nie S. Single‐molecule and single‐nanoparticle SERS: Examining the roles of surface active sites and chemical enhancement. J Phys Chem B 2002; 106: 311–7. [Google Scholar]
- 3. Vargas‐Obieta E, Martínez‐Espinosa JC, Martínez‐Zerega BE et al Breast cancer detection based on serum sample surface enhanced Raman spectroscopy. Lasers Med Sci 2016; 31: 1317–24. [DOI] [PubMed] [Google Scholar]
- 4. González‐Solís JL, Martínez‐Espinosa JC, Torres‐González LA et al Cervical cancer detection based on serum sample Raman spectroscopy. Lasers in Medical Science, 2014; 29 (3): 979–85. [DOI] [PubMed] [Google Scholar]
- 5. Feng S, Huang S, Lin D et al Surface‐enhanced Raman spectroscopy of saliva proteins for the noninvasive differentiation of benign and malignant breast tumors. Int J Nanomed 2015; 10: 537–47. [DOI] [PMC free article] [PubMed] [Google Scholar]
- 6. Fitzmaurice M, Haka AA, Volynskaya Z et al Raman spectroscopy: Development of clinical applications for breast cancer diagnosis. Proc Spie 2005; 5862: 1–4. [Google Scholar]
- 7. Yakhno TA, Sanin AG, Yakhno VG et al Drying drops of biological liquids: Dynamics of the optical and mechanical properties. Application in rapid medical diagnostics. Proc SPIE Int Soc Optical Eng 2005; 5692: 188–98. [Google Scholar]
- 8. Rong X, Huang SS, Liu H. Progress in application of Raman spectroscopy on the cell biology studies. Acta Laser Biol Sin 2010; 19 (1): 136–42. [Google Scholar]
- 9. Chen J, Xiao KJ, Lin FL. Review on Raman spectroscopy application in food analysis. Food Sci 2007; 28: 554–8. [Google Scholar]
- 10. Li PW, Zhang J, Zhang L, Mo YJ. Surface‐enhanced Raman scattering and adsorption studies of morphine on silver island film. Vibrational Spectrosc 2009; 49 (1): 2–6. [Google Scholar]
- 11. Mary MB, Sasirekha V, Ramakrishnan V. Spectral investigations of amino acid picrates. Spectrochimica Acta A 2006; 65: 414–20. [DOI] [PubMed] [Google Scholar]
- 12. Neugebauer U, Clement JH, Bocklitz T, Krafft C, Popp J. Identification and differentiation of single cells from peripheral blood by Raman spectroscopic imaging. J Biophotonics 2010; 3: 579–87. [DOI] [PubMed] [Google Scholar]
- 13. Barhoumi A, Zhang D, Tam F et al Surface‐enhanced Raman spectroscopy of DNA. J Am Chem Soc 2008; 130: 5523–9. [DOI] [PubMed] [Google Scholar]
- 14. Owen CA, Notingher I, Hill R, Stevens M, Hench LL. Progress in Raman spectroscopy in the fields of tissue engineering, diagnostics and toxicological testing. J Mater Sci Mater Med 2006; 17: 1019–23. [DOI] [PubMed] [Google Scholar]
- 15. Krafft C, Codrich D, Pelizzo G, Sergo V. Raman mapping and FTIR imaging of lung tissue: Congenital cystic adenomatoid malformation. Analyst 2008; 133: 361–71. [DOI] [PubMed] [Google Scholar]
- 16. Feng S, Chen R, Lin J et al Gastric cancer detection based on blood plasma surface‐enhanced Raman spectroscopy excited by polarized laser light. Biosens Bioelectron 2011; 26: 3167–74. [DOI] [PubMed] [Google Scholar]
- 17. Huang Z, McWilliams AH, Mclean DI et al Near‐infrared Raman spectroscopy for optical diagnosis of lung cancer. Int J Cancer 2003; 107: 1047–52. [DOI] [PubMed] [Google Scholar]
- 18. Han HW, Yan XL, Dong RX, Ban G, Li K. Analysis of serum from type II diabetes mellitus and diabetic complication using surface‐enhanced Raman spectra (SERS). Appl Phys B 2009; 94: 667–72. [Google Scholar]
- 19. Li XZ, Yang T, Wang R Wen WD. Surface enhanced Raman spectrum of saliva for detection of lung cancer. IEEE International Symposium on IT in Medicine and Education 2011: 688–90.
- 20. Feng SY, Lin D, Lin JQ et al Saliva analysis combining membrane protein purification with surface‐enhanced Raman spectroscopy for nasopharyngeal cancer detection. Appl Phys Lett 2014; 104: 238–43. [Google Scholar]


