

Abstract
Background
AZD‐3759 is a new, potent, oral, active central nervous system‐penetrant EGFR inhibitor. Despite promising clinical activity among patients pretreated and never treated with EGFR‐tyrosine kinase inhibitors, no time saving pharmacokinetic study method has been reported in an animal model.
Methods
Protein was precipitated with acetonitrile and then used for sample pre‐processing. A CORTECS BEH C18 column was used to separate the analytes at 40°C. Acetonitrile and water (containing 0.1% formic acid) were chosen as the mobile phase at a flow rate of 0.4 mL/min. The analytes were quantified by multiple reaction monitoring mode with positive electrospray ionization.
Results
The target fragment ions were m/z 460.38→141 for AZD‐3759 and m/z 285.1→193.1 for internal standard diazepam. The calibration curve exhibited good linearity for AZD‐3759 at a range of 1–500 ng/mL. The intra‐run and inter‐run precision variations were both < 8.22%. The recovery rate of AZD‐3759 from plasma was > 76.4%.
Conclusion
An accurate, simple ultra performance liquid chromatography with triple quadrupole mass spectrometer method was developed and validated to determine AZD‐3759 in rat plasma. Our validated method can be applied to the pharmacokinetic study of AZD‐3759 at an oral dosage of 10 mg/kg.
Keywords: AZD‐3759, pharmacokinetics, rat, UPLC‐MS/MS
Introduction
AZD3759 is a new, potent, oral, active central nervous system (CNS)‐penetrant EGFR inhibitor, which has good blood–brain barrier permeability for non‐small cell lung cancer (NSCLC) patients with EGFR mutations.1 It is mainly designed to effectively bypass the blood–brain barrier to address CNS metastasis in NSCLC patients carrying EGFR mutations, such as brain metastasis (BM) and dura mater (or pia mater, leptomeningeal metastases). AZD3759 is currently at a phase I/II research and development stage.3, 4At Km ATP concentrations, the half maximal inhibitory concentrations (IC50) were 0.3, 0.2, and 0.2 nM for wild‐type EGFR and mutated variants L858R and exon19Del, respectively.2 AZD3759 exhibited inhibitory effects on the proliferation of the phosphorylated (p) EGFR pathway and EGFR mutant derived PC‐9 and H3255 cells, with IC50 of 7.7 nm and 7 nm, respectively. However, it had no inhibitory effect on the proliferation rate of H838 cells.3
AZD3759 was tolerable up to 300 mg twice a day, with promising clinical activity in EGFR‐mutant NSCLC with CNS metastases.4 The recommended phase 2 dose was defined as 200 mg twice a day, at which level both AZD3759 and the metabolite AZ’1168 could reach efficacious concentrations for target inhibition. The promising clinical activity among patients pretreated and never treated with an EGFR‐tyrosine kinase inhibitor warrants the future development of AZD3759.5 However, no time saving pharmacokinetic study method has been reported in an animal model to date, which limits basic research regarding this new EGFR inhibitor drug. This study aimed to develop an ultra performance liquid chromatography with triple quadrupole mass spectrometer (UPLC‐MS/MS) method for the quantification of AZD3759 in pharmacokinetic studies in rats. Our method has a short retention time, high sensitivity, and is portable for use in the clinic.
Methods
Chemicals and reagents
AZD‐3759 (purity > 98%) was purchased from Toronto Research Chemicals Inc. (Toronto, Ontario, Canada). Analytical reagent grade formic acid and diazepam (as the internal standard [IS]) were purchased from Sigma‐Aldrich (St. Louis, MO, USA). Fisher Scientific Co. (Fair Lawn, New Jersey, USA) provided chromatography grade methanol and acetonitrile. Drug‐free blank plasma was obtained from Wenzhou Medical University Laboratory Animal Center (Wenzhou, China).
Liquid chromatographic conditions
Chromatographic separation of AZD‐3759 and diazepam was carried out using an ACQUITY UPLC I‐Class and XEVO TQD triple quadrupole mass spectrometer (Waters Corp., Milford, MA, USA). Binary Solvent Manager (BSM) and a Sample Manager with Flow‐Through Needle (SM‐FTN) were used in the UPLC system. Two microliter aliquots of samples were separated onto a CORTECS BEH C18 column (Waters Corp.) at 40°C. The mobile phase consisted of eluent A (acetonitrile) and eluent B (water with 0.1% formic acid), with a flow rate of 0.4 mL/minutes in gradient eluent A as follows: from start to 1 minute, 10–30%; from 1 to 2 minutes, 30–95%; from 2 to 2.5 minutes, maintained at 95%; and from 2.5 to 2.6 minutes, 95–10%. The total running time for the analytes was three minutes. A strong wash (methanol–water, 50/50, V/V) followed by a weak wash (methanol–water, 10/90, V/V) was performed after each injection.
Mass spectrometric conditions
The triple‐quadrupole mass spectrometer was operated in the positive electrospray ionization mode with an ESI interface. The capillary voltage was set at 1 kV and the cone voltage 35 V for AZD‐3759 and IS diazepam; Collision Energy was set at 35 V for AZD‐3759 and 30 V for IS. The source and desolvation temperature was 150°C. The desolvation gas flow was 1000 L/h and the cone gas (nitrogen) flow was 50 L/h. A multiple reaction monitoring (MRM) mode of m/z 460.38→141 for AZD‐3759 and m/z 285.1→193.1 for diazepam (IS) was used for quantitative analysis, with a scan time of 0.108 seconds per transition. Masslynx 4.1 software (Waters Corp.) was used for data processing.
Preparation of standard solutions and quality control samples
The stock solutions of AZD‐3759 (0.5 mg/mL) and diazepam (0.5 mg/mL, IS) were prepared using a methanol–water solution. The working solutions of IS (0.5 μg/mL, IS) and AZD‐3759 were prepared by diluting corresponding stock solutions with methanol.
The concentration of calibration curves was prepared by spiking appropriate working solutions into rat blank plasma at a range of 1–500 ng/mL for AZD‐3759 (1, 2.5, 5, 10, 25, 50, 100, 200 and 500 ng/mL). Quality control (QC) samples of AZD‐3759 were prepared independently at three different levels (1.2, 60, and 300 ng/mL). All calibration and QC samples were frozen at −20°C before use.
Plasma sample preparation
Before analysis, the plasma sample was thawed to room temperature. An aliquot of 20 μL of the IS working solution (0.5 μg/mL) was added into 100 μL of collected plasma sample in a 1.5 mL centrifuge tube, followed by the addition of 200 μL of acetonitrile. The tubes were vortex mixed for one minute. After centrifugation at 13 000 rpm for 10 minutes, the supernatant (2 μL) was injected into the UPLC–MS/MS system for detection.
Method validation
Rigorous tests for selectivity, linearity, accuracy, precision, recovery, and stability were conducted according to the guidelines set by the United States Food and Drug Administration (FDA) and European Medicines Agency (EMA), in order to thoroughly validate the proposed bioanalytical method.6, 7, 8, 9, 10, 11, 12, 13, 14, 15, 16, 17, 18, 19 All QC plasma samples were prepared on three consecutive days with six replicates.
Linearity and the lower limit of quantification (LLOQ)
The calibration curves were established based on the peak area ratio of AZD‐3759 to IS. The calibration curves of AZD‐3759 were drawn using the weighted (1/x) least square linear regression method. The lowest standard on the calibration curve was accepted as the linearity and the lower limit of quantification (LLOQ), if the following conditions were convincing: the analyte response was at least five times the blank response; the analyte peak (response) was identifiable, discrete, and reproducible; and the back‐calculated concentration had precision that did not exceed 20% of the CV and accuracy within 20% of the nominal concentration.
Precision, accuracy, recovery, and matrix effect
The precision and accuracy of the developed method were evaluated in rat plasma with QC samples at different concentrations (1.2, 60, and 300 ng/mL) before detection. The inter‐day and intra‐day precisions over consecutive days were determined by analyzing each QC sample with different concentrations of AZD‐3759. Precision was expressed as relative standard deviation (RSD), which was required to be < 15%. The acceptance criteria for accuracy was within 85–115%, except for LLOQ (≤ 20%).
The recovery rate was calculated using the peak area ratios of analytes from whole blood samples spiked with known concentrations of dissolved samples, and precipitated blank whole blood samples at the same concentration at three QC levels as the percent extraction recoveries.
Parallelism of diluted study samples was evaluated with diluted standards to detect matrix effects. Nonspecific binding was also determined. The matrix effect was evaluated by comparing the ratio (A/B × 100%) of peak response of AZD‐3759 containing an equivalent amount, both extracted from blank plasmas (A) and dissolved in pure standard solution (B).
Stability
Quality control samples with three different concentrations (n = 6 for each) were stored at different temperatures for different times to evaluate the short and long‐term stability of AZD‐3759. The QC samples were found stable after storage at room temperature for 24 hours and −20°C for three weeks, respectively. Samples were stable after three freeze and thaw cycles after storage at −20°C for 24 hours and thawing at room temperature.
Pharmacokinetic study
Twelve Sprague–Dawley rats (200–250 g) were used in the experiment. Before drug administration, all rats were fasted for 12 hours, only receiving water. A single oral dose of AZD‐3759 (dissolved in CMC‐Na solution) was administered at 10 mg/kg. Blood samples (about 0.3 mL) were collected at 0.0833, 0.25, 0.5, 1, 1.5, 2, 4, 6, 8, 10, 12, 24, and 36 hours. Samples were centrifuged at 3500 rpm for 10 minutes and plasma were kept at −20°C for storage. The pharmacokinetic parameters of the study were: the maximum plasma concentration (Cmax), the maximum plasma time (Tmax), the area under the plasma concentration–time curve (AUC), the plasma clearance (CL), and the half‐life (t1/2). These were calculated using DAS software version 3.2.8 (The People's Hospital of Lishui, Lishui, China).
Results
Method development
Good peak symmetry, a short retention time, and appropriate ionization were obtained using the mobile phase of acetonitrile and water (0.1% formic acid) with gradient elution. AZD‐3759 and IS diazepam gave protonated precursor molecular ions [M + H]+ in the positive ionization mode. As shown in Figure 1, the major ions detected were m/z 460.38→141 for AZD‐3759 and m/z 285.1→193.1 for diazepam (IS), with retention times of 1.19 and 2.21 minutes, respectively. Compared to the liquid‐liquid extraction method, protein precipitation with acetonitrile showed a higher recovery rate. The total running time for one sample was only three minutes using our method and exhibited high detection sensitivity.
Figure 1.
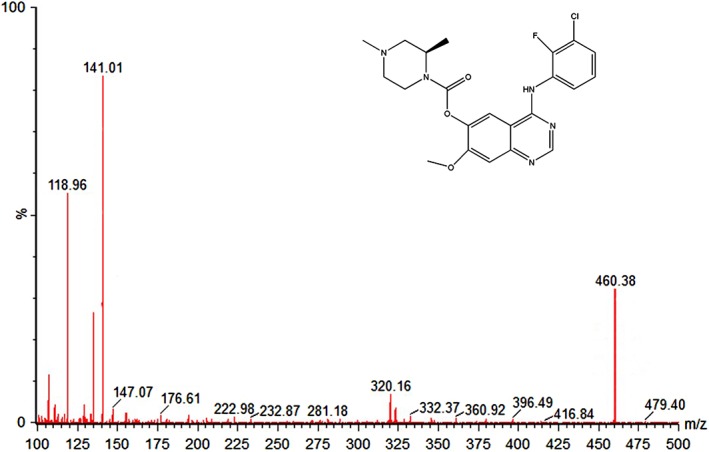
Mass spectrometer spectrum of the peaks corresponding to AZD‐3759.
To obtain the best chromatographic condition, the mobile phase modifier acetonitrile/methanol‐water (0, 0.1, 0.2, 0.3 and 0.5% [v/v] formic acid), gradient elution type (isocratic elution and gradient elution), and flow rate (0.2, 0.3, 0.4 and 0.5 mL/min) were systematically investigated. The results indicated that the best condition was acetonitrile‐0.1% formic acid with a flow rate of 0.4 mL/minute on a CORTECS BEH C18 column (2.1 × 50 mm, 1.6 μm). Under this condition, the spread of the peaks was reduced, whereas the sensitivity was improved compared to those on a UPLC BEH C18 column (2.1 × 50 mm, 1.7 μm). Acetonitrile instead of methanol was used to quantify AZD‐3759 because methanol could produce a strong peak response for AZD‐3759 and diazepam.
Sample preparation was also important for the determination of AZD‐3759. In this study, acetonitrile was chosen as the protein precipitation solvent because it exhibited a better precipitation effect than methanol, with acceptable recoveries. Our UPLC–MS/MS method for one sample can be completed within three minutes with an LLOQ of 0.5 ng/mL for AZD‐3759.
Matrix effect and selectivity
The MRM chromatograms of AZD‐3759 and diazepam, blank plasma sample (A), blank plasma sample spiked with AZD‐3759 and IS (B), and plasma sample at 0.5 hours after oral administration of 10 mg/kg AZD‐3759 (C) are shown in Figure 2. No interfering peaks were found at the retention time of AZD‐3759 and IS. To describe the matrix effect, low, medium, and high concentrations (1.2, 60, and 300 ng/mL) of AZD‐3759 were prepared before detection. As a result, the measured concentrations were 94.17 ± 8.2%, 118.46 ± 10.6%, and 106.2 ± 9.7% of theoretical values of added AZD‐3759, respectively (n = 6).
Figure 2.

The multiple reaction monitoring chromatograms of AZD‐3759 and diazepam. (a) Blank plasma sample, (b) blank plasma sample with AZD‐3759 and internal standard (IS), and (c) plasma sample at 0.5 hours after oral administration of 10 mg/kg AZD‐3759. 1: ADZ‐3759; 2: diazepam; 3: Total ion chromatogram.
Linearity and the LLOQ
Calibration curves over three consecutive days showed excellent linearity ranging from 1 to 500 ng/mL, which could meet the needs very well for a determination of AZD‐3759. The regression equation fitted was: Y = 0.010471X + 0.0119161, r = 0.9995, where Y represents the peak area ratios of analyte to IS, and X represents the AZD‐3759 plasma concentration. The LLOQ of AZD‐3759 in rat plasma was 0.5 ng/mL, which yielded a precision of 6.27%.
Precision, accuracy, and recovery
The RSDs of QC samples over three validation days were evaluated as the precision of the method. The inter‐day and intra‐day precision was < 10% at each QC level. The accuracy of the method ranged from 85.3% to 111.7% at each QC level. The mean recovery value of AZD‐3759 was > 76.4%. The recovery of the IS was 92.5%. Assay performance data is presented in Table 1, which meets the criteria for biological analysis.
Table 1.
The inter‐day and intra‐day precision, accuracy, and recovery of AZD‐3759 in rat plasma (n = 6)
| Concentration (ng/ml) | RSD (%) | Accuracy (%) | Recovery (%) | |||
|---|---|---|---|---|---|---|
| Intra‐day | Inter‐day | Intra‐day | Inter‐day | |||
| Compound | 1.2 | 5.23 | 7.19 | 106.33 ± 5.56 | 102.22 ± 7.35 | 84.92 ± 4.5 |
| 60 | 8.22 | 4.48 | 97.86 ± 8.04 | 98.79 ± 4.42 | 80.51 ± 3.97 | |
| 300 | 3.01 | 3.01 | 103.90 ± 3.13 | 102.73 ± 3.1 | 83.68 ± 3.35 | |
RSD, relative standard deviation.
Carry‐over
No background interfacing peaks (≥ 20% of the LLOQ, 5% of the IS) were left in the blank plasma samples on the chromatogram. In addition, strong wash (methanol–water, 50/50, V/V) and weak wash (methanol–water, 10/90, V/V) were automatically performed after each injection in the program to ensure that no carry over material could be detected in the assay.
Stability
No significant loss of stability of AZD‐3759 in rat plasma was observed at low, medium, or high concentrations (1.2, 60, and 300 ng/mL). Long‐term, room temperature storage, and freeze‐thaw cycle conditions were evaluated and are shown in Table 2. All stability tests of AZD‐3759 in rat plasma indicated that the RSDs of the responses were < 15%.
Table 2.
Stability of AZD‐3759 under various conditions (n = 6)
| Condition | Concentration (ng/ml) | RSD (%) | Accuracy (%) | |
|---|---|---|---|---|
| Added | Measured | |||
| Room temperature, 24h | 1.2 | 1.236 | 9.04 | 103.0 |
| 60 | 60.079 | 3.52 | 100.1 | |
| 300 | 297.481 | 2.73 | 99.2 | |
| −20°C, 3 weeks |
1.2 | 1.283 | 4.77 | 106.9 |
| 60 | 60.841 | 6.23 | 101.4 | |
| 300 | 298.063 | 5.93 | 99.4 | |
| 3 freeze‐thaw cycles | 1.2 | 1.286 | 12.28 | 107.2 |
| 60 | 61.841 | 4.27 | 103.1 | |
| 300 | 318.076 | 3.99 | 106.0 | |
RSD, relative standard deviation.
Pharmacokinetic study
The pharmacokinetic study on rats orally administered AZD‐3759 (dissolved in CMC‐Na solution) with 10 mg/kg was successfully performed using the validated UPLC‐MS/MS method. Detailed pharmacokinetic parameters are shown in Table 3. The mean plasma concentration–time curve of AZD‐3759 is shown in Figure 3.
Table 3.
Primary pharmacokinetic parameters after oral administration of AZD‐3759 in rats (n = 6, Mean ± SD)
| Pharmacokinetics parameters | Oral administration (n = 6) |
|---|---|
| AUC(0–t) (ng/mL·h) | 4301.756 ± 890.667 |
| AUC(0–∞) (ng/mL·h) | 4403.952 ± 904.901 |
| MRT(0–t) (h) | 9.178 ± 0.932 |
| MRT(0–∞) (h) | 9.649 ± 1.358 |
| t1/2 (h) | 3.481 ± 0.91 |
| Tmax (h) | 9 ± 1.897 |
| CL (L/h/kg) | 2.339 ± 0.403 |
| Vz (L/kg) | 11.781 ± 3.872 |
| Cmax (ng/mL) | 325.983 ± 63.936 |
AUC, area under the plasma concentration–time curve; CL, plasma clearance; Cmax, maximum plasma concentration; MRT, mean residence time; SD, standard deviation; t1/2, half‐life; Tmax, maximum plasma time.
Figure 3.

Mean plasma concentration time profile after oral administration of AZD‐3759 (10 mg/kg) in rats (mean ± standard deviation). ( ) AZD3759
Discussion
Since the application of AZD‐3759 in clinics, most studies have focused on the effectiveness of this drug in NSCLC patients.1,5 To date, no time‐saving pharmacokinetic study method has been reported in an animal model to facilitate a pharmacokinetic study in the clinic. In the present study, a simple, precise, and accurate UPLC–MS/MS method for the quantitation of AZD‐3759 in rat plasma was established, using 100 μL of plasma with an LLOQ of 0.5 ng/mL. The UPLC–MS/MS method can successfully be applied to a pharmacokinetic study of AZD‐3759 after oral administration in rats and this method provides a foundation for the pharmacokinetic detection of AZD‐3759 in a clinical setting.
Disclosure
No authors report any conflict of interest.
Acknowledgments
This work was supported by a grant funded by the Medical and Health Research Project of Zhejiang Province (2015KYB457), the Medical Key Disciplines Research and Development Project of Lishui (No. 2016zdxk05), the City‐level Public Welfare Technology Application Research Project of Lishui (No. 2016GYX41 & 2016GYX42), and the Hospital Pharmacy Special Research Project of Zhejiang Province Pharmaceutical Association (No. 2016ZYY39).
Contributor Information
Hongfeng Tong, Email: tonghongfeng0355@bjhmoh.cn.
Weiwen Qiu, Email: weiwenq@hotmail.com.
References
- 1. Zeng Q, Wang J, Cheng Z et al Discovery and evaluation of clinical candidate AZD3759, a potent, oral active, central nervous system‐penetrant, epidermal growth factor receptor tyrosine kinase inhibitor. J Med Chem 2015; 58: 8200–15. [DOI] [PubMed] [Google Scholar]
- 2. Yang Z, Guo Q, Wang Y et al AZD3759, a BBB‐penetrating EGFR inhibitor for the treatment of EGFR mutant NSCLC with CNS metastases. Sci Transl Med 2016; 8: 368ra172. [DOI] [PubMed] [Google Scholar]
- 3. Planchard D. AZD3759 for CNS metastases in EGFR‐mutant lung cancer. Lancet Respir Med 2017; 5: 841–2. [DOI] [PubMed] [Google Scholar]
- 4. Li X, Wang Y, Wang J et al Enhanced efficacy of AZD3759 and radiation on brain metastasis from EGFR mutant non‐small cell lung cancer. Int J Cancer 2018; 143: 212–24. [DOI] [PubMed] [Google Scholar]
- 5. Ahn MJ, Kim DW, Cho BC et al Activity and safety of AZD3759 in EGFR‐mutant non‐small‐cell lung cancer with CNS metastases (BLOOM): A phase 1, open‐label, dose‐escalation and dose‐expansion study. Lancet Respir Med 2017; 5: 891–902. [DOI] [PubMed] [Google Scholar]
- 6. Zhou Y, Wang S, Geng P, Zhang Q, Ma J. Pharmacokinetic interaction between lapatinib and sorafenib following single and co‐oral administration in rats. Lat Am J Pharm 2014; 33: 1718–22. [Google Scholar]
- 7. Wang S, Wu H, Huang X et al Determination of N‐methylcytisine in rat plasma by UPLC‐MS/MS and its application to pharmacokinetic study. J Chromatogr B Analyt Technol Biomed Life Sci 2015; 990: 118–24. [DOI] [PubMed] [Google Scholar]
- 8. Zhou Y, Wang S, Ding T et al Evaluation of the effect of apatinib (YN968D1) on cytochrome P450 enzymes with cocktail probe drugs in rats by UPLC‐MS/MS. J Chromatogr B Analyt Technol Biomed Life Sci 2014; 973C: 68–75. [DOI] [PubMed] [Google Scholar]
- 9. Wang X, Wang S, Ma J et al Pharmacokinetics in rats and tissue distribution in mouse of berberrubine by UPLC‐MS/MS. J Pharm Biomed Anal 2015; 115: 368–74. [DOI] [PubMed] [Google Scholar]
- 10. Davies A, Hayes AK, Knight K, Watmough SJ, Pirmohamed M, Clark RE. Simultaneous determination of nilotinib, imatinib and its main metabolite (CGP‐74588) in human plasma by ultra‐violet high performance liquid chromatography. Leuk Res 2010; 34: 702–7. [DOI] [PubMed] [Google Scholar]
- 11. Zhou Y, Wang S, Geng P et al Determination of terbinafine and its main metabolite in rat plasma by UPLC‐MS/MS: Application to a pharmacokinetic study. Lat Am J Pharm 2015; 34: 443–8. [Google Scholar]
- 12. Wang S, Ding T, Chen J et al Development of a UPLC‐MS/MS method for determination of tacrolimus and cyclosporine A in human whole blood. Lat Am J Pharm 2015; 34: 253–8. [Google Scholar]
- 13. Oostendorp RL, Beijnen JH, Schellens JH, Tellingen O. Determination of imatinib mesylate and its main metabolite (CGP74588) in human plasma and murine specimens by ion‐pairing reversed‐phase high‐performance liquid chromatography. Biomed Chromatogr 2007; 21: 747–54. [DOI] [PubMed] [Google Scholar]
- 14. Wang S, Zhou Y, Geng P, Zhang Q, Wen C. Pharmacokinetic interaction study between imatinib with sorafenib in rats. Lat Am J Pharm 2014; 33: 1723–7. [Google Scholar]
- 15. Ma J, Wang S, Huang X et al Validated UPLC–MS/MS method for determination of hordenine in rat plasma and its application to pharmacokinetic study. J Pharm Biomed Anal 2015; 111: 131–7. [DOI] [PubMed] [Google Scholar]
- 16. Wang X, Wang S, Lin F et al Pharmacokinetics and tissue distribution model of cabozantinib in rat determined by UPLC‐MS/MS. J Chromatogr B Analyt Technol Biomed Life Sci 2015; 983–984: 125–31. [DOI] [PubMed] [Google Scholar]
- 17. Chen DX, Geng PW, Zhang LJ et al Pharmacokinetic study of duloxetine in rat by liquid chromatography mass spectrometry. Lat Am J Pharm 2015; 34: 2078–83. [Google Scholar]
- 18. Luo XH, Geng PW, Zhang J et al Pharmacokinetic study of dabrafenib in rat plasma by UPLC‐MS/MS. Lat Am J Pharm 2015; 34: 1791–6. [Google Scholar]
- 19. Cai J, Zhu LR, Jiang X, Lv WH, Lian YY, Zou HL. Pharmacokinetic study of venlafaxine and its metabolite O‐desmethyl‐venlafaxine in rats by UPLC‐MS/MS. Lat Am JPharm 2016; 35: 226–32. [Google Scholar]