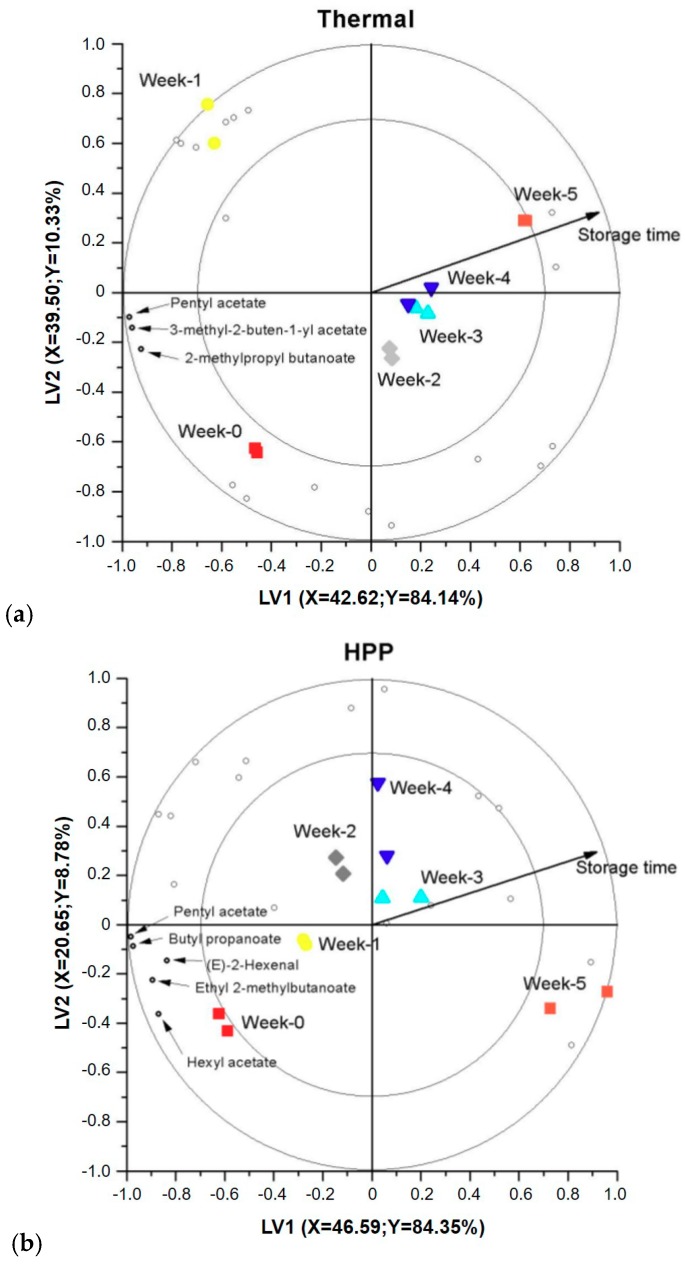
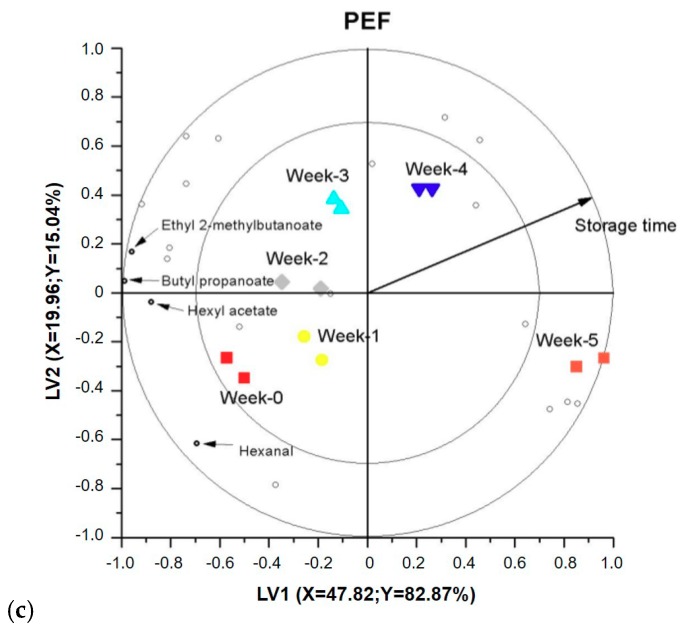
Figure 2.
PLS-DA biplots showing the change in the volatile fraction of thermally (72 °C for 15 s) (a), HPP (600 MPa for 3 min) (b) and PEF (15.5 kV/cm and specific energy of 158 kJ/L) (c) pasteurized apple juice during refrigerated storage (from week 0 ■, 1 ●, 2 ♦, 3 ▲ to 4 ▼). The volatile compounds are represented with open circles. Volatiles clearly changing as a function of shelf life (which are discriminant markers) are named.


