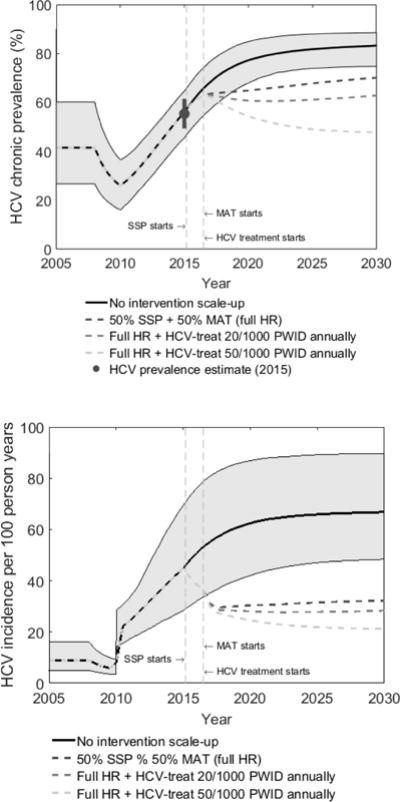
Figure 1.

HCV chronic prevalence (a) and incidence (b) amongst PWID over time for different intervention scenarios.
Figure 1 shows median projections from 1000 model fits, with 95% credibility intervals only shown for the no intervention scale-up scenario. SSP denotes syringe service programs and MAT denotes medication-assisted treatment. Full HR denotes full harm reduction which is defined as 50% coverage of both SSP and MAT. HCV treatment started in mid-2016 with two scenarios being shown (20 or 50 per 1000 PWID being treated annually). Incidence is estimated amongst susceptible PWID. Figure 1a also shows chronic HCV prevalence estimate model was calibrated to.
