

Abstract
Lymphoid enhancer factor 1 (LEF1) activity is associated with progression of several types of cancers. The role of LEF1 in progression of hepatocellular carcinoma (HCC) remains poorly known. We investigated LEF1 expression in HCC and its interactions with epithelial‐mesenchymal transition (EMT) regulators (e.g., Snail, Slug, Twist) and stemness genes (e.g., octamer‐binding transcription factor 4 [Oct4], sex determining region Y‐box 2 [Sox2], Nanog homeobox [Nanog]). Microarray analysis was performed on resected tumor samples from patients with HCC with or without postoperative recurrence. LEF1 expression was associated with postoperative recurrence as validated by immunohistochemical staining in another HCC cohort. Among 74 patients, 44 displayed a relatively high percentage of LEF1 staining (>30% of HCC cells), which was associated with a reduced recurrence‐free interval (P < 0.001) and overall survival (P = 0.009). In multivariate analysis, a high percentage of LEF1 staining was significantly associated with low albumin level (P = 0.035), Twist overexpression (P = 0.018), Snail overexpression (P = 0.064), co‐expression of Twist and Snail (P = 0.054), and multinodular tumors (P = 0.025). Down‐regulation of LEF1 by short hairpin RNA decreased tumor sphere formation, soft agar colony formation, and transwell invasiveness of HCC cell lines Mahlavu and PLC. Xenotransplant and tail vein injection experiments revealed that LEF1 down‐regulation in Mahlavu reduced tumor size and metastasis. LEF1 up‐regulation in Huh7 increased sphere formation, soft agar colony formation, and transwell invasiveness. LEF1 was shown to physically interact with and transcriptionally activate promoter regions of Oct4, Snail, Slug, and Twist. Furthermore, Oct4, Snail, and Twist transactivated LEF1 to form a regulatory positive‐feedback loop. Conclusion: LEF1 plays a pivotal role in HCC progression through transcriptional regulation of Oct4 and EMT regulators.
Abbreviations
- CHIP
chromatin immunoprecipitation
- EMT
epithelial‐mesenchymal transition
- HCC
hepatocellular carcinoma
- IHC
immunohistochemistry
- IWR
inhibitor of Wnt signaling
- KLF4
Kruppel‐like factor 4
- LEF1
lymphoid enhancer factor 1
- Luc
luciferase
- Nanog
Nanog homeobox
- Oct4
octamer‐binding transcription factor 4
- pcDNA
control vector
- RC
remote control
- sh
short hairpin
- siRNA
small interfering RNA
- Sox2
sex determining region Y‐box 2
- TCF
T‐cell factor protein
- TGF
transforming growth factor
- TVGH
Taipei Veterans General Hospital
- WRE
Wnt‐responsive element
Hepatocellular carcinoma (HCC) is the fifth leading cause of cancer‐related deaths worldwide.1 A high incidence of HCC recurrence, including tumor invasion, intrahepatic spread, and metastasis, is frequently observed even in patients who have undergone “curative” therapy (tumor resection, liver transplantation, or logo‐regional ablation therapy).2 Chemotherapy and targeted therapy have limited effects on advanced HCC.3 To develop effective strategies for treating HCC and improving long‐term survival in patients with HCC, it is essential to elucidate the molecular mechanisms underlying progression of this cancer.
Epithelial‐mesenchymal transition (EMT) is a reversible dedifferentiation process whereby polarized immotile epithelial cells lose adherence and tight junctions and become migratory mesenchymal cells.4 The process is initiated by suppression of E‐cadherin expression by major EMT regulators, such as Snail, Slug, and Twist. EMT activation triggers tumor cell invasion and metastasis to distant organs. Epithelial cancer cells may also acquire a self‐renewal stem cell phenotype through EMT.5, 6 We demonstrated previously that EMT occurs in >50% of primary HCC samples and that Snail and Twist expression is associated with EMT, HCC metastasis, and postoperative recurrence.7 Elucidation of the molecular mechanisms that underlie modulation of EMT regulators is therefore essential for development of therapeutic strategies against HCC.
Lymphoid enhancer factor/T‐cell factor proteins (LEF/TCFs) mediate Wnt signals in the nucleus by inducing β‐catenin and its coactivators to bind to specific Wnt‐responsive elements (WREs) present in promoters or enhancers of genes. This activity is crucial in a variety of cellular processes, including cell proliferation, cell fate decision, cell migration, and stem cell maintenancee8; on the other hand, its dysregulation plays a role in processes related to cancer progression, including tumorigenesis and EMT.9, 10 The LEF/TCF family is a small subset of the high‐mobility group box protein family,11 and four of its members are present in most vertebrates: TCF7 (TCF1), TCF7L1 (TCF3), TCF7L2 (TCF4), and LEF1 (TCF7L3).11, 12, 13, 14 Nuclear LEF1/TCF normally interacts with Groucho corepressors, preventing transcription of Wnt target genes. Signaling events and interactions that stabilize β‐catenin result in activation of LEF1/TCF‐mediated transcription.15, 16 Cooperative interactions between LEF/TCFs (mostly LEF1) and other transcription factors may affect transcriptional activation and binding to targets.17 Overexpression of LEF1 has been linked to EMT and to the self‐renewal ability of stem cells.18, 19 However, the role of LEF1 in transcriptional regulation of EMT regulators during HCC progression remains unclear.
In this study, we investigated LEF1 expression profiles in tissues from patients with HCC, correlation between LEF1 and HCC recurrence, and interactions among LEF1, EMT regulators, and stemness gene octamer‐binding transcription factor 4 (Oct4). Our findings indicate that LEF1 plays a key role in HCC progression through transcriptional regulation of cancer stem‐like cell properties and EMT regulators.
Materials and Methods
Clinical samples
A total of 87 fresh samples of malignant tumor tissues and counterpart nonmalignant tissues from patients with HCC were obtained during surgery at Taipei Veterans General Hospital, Taiwan (TVGH). These samples were snap frozen, stored in liquid nitrogen for RNA extraction, and then subjected to microarray analysis.20
For immunohistochemistry (IHC) staining, another independent cohort of 74 primary HCC samples were obtained separately from patients who had undergone resection surgery at TVGH. Paraffin‐embedded sections of these samples were produced by the Pathology Department of TVGH.
The HCC samples used in this study were original tumors obtained from the first operations of patients. All procedures and experiments performed in this study were in compliance with the Helsinki Declaration and approved by the Institutional Review Board of TVGH.
Microarray data sets
The array data set obtained from the 87 tissue samples described above was submitted by our group to the National Center for Biotechnology Information Gene Expression Omnibus (http://www.ncbi.nlm.nih.gov/geo) with accession number GSE45267.20 Our previous study indicated that gene expression profiles and underlying hepatocarcinogenesis in rarely seen early onset patients with HCC with increased stemness marker expression and decreased hepatic differentiation traits are unique and largely different from those in much more common elderly patients.20We therefore excluded samples obtained from young patients (age <45 years) and selected 49 samples from older patients with HCC (age ≥45 years) for microarray analysis. To investigate candidate genes associated with HCC recurrence, microarray data were analyzed for both histopathologic and recurrence status, and the 49 samples were accordingly categorized into four groups: nontumorous liver; nonrecurrent patient; recurrent patient; tumorous liver.
To investigate the functional role of LEF1 expression, we also analyzed the public data set from the Gene Expression Omnibus database of human hepatic cell data (accession number GSE14897), which contains samples from three groups of cells (human fibroblasts, human fibroblast‐derived induced pluripotent stem cells, and human embryonic stem cells) and their hepatic differentiated progenies.
Gene expression array and data analysis
To identify candidate genes associated with recurrent HCC, microarray analysis was performed using Human Genome U133 Plus 2.0 arrays (Affymetrix) as per the manufacturer's protocol. Total RNA sample preparation, complementary RNA probe preparation, and array hybridization were performed as described.20 Data analysis was performed as described in the preceding section. Raw data of CEL files were preprocessed using the R statistical programming language (http://www.r-project.org), and normalized gene expression values were obtained using the RMA algorithm of the Bioconductor affy package.21 Genes differentially expressed in contrast groups were identified using the Bioconductor limma package.22 A false discovery rate algorithm23 was applied to calculate corresponding adjusted P values. Probe sets with adjusted P ≤ 0.01 were identified as primary candidate genes from comparisons of contrast groups. These genes were grouped into five gene sets (Supporting Table S1), and final candidate genes (probe sets) were selected from the intersection of all gene sets (Supporting Fig. S1).
IHC Staining
IHC staining was performed on 74 paraffin‐embedded sections of primary HCC samples as described above. Primary antibodies used for IHC, their retrieval conditions, and incubation periods are listed in Supporting Table S2. Detailed procedures are described in the Supporting Materials and Methods.
Knockdown and overexpression of lef1 in hcc cell lines
Human HCC cell lines Huh7, PLC, Hep3B, and Mahlavu (American Type Culture Collection, Rockville, MD) were maintained in Dulbecco's modified Eagle's medium with 10% fetal bovine serum. The short hairpin (sh)LEF1 clone was obtained and lentivirus production performed at the National RNAi Core Facility, Academia Sinica, Taiwan. Detailed procedures are described in the Supporting Materials and Methods.
Antibodies and western blot quantification
Primary and secondary antibodies used for western blotting are listed in Supporting Table S2. Western blot quantification was performed using the Image J software program (National Institutes of Health, Bethesda, MD). Percent intensity was calculated by normalizing the indicated gene protein level to the glyceraldehyde 3‐phosphate dehydrogenase protein level; i.e., % intensity = (intensity of indicated protein/intensity of glyceraldehyde 3‐phosphate dehydrogenase protein) × 100 (Supporting Table S3). Quantification results are presented in Supporting Table S3. Blot results shown are representative of similar results from three independent experiments.
Ultralow attachment spheroid assay, colony formation assay, and invasion assay
For the spheroid assay, cells were cultured on ultralow attachment plates at densities of 1,000/mL in medium as described.24, 25 Detailed procedures for this assay, colony formation assay, and invasion assay are described in the Supporting Materials and Methods.
Animals and generation of xenografts
Immunodeficient mice were supplied by BioLASCO Taiwan (under a technology license from Charles River Laboratories, Wilmington, MA) and housed under specific pathogen‐free conditions at the TVGH Animal Facility. LEF1 knockdown cells (Mahlavu‐shLEF1) and control cells (Mahlavu‐short hairpin luciferase [shLuc]) were harvested during the mid‐logarithmic growth phase. Cells (5 × 10⁶) were injected subcutaneously into 8‐week‐old nude (BALB/c) mice, and mice were killed after 4 weeks. Each experimental group contained six mice. Tumor size was measured as length × height × width × 0.5236. For the metastasis assay, cells (2 × 10⁶) were injected into the tail vein of 8‐week‐old NOD‐SCID (NOD.CB17‐Prkdcscid/NcrCrlBltw) mice. Mice were killed after 6 weeks, and numbers and volumes of metastatic tumors were assessed blindly by two independent experts as described.26 Following subcutaneous or tail vein cell implantation, mice were anesthetized by intraperitoneal injection of ketamine hydrochloride (150 mg/kg) and xylazine (12 mg/kg) (Phoenix Pharmaceuticals, St. Joseph, MO) or by inhalation of isoflurane (3%‐5%). All protocols involving animals were in compliance with the Regulations of the Institutional Animal Care and Use Committee of TVGH. All procedures were in accordance with institutional animal welfare guidelines and designed to minimize suffering.
Cloning of gene promoter regions, site‐directed mutagenesis, transient transfections, and luc assays
Primer sequences used for polymerase chain reaction amplification of indicated promoter regions are listed in Supporting Table S4. Site‐directed mutagenesis was performed using a QuikChange Lightning Site‐Directed Mutagenesis Kit (cat #210518; Agilent Technologies, Highlands Ranch, CO) as per the manufacturer's instructions. Transfections and reporter assays were performed on Huh7 cells as described,7 with the bacterial β‐galactosidase gene (pSV40‐βgal) used as the control for transfection efficiency. Luc activity value was normalized to β‐galactosidase activity; i.e., fold change of Luc activity = normalized Luc activity of Huh7 cells transfected with indicated expression vectors with or without vehicle treatment/normalized Luc activity of cells transfected with control vector (pcDNA) with vehicle treatment. For reporter assays, three independent experiments were performed in triplicate. Results shown are representative of similar results from one of three experiments. For β‐catenin knockdown, a pool of small interfering (si)RNAs targeted to β‐catenin (cat # sc‐29209; Santa Cruz Biotechnology) was transiently transfected into Huh7 cells as per the manufacturer's protocol. Detailed procedures are described in the Supporting Materials and Methods.
Chromatin immunoprecipitation assay
Standard chromatin immunoprecipitation (CHIP) assays were performed using EZ‐CHIP (cat # 17‐371; Millipore Corporation) as per the manufacturer's instructions. Primers and antibodies used are listed in Supporting Tables S2 and S4. In brief, Mahlavu cells (1 × 10⁷) were fixed with 1% formaldehyde, and the cell pellet was resuspended in 1 mL sodium dodecyl sulfate lysis buffer containing 1X protease inhibitor cocktail II. Cell lysate (400 µL) was aliquoted, and chromatin was sheared by seven sets of 10‐second pulses on ice using a Cole Parmer (Branson 250) digital sonifier. Cell lysates (input, positive control) containing protein and DNA complexes were pulled down by the indicated antibodies (anti‐LEF1, anti‐Snail, anti‐Twist, anti‐Slug), with immunoglobulin G as the negative control. Enriched transcription factor‐binding DNA fragments (Octp, Twistp, Snailp, Slugp, LEF1p) were amplified by polymerase chain reaction using primers as listed in Supporting Table S4 (indicated by CHIP). For remote control (RC) DNA fragments (OctpRC, TwistpRC, SnailpRC, SlugpRC, LEF1pRC), primer pairs were designed to detect DNA fragments >1 kb away from predicted transcription factor‐binding DNA element of the indicated genome (Supporting Table S4; indicated as RC). Results shown are representative of similar results from one of two independent experiments.
Statistical analysis
Pearson's chi‐square analysis or Fisher's exact test were performed to compare categorical variables, and continuous variables were compared by the Mann‐Whitney U test. Cumulative overall survival rates and recurrence‐free rates following resection surgery were estimated by the Kaplan‐Meier method and compared by the log‐rank test. Variables with statistically significant (P < 0.05) or near statistically significant (P < 0.1) differences based on univariate analysis were included in the multivariate analysis using a forward stepwise Cox regression model. Differences with two‐tailed P < 0.05 were considered statistically significant. Statistical analyses were performed using the SPSS software program (PASW Statistics 18; IBM, Armonk, NY). Repeated measurements in animal experiments were analyzed using the Friedman test two‐way analysis of variance (Statistical Analysis System; SAS Institute, Cary, NC). Differences with P < 0.05 from three independent experiments were considered significant. For reporter assays, means of groups were compared by unpaired two‐tailed Student t tests. Differences with P < 0.05 were considered significant.
Results
Effect of lef1 overexpression on hcc recurrence and survival
Microarray analysis indicated that 22 up‐regulated probe sets were recurrence‐related genes. Certain crucial regulatory genes (e.g., LEF1, metal response element binding transcription factor 2 [MTF2], and tumor necrosis factor superfamily 4 [TNFSF4]) were observed in these probe sets (Supporting Table S5). A heat map was constructed using the top 10 ranked probe sets (Supporting Fig. S2). Based on the prediction results and z‐score, only two probe sets are ranked in the top 10 in both Supporting Tables S6 and S7 (LEF1 and dickkopf WNT signaling pathway inhibitor 1 [DKK1]).27 The high‐mobility group box domain of LEF1 has been shown to physically interact with Smad3, an essential mediator of transforming growth factor β1 (TGF‐β1).28 TGF‐β and Wnt signaling pathways, key pathways involved in HCC progression, can independently or cooperatively regulate LEF1/TCF target genes.28 In this study, we examined the role of LEF1 in HCC progression; this role remains poorly understood.
The significance of high LEF1 expression was investigated by IHC analysis. In an independent cohort of 74 HCC cases, 44 (59.5%) exhibited positive LEF1 staining, defined as >30% positively stained HCC cells (Fig. 1A). High LEF1 expression levels were observed in 59.5% of patients with HCC. LEF1 overexpression was associated with a shorter recurrence‐free interval (P < 0.001; Fig. 1B) and overall survival (P = 0.009; Fig. 1C). Among primary HCC cases, a high LEF1 level was associated with multiple nodules, large tumor size, and lower albumin levels. LEF1 overexpression was associated with Twist overexpression (P = 0.018), Snail overexpression (P = 0.064), and multinodular tumors (P = 0.025) (Table 1). LEF1 overexpression showed no association with hepatitis B surface antigen or hepatitis C antibody status, two major risk factors associated with HCC.
Figure 1.

LEF1 overexpression is associated with a shorter recurrence‐free interval and overall survival. (A) Representative IHC patterns of LEF1 expression in liver and tumor tissues from 74 patients with HCC (brown color, LEF1 immunostaining). LEF1 is differentially expressed in liver tissues from patients with HCC. (B,C) Survival analysis of 74 patients with HCC by the Kaplan‐Meier method. (B) Recurrence‐free survival rate and (C) overall survival rate were both significantly lower (P < 0.001) in patients with high (solid circle) versus low (open circle) LEF1 expression.
Table 1.
Comparative Demographic Data for Patients With Versus Without LEF1 Overexpression
| Total (n = 74) | LEF1 <30% (n = 30) | LEF1 ≥30% (n = 44) | P Value | |
|---|---|---|---|---|
| Demographics | ||||
| Age (years)* | 57.0; 46.0‐67.0 | 54.5; 45.5‐66.0 | 58.5; 47.3‐68.0 | 0.530 |
| Sex (% male/female) | 62/12 (83.8%/16.2%) | 25/5 (83.3%/16.7%) | 37/7 (84.1%/15.9%) | 1.000 |
| Serum biochemistry | ||||
| Albumin (g/dL)* | 4.1; 3.9‐4.4 | 4.2; 4.0‐4.5 | 4.0; 3.8‐4.4 | 0.035 |
| Bilirubin (mg/dL)* | 0.9; 0.7‐1.2 | 0.8; 0.6‐1.1 | 1.0; 0.7‐1.2 | 0.308 |
| ALT (U/L)* | 37.5; 25.8‐67.3 | 37.0; 25.0‐64.0 | 38.5; 26.5‐71.8 | 0.599 |
| ALP (U/L)* | 83.5; 71.8‐112.8 | 81.5; 74.3‐98.3 | 86.0; 70.3‐127.8 | 0.172 |
| Tumor factors | ||||
| Tumor size (cm)* | 4.4; 2.5‐7.6 | 3.7; 2.5‐6.8 | 4.7; 2.7‐9.9 | 0.055 |
| Multinodular tumor Y/N (%) | 30/44 (40.5%/59.5%) | 7/23 (23.3%/76.7%) | 23/21 (52.3%/47.7%) | 0.025 |
| Macroscopic venous invasion Y/N (%) | 10/64 (13.5%/86.5%) | 3/27 (10.0%/90.0%) | 7/37 (15.9%/84.1%) | 0.731 |
| AFP (ng/mL)* | 20.9; 5.9‐654.5 | 11.2; 3.6‐2,001.8 | 51.2; 6.3‐577.5 | 0.988 |
| Microscopic venous invasion Y/N (%) | 33/35 (48.5%/51.5%) | 13/16 (44.8%/55.2%) | 20/19 (51.3%/48.7%) | 0.778 |
| Edmondson stage I or II / III or IV (%) | 46/18 (71.9%/28.1%) | 20/7 (74.1%/25.9%) | 26/11 (70.3%/29.7%) | 0.958 |
| EMT markers | ||||
| Beta‐catenin membrane expression Y/N (%) | 28/38 (42.4%/57.6%) | 15/11 (57.7%/42.3%) | 13/27 (32.5%/67.7%) | 0.077 |
| Slug overexpression Y/N (%) | 34/31 (52.3%/47.7%) | 12/14 (46.2%/53.8%) | 22/17 (56.4%/43.6%) | 0.577 |
| E‐cadherin down‐regulation Y/N (%) | 41/33 (55.4%/44.6%) | 13/17 (43.3%/56.7%) | 28/16 (63.6%/36.4%) | 0.137 |
| Twist overexpression Y/N (%) | 28/46 (37.8%/62.2%) | 6/24 (20.0%/80.0%) | 22/22 (50.0%/50.0%) | 0.018 |
| Snail overexpression Y/N (%) | 38/36 (51.4%/48.6%) | 11/19 (36.7%/63.3%) | 27/17 (61.4%/38.6%) | 0.064 |
| Co‐expression of Twist and Snail Y/N (%) | 20/54 (27.0%/73.0%) | 4/26 (13.3%/86.7%) | 16/28 (36.4%/63.6%) | 0.054 |
*Continuous variables are expressed as median; 25‐75 percentiles.
Abbreviations: AFP, alpha‐fetoprotein; ALP, alkaline phosphatase; ALT, alanine aminotransferase.
Effects of lef1 on self‐renewal, proliferation, tumorigenesis, and invasive properties of hcc cell lines
Differences in the LEF1 level between tumor sphere and adherent cell populations were examined in the four HCC cell lines. In our previous studies, we demonstrated that Mahlavu, compared to the other three cell lines, was more invasivee7and formed more and larger tumor spheres (Supporting Fig. S3). Protein and messenger RNA levels of LEF1 were significantly higher in tumor spheres than in adherent cells (Fig. 2A; Supporting Fig. S3).
To evaluate the role of LEF1 in tumor‐initiating properties and tumorigenesis, cell lines PLC and Mahlavu were infected with lentivirus‐carrying shRNA targeting LEF1 (shLEF1) and with nonspecific shRNA (shLuc; control). LEF1 knockdown resulted in a greater frequency of a spindle shape (Supporting Fig. S4A, upper panel) and reduced stress fiber formation and actin staining in Mahlavu and to higher levels of tight junction‐associated protein ZO‐1 in both Mahlavu and PLC (Supporting Figs. S4A, bottom panel, S5B), whereas the 3‐(4,5‐dimethylthiazol‐2‐yl)‐5‐(3‐carboxymethoxyphenyl)‐2 ‐(4‐sulfophenyl)‐2H‐tetrazolium proliferation assay showed no significant difference in growth rate between shLuc‐treated and shLEF1‐treated Mahlavu (Supporting Fig. S4B). The sphere formation assay revealed that spheres in both Mahlavu and PLC were significantly smaller and fewer in shLEF1‐treated than in shLuc‐treated cells (Fig. 2B; Supporting Fig. S5C). Similarly, colonies formed were significantly smaller and fewer for shLEF1‐treated versus shLuc‐treated cells in both lines (Fig. 2C; Supporting Fig. S5D). Subcutaneous injection into nude mice of Mahlavu cells with or without LEF1 knockdown revealed that LEF1 deficiency inhibited in vivo tumorigenesis of xenotransplants (Fig. 2E).
Figure 2.

LEF1 is required for self‐renewal, colony formation, and invasiveness of Mahlavu cells. (A, upper panel) Western blot showing enhancement of LEF1 in spheres versus adherent cells; (A, lower panel) down‐regulation of LEF1 by shRNA in HCC lines (Mahlavu, shLEF1) versus nontargeted control (shLuc). (B‐F) LEF1 down‐regulation reduces (B) sphere formation, (C) colony formation, (D) transwell invasiveness, (E) tumor size of subcutaneous xenografts (n = 6), and (F) number of metastatic lung nodules following tail vein injection of Mahlavu (n = 5). Data are shown as mean ± SD. (G) Western blot showing that LEF1 down‐regulation results in increased expression of the epithelial marker E‐cadherin but reduced expression of mesenchymal marker vimentin. GAPDH was used as the internal control. For sphere formation, colony formation, and transwell assays, three independent experiments were performed in triplicate. Results shown are representative of similar results from one of three experiments. *P < 0.05, **P < 0.01 (t test). Abbreviations: GAPDH, glyceraldehyde 3‐phosphate dehydrogenase; H&E, hematoxylin and eosin.
Boyden chamber assays with Mahlavu and PLC showed that invasion and migration abilities were lower in shLEF1‐treated cells (LEF1 down‐regulated) compared to shLuc‐treated cells (Fig. 2D; Supporting Fig. S5E). In Mahlavu, the number of colonies metastasized to lungs was lower for shLEF1‐treated cells (tail vein injection) than for shLuc‐treated cells (Fig. 2F). Western blot analysis revealed that LEF1 down‐regulation increased E‐cadherin but reduced fibronectin and vimentin expression, suggesting the involvement of LEF1 in HCC metastasis through EMT pathways (Fig. 2G; quantification results in Supporting Table S3).
To further evaluate effects of LEF1 knockdown on self‐renewal, proliferation, tumorigenesis, and invasive properties, LEF1 overexpression experiments were performed using Huh7, an HCC cell line with a low endogenous LEF1 level and low invasiveness.7 Phalloidin staining (green) showed that LEF1 overexpression induced assembly of F‐actin into thick parallel bundles of actin stress fibers across the cell surface, whereas shLuc‐treated cells displayed cortical actin staining and fewer stress fibers (Fig. 3B). LEF1 overexpression resulted in reduced levels of membrane‐bound epithelial markers ZO‐1 and E‐cadherin (Fig. 3B) and significant increases in number of spheres (Fig. 3C), colony formation in soft agar (Fig. 3D), and migration of cells through matrix (Fig. 3E).
Figure 3.

LEF1 up‐regulation alters cytoskeletal organization, ZO‐1 localization, E‐cadherin level, sphere formation ability, colony formation, and invasiveness of Huh7 cells. (A) Western blot showing different LEF1 levels in LEF1‐overexpressing (LEF1) versus vector control (pcDNA) Huh7. (B) Immunostaining with phalloidin (F‐actin, green; upper panel), anti‐ZO‐1 (Zo‐1, green; middle panel), and anti‐E‐cadherin (green; bottom panel) of LEF1 and pcDNA Huh7 (magnification ×20). Inserted images show higher magnification of F‐actin organization (magnification ×40). (C) Derived tumor spheres (magnification ×2.5). Sphere size >100 µm (~50 pixels) was counted as positive. Fold induction of sphere formation efficacy is shown as mean ± SD. (D) Derived colonies (magnification ×5). Colony size >60 µm (~30 pixels) was counted as positive. Fold induction of colony count is shown as mean ± SD (n = 3). (E) Migrated cells in transwell invasion assay (magnification ×20). Fold induction of migrated cell number is shown as mean ± SD. Abbreviations: DAPI, 4´,6‐diamidino‐2‐phenylindole; GAPDH, glyceraldehyde 3‐phosphate dehydrogenase.
Reciprocal regulation between lef1 and oct4
Western blot analysis of both Mahlavu and PLC revealed that LEF1 down‐regulation reduced expression of pluripotency‐associated genes involved in self‐renewal (Oct4 but not sex determining region Y‐box 2 [Sox2], Nanog homeobox [Nanog], or Kruppel‐like factor 4 [KLF4]) (Fig. 4A; Supporting Fig. S6; quantification results in Supporting Table S3). LEF1 overexpression in Huh7 resulted in an increased level of Oct4 but not of Sox2, Nanog, or KLF4 (Fig. 4A; quantification results in Supporting Table S3). We therefore investigated the possible role of LEF1 in transcriptional regulation of Oct4. Results of CHIP and promoter activity assays revealed that LEF1 bound to two LEF1/TCF‐binding sites in the proximal region of the Oct4 promoter (Fig. 4B). Reporter assays showed that LEF1 caused a 7‐fold increase of reporter activity relative to control of the Oct4 promoter (Fig. 4C). To determine whether LEF1 binding is specific and crucial, LEF1 consensus binding sequences (5′‐CAAAG‐3′ or complementary sequence 5′‐CTTTG ‐3′; black letters in Figs. 4B, 5B) were mutated (red letters). Disruption of LEF1 binding sites significantly reduced Oct4 promoter activity in response to LEF1 induction (Fig. 4D). On the other hand, Oct4 overexpression increased Luc activity induced by the LEF1 promoter (Supporting Fig. S7).
Figure 4.
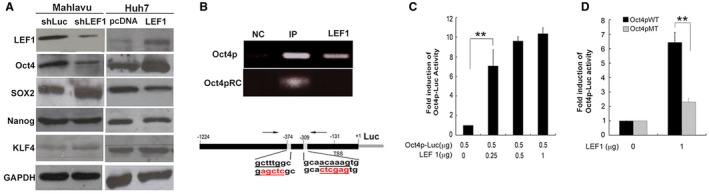
LEF1 binds to and transcriptionally activates the Oct4 promoter region. (A) Western blot showing differential effects of LEF1‐downregulated (shLEF1) Mahlavu versus LEF1‐overexpressing Huh7 (LEF1) on expression of stemness genes Oct4, Sox2, and Nanog. (B, upper panel) CHIP assay with Mahlavu showing direct association of LEF1 with LEF1 binding sites of Oct4 promoter. Oct4p is an Oct4p DNA fragment, amplified by primers flanking LEF1 binding sites; Oct4pRC (negative control) is a PCR‐amplified DNA fragment using an RC primer; LEF1 is anti‐LEF1 (see Materials and Methods). Results shown are representative of similar results from one of two independent experiments. (B, lower panel) schematic diagram showing positions of primers used in the CHIP assay (arrows), reporter constructs encoding luciferase (gray line) derived from the cloned Oct4 promoter region (black line), location of the LEF1 binding site (gray rectangle), and LEF1 consensus binding sequence (black letters) and its mutated sequence (red letters). (C,D) Reporter assays with Huh7 showing transcriptional activation by LEF1 of the Oct4 promoter region. Oct4pWT/MT is the luciferase reporter carrying the wild‐type/mutated LEF1 consensus binding sequence. For the reporter assays, three independent experiments were performed in triplicate. Results shown are representative of similar results from one of three experiments. Error bars represent mean ± SD of at least three independent experiments. **P < 0.01 (t test). Abbreviations: GAPDH, glyceraldehyde 3‐phosphate dehydrogenase; IP, input, positive control; MT, mutated; NC, negative control immunoglobulin G; PCR, polymerase chain reaction; TSS, transcription start site; WT, wild type.
Figure 5.

LEF1 is physically associated with and transcriptionally regulates EMT regulators Snail, Twist, and Slug. (A) Western blots showing that down‐regulation (Mahlavu; shLEF1) or overexpression of LEF1 (Huh7; LEF1) alters expression of Snail, Slug, and Twist. (B, upper panel) CHIP assays with Mahlavu showing LEF1 binding to Snail, Slug, and Twist promoter regions. Twistp, Snailp, Slugp show PCR‐amplified DNA fragment using primers flanking LEF1 binding sites. SnailpRC, TwistpRC, SlugpRC show PCR‐amplified DNA fragments using remote control primers (see Materials and Methods). (B, lower panel) Luciferase (gray line) reporter constructs and promoter regions (black line) of Snail, Slug, and Twist; locations of LEF1 binding sites (gray rectangles), LEF1 binding consensus binding sequence (black letters) and its mutated sequence (red letters), and position of primer used for the CHIP assay (arrow). (C,D) Reporter assays with Huh7 showing specific transcriptional up‐regulation of Snail, Slug, and Twist by LEF1. Twistp, Snailp, Slugp (or Mt) show the luciferase reporter carrying the wild‐type (or mutated) LEF1 consensus binding sequence. (E, upper panel) CHIP assay with Mahlavu showing Snail and Twist binding to LEF1 promoter regions. LEF1p shows the DNA fragment amplified by primers flanking E‐box. LEF1pRC shows the PCR‐amplified DNA fragments using RC primers (see Materials and Methods). Twist is anti‐Twist. Snail is anti‐Snail. (E, bottom panel) Position of primers used for the CHIP assay (arrow), LEF1 promoter region (bold black line) used to make the luciferase reporter (gray line) construct, locations of E‐box (gray rectangles), and E‐box (Twist, Snail, Slug consensus binding sequence; black letters) and its mutated sequence (red letters). (F) Reporter assays with Huh7 showing transcriptional activation of LEF1 expression by Snail and Twist but not Slug. LEF1pWT/Mt is the luciferase reporter carrying the wild‐type/mutated E‐box sequence. For the reporter assay, three independent experiments were performed in triplicate. Error bars represent the mean ± SD of at least three independent experiments. Results shown are representative of similar results from one of three experiments. *P < 0.05, **P < 0.01 (t test). Abbreviations: GAPDH, glyceraldehyde 3‐phosphate dehydrogenase; IP, input, positive control; Mt, mutated; NC, negative control; PCR, polymerase chain reaction IgG; TSS, transcription start site.
Reciprocal regulation between lef1 and emt regulators
Western blot analysis of both Mahlavu and PLC revealed that LEF1 down‐regulation reduced protein levels of major EMT regulators Twist, Snail, and Slug (Fig. 5A; Supporting Fig. S6; quantification results in Supporting Table S3). CHIP assays showed that LEF1 bound to their promoter regions (Fig. 5B). To test possible transcriptional regulation by LEF1 of these EMT regulators, we cloned their promoter regions and disrupted the LEF1 binding sites located in the proximal regions of each promoter. Reporter assays showed that LEF1 overexpression caused a 2‐fold to 4‐fold increase of Luc activity (Fig. 5C). Disruption of LEF1 binding sites in promoter regions reduced such Luc activity induction (Fig. 5D). We also examined the promoter region of LEF1 and found that E‐box, the binding element of Snail, Twist, and Slug, was located in the promoter region close to the transcription initiation site. The CHIP assay showed that Snail and Twist bound to E‐box but Slug did not (Fig. 5E; binding elements shown as black letters). The reporter assay revealed that Snail and Twist overexpression induced LEF1 promoter activity. A mutation in E‐box (Fig. 6E, red letter) reduced LEF1 promoter activity in response to Twist and Snail. Slug had no notable effect on LEF1 promoter activity (Fig. 6F).
Figure 6.

LEF1 transcriptionally regulates Twist and Slug independently (in part) of β‐catenin. (A‐C) Following introduction of reporter constructs, transfected cells were treated with 0.1 µg/mL Wnt‐3a with/without 800 nM IWR‐endo (Wnt signaling inhibitor) (left panel), cotransfected with 2.5 µL siRNA targeted to β‐catenin (middle panel), or transfected with DLEF1 (N‐terminal deletion mutant of LEF1 in which β‐catenin‐binding domain is lacking) (right panel). (A) Reporter assays showing that induction of Snail promoter by LEF is partially dependent on β‐catenin. (B,C) Induction by LEF1 of Twist or Slug promoter activities was independent of β‐catenin. Results shown are representative of similar results from two independent experiments performed in triplicate. Means of groups were compared by unpaired, two‐tailed Student t test. *P < 0.05. **P < 0.01. (D) Western blot confirming efficacy of β‐catenin siRNA.
Lef1 may activate transcription of emt regulators by a β‐catenin‐independent mechanism
LEF1/TCF1 has been shown to mediate Wnt signals by recruiting β‐catenin and its coactivators WREs of target genes. To determine whether transcriptional control of EMT regulators by LEF1 depends only on β‐catenin, we used inhibitors of Wnt signaling (IWR, IWR‐endo),29 siRNA targeted to β‐catenin, and a deletion mutant of the LEF1 β‐catenin‐binding domain to examine effects of β‐catenin activity on the reporter assay in the presence and absence of LEF. Reporter construct TOP flash,30 a plasmid containing WREs, was used initially to determine whether Huh7 cells responded to Wnt‐3a. Luc activity was induced by Wnt‐3a, and such induction was inhibited by IWR (Supporting Fig. S8). The effect of Wnt‐3a was enhanced by LEF1 overexpression and reduced by IWR, suggesting that induction in Huh7 of WREs of TOP flash by LEF1 overexpression depends only partially or not at all on β‐catenin. To determine whether induction of Twist, Slug, and Snail promoters by LEF1 overexpression in Huh7 depends on β‐catenin activity, we treated cells with IWR and a pool of siRNAs targeted to β‐catenin in combination with LEF1 overexpression in the presence and absence of Wnt‐3a. IWR and β‐catenin siRNA partially affected Snail promoter activity but had no effect on Twist or Slug promoter activities induced by LEF1 overexpression. Similarly, deletion of β‐catenin‐binding domain of LEF1 had no effect on induction activity of Twist and Slug promoters but partially reduced induction activity of Snail promoter (Fig. 6A‐C). The efficacy of β‐catenin siRNA was confirmed by western blotting (Fig. 6D).
Discussion
LEF1 is the major mediator of Wnt signaling pathways and acts as a promoter of metastasis in several types of cancers.9, 10 The number of published reports focused on the role of LEF1 in HCC compared to other human cancers is small. This study is the first to use two independent cohorts to clearly demonstrate a clinical relationship between LEF1 and HCC and describes mechanisms whereby LEF1 differentially regulates expression of stemness genes Oct4, Sox2, and Nanog and forms a transcriptional regulation loop with EMT regulators Twist and Snail. Our findings also suggest that LEF1 overexpression enhances expression of Twist and Slug independent of β‐catenin.
We showed previously that EMT occurs in >50% of primary HCC samples and that Snail and Twist expression was associated with EMT, HCC metastasis, and postoperative recurrence.7 Of eight HCC cell lines examined in that study, Twist and Snail expression and invasiveness were highest for Mahlavu, intermediate for PLC, and lowest for Huh7. In the present study, effects of LEF1 knockdown on important HCC phenotypes (morphology, sphere formation, soft agar colony formation, transwell invasion, tumorigenesis in nude mice) were examined in Mahlavu, PLC, and Huh7. We found that LEF1 knockdown in Mahlavu and PLC notably altered morphology and reduced self‐renewal and invasiveness, whereas LEF1 up‐regulation in less‐invasive Huh7 altered morphology and increased self‐renewal and invasiveness. Our consistent findings in these three distinctive HCC lines clearly demonstrate the crucial role of LEF1 in HCC self‐renewal and invasiveness.
In HCC, both TGF‐β and Wnt play key roles in EMT triggering and in transcriptional regulation of LEF1.4, 8, 31 Huang et al.18 reported that in response to Wnt signaling, LEF1 binds to stabilized β‐catenin and helps maintain an undifferentiated status of embryonic stem cells through up‐regulation of Oct4 promoter activity and physical interaction with Nanog. In this study, LEF1 bound to Oct4 promoter and activated Oct4 expression but showed no such effects on Nanog, KLF4, or Sox2. Reprogramming for maintenance of stem cell status and the self‐renewal property may require activation of stemness genes at different stages.32 The mechanisms underlying differential activation of these factors remain poorly understood. Consistent with the report by Sun et al.33 that Oct4 in HCC regulates LEF1 to activate the LEF1/β‐catenin‐dependent WNT signaling pathway and promote EMT, findings of the present study indicate that reciprocal regulation between LEF1 and Oct4 in HCC plays a crucial role in maintaining self‐renewal properties. Such regulation is based on specific promoter binding and transcriptional activation.
The Wnt signaling pathway has been shown to be involved in posttranslational regulation of Snail.34, 35 Our present findings suggest that LEF1 is involved in transcriptional regulation of other EMT regulators. Transactivation of Snail and Twist by LEF1 evidently occurs through its binding to promoters of these genes and leads to up‐regulation of these EMT regulators, which in turn promotes EMT and HCC recurrence, in agreement with our previous report.10 Snail and Twist but not Slug transcriptionally regulate LEF1 expression and create a “positive‐feedback loop” for cancer progression, consistent with our previous finding that Snail and Twist play roles more important than that of Slug in HCC progression.7
Niemann et al.36 reported an association between tumor progression and inhibition of Wnt signaling. Mutation or deletion of the N‐terminus of LEF1 (DN32Lef1) eliminated β‐catenin binding. Transgenic mice overexpressing the deletion mutant of the LEF1 β‐catenin‐binding domain under control of the K14 promoter had a high rate of sebaceous tumor development.37 A high proportion of human sebaceous adenomas had double nucleotide substitutions in exon 1 of the LEF1 gene, and amino acid substitutions E45K and S61P in the N‐terminus reduced LEF1 binding to β‐catenin and β‐catenin‐dependent transcription.38 Several lines of evidence indicate that LEF1 overexpression cooperates with factors other than β‐catenin.10, 39, 40, 41, 42 To avoid off‐target effects of IWR‐1, we knocked down β‐catenin using an siRNA mixture. IWR or β‐catenin siRNA treatment enhanced the effects of LEF1 transcriptional activation on Twist and Slug promoters. These findings suggest that LEF1 activates EMT regulators through a β‐catenin‐independent pathway, which could have significant clinical implications. Wnt/β‐catenin signaling is involved in liver organogenesis during embryonic development,43 whereas the Wnt/β‐catenin pathway is generally inactive in normal adult liver.44 In HCC, β‐catenin accumulation is observed in 10%‐50% of tumors and is correlated with tumor progression and poor prognosis.45 Although considerable research effort has been focused on the development of Wnt inhibitors, there are no U.S. Food and Drug Administration‐approved drugs available for clinical application that are based on targeting the Wnt/β‐catenin signaling pathway.46, 47 A major obstacle to development of such drugs is the crucial role of the Wnt/β‐catenin pathway in normal development and adult tissue homeostasis. Thus, extreme care is necessary to assure that any potential anticancer drug based on targeting the Wnt/β‐catenin pathway avoids the risk of inhibiting proregenerative processes. In view of the wide variety of Wnt/β‐catenin inhibitors that target different subcellular levels, it is important to select appropriate agents for specific targets.47, 48 Our present findings indicate that LEF1 expression affects HCC progression, in part, in a β‐catenin‐independent manner. HCC is a highly heterogeneous type of cancer, and its progression is based on activation of multiple pathways. Selection of the best therapeutic option for an individual patient requires knowledge of the genomic background of the tumor. The present findings provide important new insights into the molecular mechanisms involved in HCC progression and a basis for novel anti‐HCC therapies that target LEF1 separately from the Wnt/β‐catenin pathway.
In summary, we demonstrate here that LEF1 transcriptionally activates expression of EMT regulators (Snail, Twist) and stemness gene Oct4 and that such activation plays a crucial role in cancer self‐renewal and progression. Snail and Twist can also transactivate LEF1 and create a positive‐feedback loop for cancer progression. Activation of EMT regulators by LEF1 occurs in part through a β‐catenin‐independent pathway.
Supporting information
Acknowledgment:
We gratefully acknowledge the array services provided by the Microarray and Gene Expression Analysis Core Facility, supported by the National Research Program for Genomic Medicine, National Science Council, of the National Yang‐Ming University VGH Genome Research Center, the Taiwan Liver Cancer Network for validation of HCC RNAs, and the High‐Throughput Genome and Big Data Analysis Core Facility of the National Core Facility Program for Biotechnology, Ministry of Science and Technology, Taiwan, for support in bioinformatics analysis. We are also grateful to Dr. J.F. Engelhardt for providing LEF1 promoter‐Lac Z reporter constructs, to Hsin‐Yu Tseng for technical consultation, to Dr. Chou TY (TVGH) for providing IHC sections, to Dr. M.H. Yang for discussion and comments on the manuscript, to our late friend Dr. Hsei‐Wei Wang for invaluable suggestions regarding the study, and to Dr. S. Anderson for English editing of the manuscript.
The study sponsors played no role in study design, analysis, or interpretation of data.
Additional Supporting Information may be found at https://onlinelibrary.wiley.//10.1002/hep4.1229/full.
Supported by grants from the Ministry of Health and Welfare (MOHW106‐TDU‐B‐211‐144‐003, MOHW107‐TDU‐B‐211‐114019 to J.C.W.) and in part from National Yang‐Ming University (104AC‐T302, 107CRC‐T206 to J.C.W.), the Ministry of Education (to J.C.W.), Cathay General Hospital (101‐CGH‐FJU‐15 to C.L.C. and J.T.H.), and Shin Kong Wu Ho‐Su Memorial Hospital (103‐SKH‐FJU‐05 to C.L.C.). This work was financially supported by the Cancer Progression Research Center, National Yang‐Ming University from The Featured Areas Research Center Program within the framework of the Higher Education Sprout Project by the Ministry of Education in Taiwan (to J.C.W).
View this article online at wileyonlinelibrary.com.
Potential conflict of interest: Nothing to report.
Potential conflict of interest: Nothing to report.
References
Author names in bold designate shared co‐first authorship.
- 1. Chen DS. Hepatocellular carcinoma in Taiwan. Hepatol Res 2007;37(Suppl. 2):S101‐S105. [DOI] [PubMed] [Google Scholar]
- 2. Thorgeirsson SS, Grisham JW. Molecular pathogenesis of human hepatocellular carcinoma. Nat Genet 2002;31:339‐346. [DOI] [PubMed] [Google Scholar]
- 3. Zhu AX. Molecularly targeted therapy for advanced hepatocellular carcinoma in 2012: current status and future perspectives. Semin Oncol 2012;39:493‐502. [DOI] [PubMed] [Google Scholar]
- 4. Singh A, Settleman J. EMT, cancer stem cells and drug resistance: an emerging axis of evil in the war on cancer. Oncogene 2010;29:4741‐4751. [DOI] [PMC free article] [PubMed] [Google Scholar]
- 5. Mani SA, Guo W, Liao MJ, Eaton EN, Ayyanan A, Zhou AY, et al. The epithelial‐mesenchymal transition generates cells with properties of stem cells. Cell 2008;133:704‐715. [DOI] [PMC free article] [PubMed] [Google Scholar]
- 6. Morel AP, Lievre M, Thomas C, Hinkal G, Ansieau S, Puisieux A. Generation of breast cancer stem cells through epithelial‐mesenchymal transition. PLoS One 2008;3:e2888. [DOI] [PMC free article] [PubMed] [Google Scholar]
- 7. Yang MH, Chen CL, Chau GY, Chiou SH, Su CW, Chou TY, et al. Comprehensive analysis of the independent effect of twist and snail in promoting metastasis of hepatocellular carcinoma. Hepatology 2009;50:1464‐1474. [DOI] [PubMed] [Google Scholar]
- 8. Logan CY, Nusse R. The Wnt signaling pathway in development and disease. Annu Rev Cell Dev Biol 2004;20:781‐810. [DOI] [PubMed] [Google Scholar]
- 9. Nelson WJ, Nusse R. Convergence of Wnt, beta‐catenin, and cadherin pathways. Science 2004;303:1483‐1487. [DOI] [PMC free article] [PubMed] [Google Scholar]
- 10. Arce L, Yokoyama NN, Waterman ML. Diversity of LEF/TCF action in development and disease. Oncogene 2006;25:7492‐7504. [DOI] [PubMed] [Google Scholar]
- 11. Giese K, Cox J, Grosschedl R. The HMG domain of lymphoid enhancer factor 1 bends DNA and facilitates assembly of functional nucleoprotein structures. Cell 1992;69:185‐195. [DOI] [PubMed] [Google Scholar]
- 12. Oosterwegel M, van de Wetering M, Dooijes D, Klomp L, Winoto A, Georgopoulos K, et al. Cloning of murine TCF‐1, a T cell‐specific transcription factor interacting with functional motifs in the CD3‐epsilon and T cell receptor alpha enhancers. J Exp Med 1991;173:1133‐1142. [DOI] [PMC free article] [PubMed] [Google Scholar]
- 13. Travis A, Amsterdam A, Belanger C, Grosschedl R. LEF‐1, a gene encoding a lymphoid‐specific protein with an HMG domain, regulates T‐cell receptor alpha enhancer function. Genes Dev 1991;5:880‐894. [DOI] [PubMed] [Google Scholar]
- 14. Korinek V, Barker N, Willert K, Molenaar M, Roose J, Wagenaar G, et al. Two members of the Tcf family implicated in Wnt/beta‐catenin signaling during embryogenesis in the mouse. Mol Cell Biol 1998;18:1248‐1256. [DOI] [PMC free article] [PubMed] [Google Scholar]
- 15. Brunner E, Peter O, Schweizer L, Basler K. pangolin encodes a Lef‐1 homologue that acts downstream of Armadillo to transduce the Wingless signal in Drosophila. Nature 1997;385:829‐833. [DOI] [PubMed] [Google Scholar]
- 16. Cavallo RA, Cox RT, Moline MM, Roose J, Polevoy GA, Clevers H, et al. Drosophila Tcf and Groucho interact to repress Wingless signalling activity. Nature 1998;395:604‐608. [DOI] [PubMed] [Google Scholar]
- 17. Hsu SC, Galceran J, Grosschedl R. Modulation of transcriptional regulation by LEF‐1 in response to Wnt‐1 signaling and association with beta‐catenin. Mol Cell Biol 1998;18:4807‐4818. [DOI] [PMC free article] [PubMed] [Google Scholar]
- 18. Huang C, Qin D. Role of Lef1 in sustaining self‐renewal in mouse embryonic stem cells. J Genet Genomics 2010;37:441‐449. [DOI] [PubMed] [Google Scholar]
- 19. Medici D, Hay ED, Goodenough DA. Cooperation between snail and LEF‐1 transcription factors is essential for TGF‐beta1‐induced epithelial‐mesenchymal transition. Mol Biol Cell 2006;17:1871‐1879. [DOI] [PMC free article] [PubMed] [Google Scholar]
- 20. Wang HW, Hsieh TH, Huang SY, Chau GY, Tung CY, Su CW, et al. Forfeited hepatogenesis program and increased embryonic stem cell traits in young hepatocellular carcinoma (HCC) comparing to elderly HCC. BMC Genom 2013;14:736. [DOI] [PMC free article] [PubMed] [Google Scholar]
- 21. Gautier L, Cope L, Bolstad BM, Irizarry RA. affy‐analysis of Affymetrix GeneChip data at the probe level. Bioinformatics 2004;20:307‐315. [DOI] [PubMed] [Google Scholar]
- 22. Smyth GK. limma: linear models for microarray data In: Gentleman R, Carey VJ, Huber W, Irizarry RA, Dudoit S, eds. Bioinformatics and Computational Biology Solutions Using R and Bioconductor. New York, NY: Springer; 2005:397‐420. [Google Scholar]
- 23. Benjamini Y, Hochberg Y. Controlling the false discovery rate: a practical and powerful approach to multiple testing. J R Stat Soc Ser B Stat Methodol 1995;57:289‐300. [Google Scholar]
- 24. Booth BW, Boulanger CA, Anderson LH, Jimenez‐Rojo L, Brisken C, Smith GH. Amphiregulin mediates self‐renewal in an immortal mammary epithelial cell line with stem cell characteristics. Exp Cell Res 2010;316:422‐432. [DOI] [PMC free article] [PubMed] [Google Scholar]
- 25. Lee CC, Lai JH, Hueng DY, Ma HI, Chung Y, Sun YY, et al. Disrupting the CXCL12/CXCR25 axis disturbs the characteristics of glioblastoma stem‐like cells of rat RG2 glioblastoma. Cancer Cell Int 2013;13:85. [DOI] [PMC free article] [PubMed] [Google Scholar]
- 26. Santini D, Vincenzi B, Tonini G, Scarpa S, Baldi A Zoledronic acid exhibits inhibitory effects on osteoblastic and osteolytic metastases of prostate cancer. Clin Cancer Res 2003;9:3215‐3216. [PubMed] [Google Scholar]
- 27. Chen L, Li M, Li Q, Wang CJ, Xie SQ. DKK1 promotes hepatocellular carcinoma cell migration and invasion through beta‐catenin/MMP7 signaling pathway. Mol Cancer 2013;12:157. [DOI] [PMC free article] [PubMed] [Google Scholar]
- 28. Labbe E, Letamendia A, Attisano L. Association of Smads with lymphoid enhancer binding factor 1/T cell‐specific factor mediates cooperative signaling by the transforming growth factor‐beta and wnt pathways. Proc Natl Acad Sci U S A 2000;97:8358‐8363. [DOI] [PMC free article] [PubMed] [Google Scholar]
- 29. Chen B, Dodge ME, Tang W, Lu J, Ma Z, Fan CW, et al. Small molecule‐mediated disruption of Wnt‐dependent signaling in tissue regeneration and cancer. Nat Chem Biol 2009;5:100‐107. [DOI] [PMC free article] [PubMed] [Google Scholar]
- 30. Chuang KA, Lieu CH, Tsai WJ, Wu MH, Chen YC, Liao JF, et al. Evaluation of anti‐Wnt/beta‐catenin signaling agents by pGL4‐TOP transfected stable cells with a luciferase reporter system. Braz J Med Biol Res 2010;43:931‐941. [DOI] [PubMed] [Google Scholar]
- 31. Eastman Q, Grosschedl R. Regulation of LEF‐1/TCF transcription factors by Wnt and other signals. Curr Opin Cell Biol 1999;11:233‐240. [DOI] [PubMed] [Google Scholar]
- 32. Liu X, Sun H, Qi J, Wang L, He S, Liu J, et al. Sequential introduction of reprogramming factors reveals a time‐sensitive requirement for individual factors and a sequential EMT‐MET mechanism for optimal reprogramming. Nat Cell Biol 2013;15:829‐838. [DOI] [PubMed] [Google Scholar]
- 33. Sun L, Liu T, Zhang S, Guo K, Liu Y. Oct4 induces EMT through LEF1/beta‐catenin dependent WNT signaling pathway in hepatocellular carcinoma. Oncol Lett 2017;13:2599‐2606. [DOI] [PMC free article] [PubMed] [Google Scholar]
- 34. Yook JI, Li XY, Ota I, Hu C, Kim HS, Kim NH, et al. A Wnt‐Axin2‐GSK3beta cascade regulates Snail1 activity in breast cancer cells. Nat Cell Biol 2006;8:1398‐1406. [DOI] [PubMed] [Google Scholar]
- 35. Yook JI, Li XY, Ota I, Fearon ER, Weiss SJ. Wnt‐dependent regulation of the E‐cadherin repressor snail. J Biol Chem 2005;280:11740‐11748. [DOI] [PubMed] [Google Scholar]
- 36. Niemann C, Owens DM, Schettina P, Watt FM. Dual role of inactivating Lef1 mutations in epidermis: tumor promotion and specification of tumor type. Cancer Res 2007;67:2916‐2921. [DOI] [PubMed] [Google Scholar]
- 37. Niemann C, Owens DM, Hulsken J, Birchmeier W, Watt FM. Expression of DeltaNLef1 in mouse epidermis results in differentiation of hair follicles into squamous epidermal cysts and formation of skin tumours. Development 2002;129:95‐109. [DOI] [PubMed] [Google Scholar]
- 38. Takeda H, Lyle S, Lazar AJ, Zouboulis CC, Smyth I, Watt FM. Human sebaceous tumors harbor inactivating mutations in LEF1. Nat Med 2006;12:395‐397. [DOI] [PubMed] [Google Scholar]
- 39. Bruhn L, Munnerlyn A, Grosschedl R. ALY, a context‐dependent coactivator of LEF‐1 and AML‐1, is required for TCRalpha enhancer function. Genes Dev 1997;11:640‐653. [DOI] [PubMed] [Google Scholar]
- 40. Balmelle N, Zamarreno N, Krangel MS, Hernández‐Munain C. Developmental activation of the TCR alpha enhancer requires functional collaboration among proteins bound inside and outside the core enhancer. J Immunol 2004;173:5054‐5063. [DOI] [PubMed] [Google Scholar]
- 41. Crawford HC, Fingleton B, Gustavson MD, Kurpios N, Wagenaar RA, Hassell JA, et al. The PEA3 subfamily of Ets transcription factors synergizes with beta‐catenin‐LEF‐1 to activate matrilysin transcription in intestinal tumors. Mol Cell Biol 2001;21:1370‐1383. [DOI] [PMC free article] [PubMed] [Google Scholar]
- 42. Grumolato L, Liu G, Haremaki T, Mungamuri SK, Mong P, Akiri G, et al. beta‐Catenin‐independent activation of TCF1/LEF1 in human hematopoietic tumor cells through interaction with ATF2 transcription factors. PLoS Genet 2013;9:e1003603. [DOI] [PMC free article] [PubMed] [Google Scholar]
- 43. Nejak‐Bowen K, Monga SP. Wnt/beta‐catenin signaling in hepatic organogenesis. Organogenesis 2008;4:92‐99. [DOI] [PMC free article] [PubMed] [Google Scholar]
- 44. Gonzalez FJ. Role of beta‐catenin in the adult liver. Hepatology 2006;43:650‐653. [DOI] [PMC free article] [PubMed] [Google Scholar]
- 45. Lee HC, Kim M, Wands JR. Wnt/Frizzled signaling in hepatocellular carcinoma. Front Biosci 2006;11:1901‐1915. [DOI] [PubMed] [Google Scholar]
- 46. Novellasdemunt L, Antas P, Li VS. Targeting Wnt signaling in colorectal cancer. A review in the theme: cell signaling: proteins, pathways and mechanisms. Am J Physiol Cell Physiol 2015;309:C511‐C521. [DOI] [PMC free article] [PubMed] [Google Scholar]
- 47. Vilchez V, Turcios L, Marti F, Gedaly R. Targeting Wnt/beta‐catenin pathway in hepatocellular carcinoma treatment. World J Gastroenterol 2016;22:823‐832. [DOI] [PMC free article] [PubMed] [Google Scholar]
- 48. Blagodatski A, Poteryaev D, Katanaev VL. Targeting the Wnt pathways for therapies. Mol Cell Ther 2014;2:28. [DOI] [PMC free article] [PubMed] [Google Scholar]
Associated Data
This section collects any data citations, data availability statements, or supplementary materials included in this article.
Supplementary Materials