Abstract
Cellular function depends on heterogeneous dynamic intra-, inter-, and supramolecular structure-function relationships. However, the specific mechanisms by which cellular function is transduced from molecular systems, and by which cellular dysfunction arises from molecular dysfunction are poorly understood. We proposed previously that cellular function manifests as a molecular form of analog computing, in which specific time-dependent state transition fluxes within sets of molecular species (“molecular differential equations” (MDEs)) are sped and slowed in response to specific perturbations (inputs). In this work, we offer a theoretical treatment of the molecular mechanisms underlying cellular analog computing (which we refer to as “biodynamics”), focusing primarily on non-equilibrium (dynamic) intermolecular state transitions that serve as the principal means by which MDE systems are solved (the molecular equivalent of mathematical “integration”). Under these conditions, bound state occupancy is governed by kon and koff, together with the rates of binding partner buildup and decay. Achieving constant fractional occupancy over time depends on: 1) equivalence between kon and the rate of binding site buildup); 2) equivalence between koff and the rate of binding site decay; and 3) free ligand concentration relative to koff/kon (n · Kd, where n is the fold increase in binding partner concentration needed to achieve a given fractional occupancy). Failure to satisfy these conditions results in fractional occupancy well below that corresponding to n · Kd. The implications of biodynamics for cellular function/dysfunction and drug discovery are discussed.
Introduction
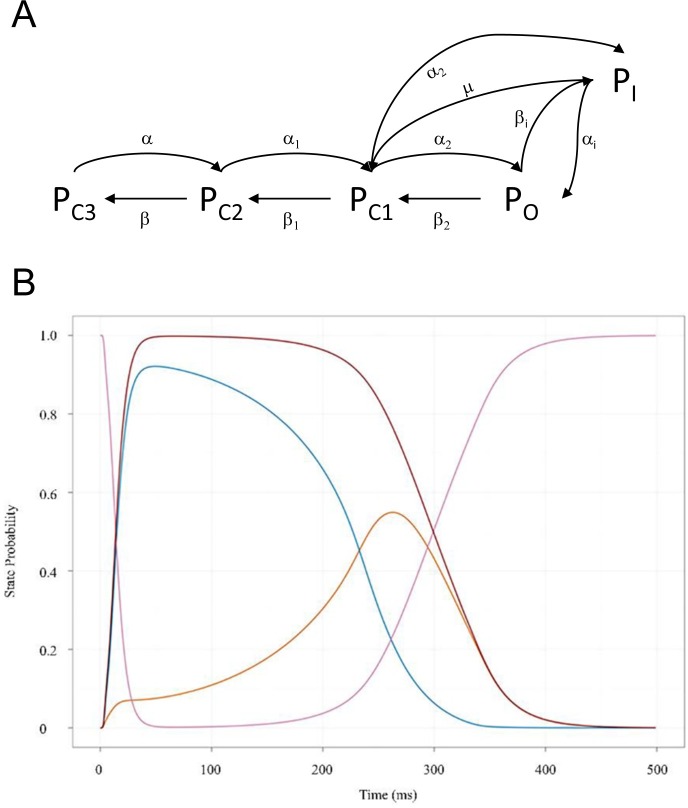
We proposed in our previous work [1] that time-dependent cellular function is derived from a molecular form of analog computing [2,3], in which sets of coupled ordinary differential equations and their integral solutions are modeled physically by changes in the rates of buildup and decay among the populations of biomolecular species to/from specific intra- and intermolecular states (the hardware and software are one and the same) (Fig 1). We referred to these constructs as “molecular differential equations” (MDEs) [1], the major forms of which include:
Fig 1.
(A) Markovian state transition behavior exemplified for the human cardiac ether-a-go-go related gene (hERG) potassium channel between closed (C1, C2, and C3), open (O) and inactivated states (I) underlying the state probability curves in (B) [4]. The rate constants are labeled with Greek letters. (B) Molecular populations of hERG “flow” from one specific state to another based on intrinsic voltage-dependent rates of entry and exit. Multiple fluxes occur in parallel between specific states, speeding and slowing in response to dynamic perturbations. For example, the open (orange) and inactive (blue) states are fed by the closed state (magenta); the open and closed states are fed by the inactive state; and the inactive and closed states are fed by the open state. The time-dependent output of the overall system (i.e. the membrane potential in this case) is solved in cardiomyocytes via integration of the full complement of sodium, potassium, and calcium ion channel MDEs (which can be simulated using the O’Hara-Rudy model of the human cardiac AP [5]).
Intramolecular:
| (1A) |
Non-covalent intermolecular:
| (1B) |
Enzyme-substrate:
| (1C) |
where dγk(t)/dt represents the rates of non-equilibrium occupancy buildup and decay of state k from one or more predecessor to one or more successor states. State transition rates are governed by adjustable barriers originating from intra- or intermolecular interactions (which we referred to as “intrinsic rates”) and time-dependent changes in the concentrations or number densities of the participating species (which we referred to as “extrinsic rates”) [1]. Molecular populations “flow” over time in a transient (Markovian) fashion from one specific structural state to another (Fig 1) in response to production/degradation or translocation-driven changes in the levels of the participating species.
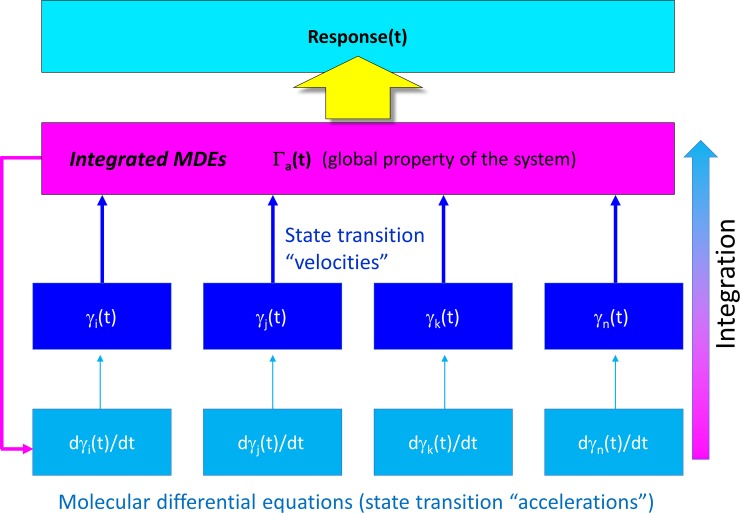
MDEs are “solved” by cells in aggregate for the corresponding time-dependent state occupancies of the participating species {dγk(t)/dt, k = 1, n} (e.g. dynamic ion channel states and currents, dynamic enzyme activation states, etc.), together with higher order (convergent) properties that we refer to as Γa(t) (Fig 2). {γk(t),k = 1, n} and Γa(t) manifest as transient stimulus-response-driven “action potential-like” waveforms, in which the intrinsic or extrinsic rates of one or more MDEs are sped or slowed in response to Γa(t) [1].
Fig 2. Cellular analog computing is based on the transduction of molecular state transitions into cellular function.
MDEs {dγk(t)/dt, k = 1, n} are “solved” in aggregate for the corresponding time-dependent state occupancies of the participating species {dγk(t)/dt, k = 1, n} (e.g. dynamic intra- and intermolecular states), together with higher order properties that we refer to as Γa(t).The underlying MDEs accelerate or decelerate recursively in response to Γa(t) according to their specific response mechanisms.
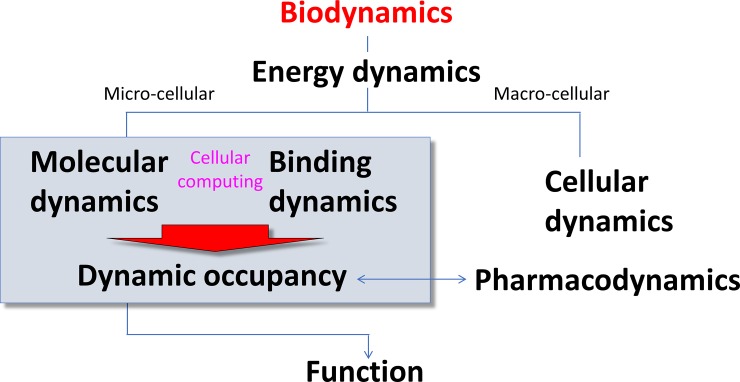
Building on our previous work [1] and that of others [2,6–11], we have developed a comprehensive multi-scale (atomistic → molecular systems) first principles theory on the basic mechanisms of cellular function that we refer to as “biodynamics” (Fig 3).
Fig 3. The six branches of biodynamics theory, which span the intra-/peri-cellular (micro-cellular) and macro-cellular levels (see text).
Such processes can be simulated using multi-scale modeling approaches, ranging from atomistic molecular dynamics-based [1] to “atom-less” time-dependent ODE-based simulations (“MDE mimetics”) [1].
Our theory encompasses the major mechanisms by which:
MDEs are generated, powered, solved (integrated), and transduced into function at the micro- and macro-cellular levels.
Cellular dysfunction results from molecular dysfunction and alterations in the corresponding MDEs and Γa(t).
Cellular dysfunction can be mitigated by exogenously applied MDEs, consisting of drug-target occupancy.
In our previous work, we described the putative mechanisms by which free energy is transduced into non-equilibrium conditions and kinetic barriers (i.e. which we refer to here as “energy dynamics”) [1,4,12–15], and exemplified cellular computing by way of the cardiac AP [4] and a generic MAP kinase-phosphatase system [1]. In this work, we focus on binding as a key “integrator” of MDE systems, and in particular, the specific implications of non-equilibrium conditions on occupancy of the bound states of both endogenous molecules and drugs (i.e. the interplay between the “molecular dynamics” and “binding dynamics” branches of our theory).
Non-equilibrium conditions are both promoted and exploited by cellular systems
Rapid, transient perturbation-induced responses underlying cellular function depend on open systems, in which mass (chemical precursors, degradation products, and other substances) and energy are exchanged to/from the extracellular volume. Such responses are dampened by reversibility in closed systems exhibiting mass and energy conservation, noting that some species may undergo slow rates of buildup and decay when the overall response rate is slow. In the classical equilibrium view, covalent or non-covalent states i and j are populated according to their free energy differences ({ΔGij}), such that the total free energy of the system is minimized. Dynamic state transitions of the participating species necessarily depend on perturbation-re-equilibration under this scenario, which is subject to the following limitations:
Perturbation-induced re-equilibration (i.e. equilibrium 1 → equilibrium 2) is time-consuming, and therefore, poorly suited for rapid biological responses.
Optimization of complex equilibria is cumbersome and offers extremely limited evolutionary adaptability.
Molecular systems are displaced from equilibrium (analogous to strain) when the participating species are continuously produced and degraded or translocated [16–21] (analogous to stress).
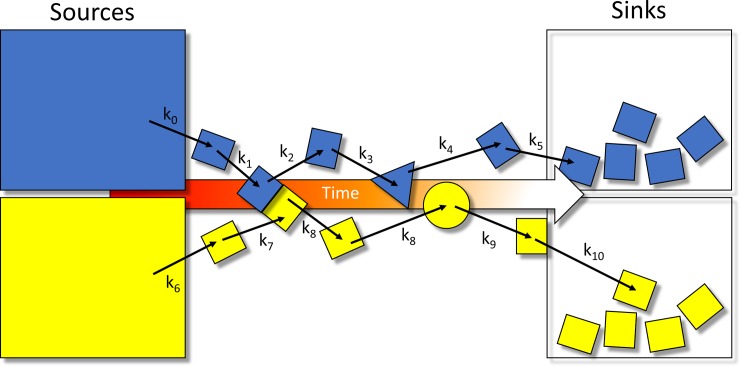
The resulting strain energy is proportional to the stress, analogous to that of a spring stretched away from its equilibrium state. Reversibility (e.g. A + B ⇌ AB) is circumvented by “tensioned” operation, in which ΔG is maintained permanently above zero via chemical or physical entry and exit of the species to/from the system over time (sources and sinks) (Fig 4). The potential energy of a system under such conditions (ΔGnoneq) is given by:
| (2) |
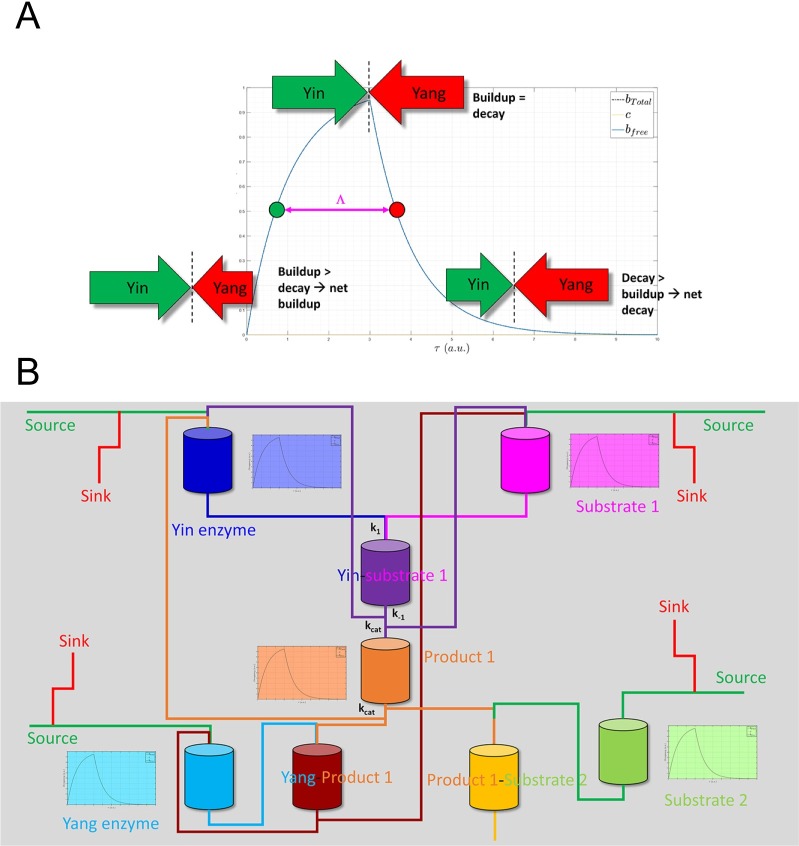
where Gstrain is the strain energy, and Geq is the equilibrium free energy. Strained systems relax via mass action upon release of the corresponding stress, wherein ΔGnoneq→ 0, and the participating species transition toward their equilibrium state distributions (i.e. [species Astate i]/[species Astate j] = Keq). Reversibility is conveyed indirectly through concurrent (but out-of-phase) buildup and decay processes (e.g. A + B → AB; AB + C → A + B + C), which we refer to as “dynamic counter-balancing” (“Ying-Yang”) (Figs 2 and 5). Examples include kinase- versus phosphatase-mediated phospho-transfer and inward versus outward ion channel currents.
Fig 4. Molecular species and states build and decay transiently (i.e. sources → sinks), thereby generating non-equilibrium conditions.
Such conditions promote unidirectional fluxes on which cellular analog computing is based.
Fig 5.
(A) Buildup and decay of a Yin (typically an enzyme), together with its substrate, product (and substrates thereof), Yang across their accessible states, as depicted by a plumbing system consisting of pipes, vessels, and valves. A given function-generating system is constituted from an interdependent collection of m such systems. Each system is maintained at non-equilibrium (analogous to “pressurization”) via continuous inputs and outputs of molecular species (“fluxes”). The dynamic fluid levels within the (n ⋅ m) member vessels of the overall system, which define its instantaneous state, are solved by integration of the m MDE collections ({dγk(t)/dt = rate of entry to state k–rate of exit from state k}i, where k = 1, 2, 3, …, n, and i = 1, 2, 3, …, m). The vessels may be connected in series or parallel. The flow rates to/from each vessel depend on the input and output valve settings (representing both the intrinsic and extrinsic free energy barriers in this simplified example), which are governed by the overall state of the system (constituting a feedback loop). (B) Dynamic counter-balancing prevents runaway exponential growth and decay of molecular species and state levels. The rates of buildup and decay consist of the net difference in Yin and Yang rates over time. The Yin-Yang balance is tipped toward the Yin during the buildup phase (left side of the blue curve) and toward the Yang during the decay phase (right side of the blue curve). The absolute rates of species or state level changes are irrelevant, except in cases where runaway behavior is functionally desirable (e.g. caspase activation). The overall buildup-decay cycle length is denoted as Λ, noting that long lived species or states likely result from slow decay rather than slow buildup (which would otherwise dampen the maximum level). Fast buildup has important implications for bound state occupancy, which are discussed later in the text.
The Yin-Yang architecture serves to:
Prevent over- and undershooting desired γk(t) due to the exponential behavior of molecular processes (noting that the integral solutions of MDEs are exponential functions). Yins and Yangs are necessarily maintained in an out-of-phase relationship by way of “clocking” (e.g. a phosphatase whose activation depends on a species whose buildup lags behind its target kinase).
Restore the initial conditions of the system.
The widespread practice of measuring biochemical (and even cellular and in vivo) effects as a function of free ligand concentration, rather than occupancy per se, reflects the extent to which the equilibrium assumption is relied upon throughout the biological sciences. However, our results suggest that time-independent equilibrium metrics of state occupancy are poor approximations to actual occupancy under cellular conditions in vivo when the rates of binding partner buildup and decay are fast.
Materials and methods
We derived two complementary analytical expressions capturing the simultaneous exponential buildup and decay of the binding site (molecular dynamics) and bound state (binding dynamics) based on a simplified second order non-competitive interaction scheme:
| (3) |
where kon is the association rate constant, koff is the dissociation rate constant, and Bfree, C, and L are the free binding site, free ligand, and bound state concentrations, respectively. The rate of change of C (the mathematical equivalent of a binding MDE) is given by:
| (4A) |
Solution of this equation is facilitated by the following assumptions:
Molecular response is proportional solely to dynamic fractional occupancy, which in some cases, may depend additionally on the binding mode (e.g. agonist, partial agonist, inverse agonist, and antagonist in the case of receptors).
-
The total binding site level (Btotal(t)) is conserved instantaneously, wherein:
(4B) That cellular systems operate in the transient regime, in which state population levels build and decay cyclically over time (although quasi-equilibrium operation is possible in some cases).
Buildup of Btotal(t) consists of the separate synthesis of the biomolecule (typically a protein) and generation of its binding-competent structural state. We further assume that state transitions occur on a timescale ≥ the rate of synthesis of the binding site-containing species.
Both free and ligand-bound binding sites are lost during degradation, whereas, in practice, different rates of degradation of the bound and unbound states are possible.
- Btotal(t) builds and decays exponentially via two distinct processes:
- Production and degradation of the binding site-containing species, or inter-compartmental transfer to/from the site of action, whichever is slower.
- Formation and loss of the binding competent structural state.
That Btotal(t) builds to the equilibrium level (B∞) at t = ∞.
-
That buildup and decay can be treated as separate sequential processes. Although Btotal(t) builds and decays simultaneously, net buildup occurs prior to B∞, followed by net decay. Possible forms of the buildup term include exponential growth (Eq 6A), positive exponential decay (Eq 6B), or logistic growth (Eq 6C). Possible forms of the decay term include exponential (Eq 6D) or logistic (Eq 6E) decay (multiphasic exponential growth and decay behaviors are also conceivable):
Buildup(6A) (6B) (6C) Decay(6D)
where B∞ is Btotal at t = ∞, ki and k-i are the buildup and decay rate constants, respectively, ξ is a characteristic time at which the function switches from net buildup to net decay, and t01 and t02 are the times at which the logistic curves reach 50% of their dynamic range during buildup and decay, respectively. We chose to approximate the buildup and decay phases of the binding site-containing species using Eq 6B (based on [22]) and 6D, and the buildup and decay phases of the binding site using Eqs 6C and 6E (Fig 6), which roughly approximates the state probability curves shown in Figs 1B and 2A.(6E) - k−i defines the lower limit of koff (i.e. koff is “hijacked” by the rate of binding site decay), necessitating correction of koff and Kd in cases where koff < k−i:
L is fixed at a constant concentration (Lo). In practice, L is expected to build and decay dynamically, which serves to further constrain the buildup of the bound state.
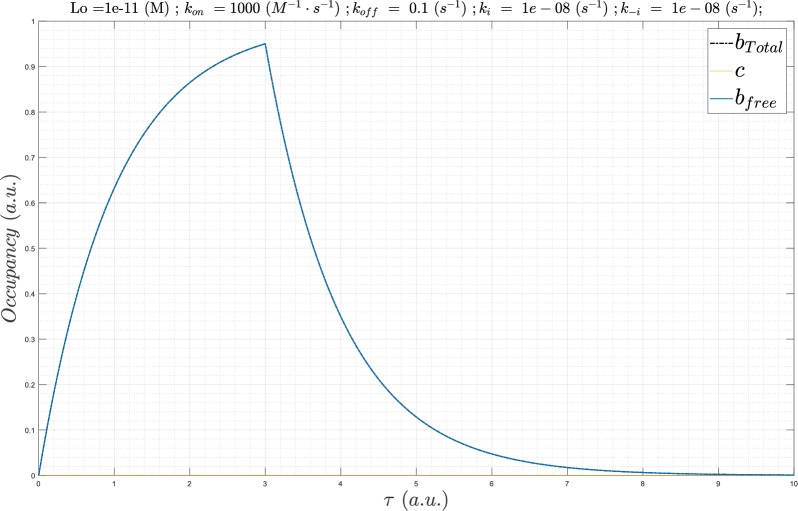
Fig 6. The buildup and decay phases of Btotal(τ) simulated using Eqs 6B and 6D (scenario 1).
The maximum Btotal(τ) is normalized to 1.0, and always occurs at the normalized time τ = 3. The curve adopts a canonical “saw-tooth” morphology.
Scenario 1: putative production and degradation of binding site-containing species
Substituting Eqs 6B and 6D into Eq 5 leads to:
| (7) |
where ξ is the time required to reach equilibrium binding (conventionally referred to as the “settling time”). The net flux switches from buildup to decay at this time. ξ is defined conventionally as the time to reach 0.95 ⋅ B∞ (which we refer to as Bmax), given that B∞ is only asymptotically reached over long time periods [22], whereas Bmax is reached over finite times. Solving for tsettling leads to:
| (8A) |
| (8B) |
Eq 7 can be recast in dimensionless form to facilitate parameter-independent occupancy comparison, reduce the dimensionality of the system, and allow grouping of the rate terms:
| (9) |
where , and = 3. Solving Eq 9 for c(τ) leads to:
| (10A-10B) |
where λ1 = −(α + β), λ2 = −1, and λ3 = 0. The behavior of Eq 10A as a function of α and β can be described as follows:
α + β > 0 (satisfied when α ≥ β) → stable conditions.
α = β → kon ⋅ L0 = koff and cancellation of ki. Under these conditions, Eq 10A reduces to:
| (11A) |
the first term of which undergoes rapid decay at α ≳ 10 (translating to , where L0 = n ⋅ Kd′), resulting in:
| (11B) |
Constant fractional occupancy exists at all time points of Eq 11B, which we define as the steady-state occupancy (SSO) profile. Conversely, variable time-dependent fractional occupancy occurs at α < 10, which we define as the non-steady-state occupancy (nSSO) profile. Unlike the equilibrium case, an asymmetric relationship exists between kon and L0 in governing dynamic occupancy, which follows from the requirement that α = β ≳ 10. The nSSO profile prevails at all non-saturating L0 in the absence of α = β ≳ 10. For example:
α = β = 1 at L0 = 1x10⁻⁹ M, kon = 1x10⁵ M-1 s-1, koff = 1x10⁻⁴ s-1, and ki = 1x10⁻⁴ s-1 (noting that only α = β is satisfied in this case).
α = 10 and β = 1 at L0 = 1x10⁻⁸ M, kon = 1x10⁵ M-1 s-1, koff = 1x10⁻⁴ s-1, and ki = 1x10⁻⁴ s-1 (noting that only α ≳ 10 is satisfied in this case).
α + β ≫ 1 → rapid decay of the first term in Eq 10A, which at infinite time, reduces to the equilibrium case:
| (12) |
We assume that species or state population levels ≥ 50% of Bmax make significant contributions to cellular function, translating to a “functional” buildup + decay time window:
| (13) |
where ki and k−i likely range between ms-1 (e.g. voltage-gated ion channels) to hr-1.
Scenario 2: putative buildup and decay of the binding competent state
Substituting Eqs 6C and 6E into Eq 5 leads to:
| (14A) |
| (14B) |
where 2F1(a,b;c;x) denotes the hypergeometric function (Fig 7). Unlike Eq 6B, Eq 6C contains a lower asymptote, which approaches zero along the negative time axis. We set Btotal(τ = 0) to 5% of its full maximum value, and then calculated τ01, τ02, and (the normalized settling time corresponding to Bmax = 95% of the final value), as follows:
| (15) |
| (16) |
| (17) |
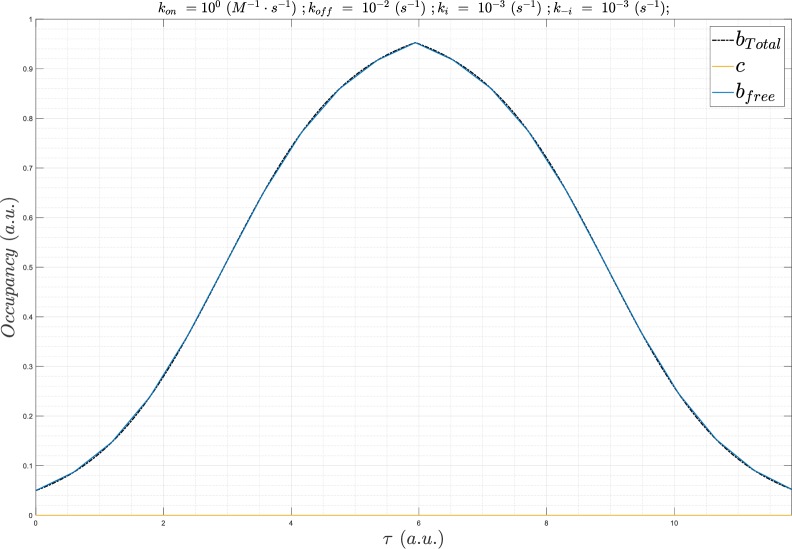
Fig 7. The buildup and decay phases of Btotal(τ) simulated using Eqs 6C and 6E (scenario 2).
The maximum Btotal(τ) is normalized to 1.0, and always occurs at τ = 6. The morphology approximately resembles that of the state transition curves in Figs 1B and 2A, keeping in mind that the plot is normalized in all cases to a uniform width of τ = 12 at all Λ.
We solved Eq 14 both analytically and numerically using Wolfram Alpha (Wolfram Research, Champaign, IL, 2017) and MATLAB (Version 9.2a, The MathWorks, Inc., Natick, MA 2017), respectively. As for scenario 1, we assume that species levels or state populations ≥ 50% of Bmax make significant contributions to cellular function, which leads to the following expression for Λ:
| (18) |
Comparison of equilibrium versus non-equilibrium occupancy
Static non-competitive, non-cooperative occupancy (γ) under equilibrium conditions can be described by the following form of the Hill equation [23]:
| (19) |
where Lo = n ⋅ Kd. Fractional occupancy under the non-equilibrium SSO profile (c(τ)) is constant over time, and is also described by Eq 19. However, Kd is non-equivalent under equilibrium versus non-equilibrium conditions:
Equilibrium: Kd = koff/kon → absolute occupancy = γ ⋅ Bo, where Bo is the fixed binding site concentration.
Non-equilibrium SSO: → absolute occupancy = γ ⋅ Btotal(t). Achieving the SSO profile depends on in-step buildup and decay with Btotal(t), which in turn, depends on .
Non-equilibrium nSSO:Kd′ = the upper limit of fractional occupancy at Bmax. nSSO occurs at all , irrespective of and Kd′. The quasi-steady-state occupancy profile is achieved at near saturating Lo levels (referred to hereinafter as qSSO).
We assume the most biologically and pharmacologically desirable profile consists of SSO (i.e. where the intrinsic and extrinsic rates are tuned), which gives rise to constant fractional occupancy (Bfree(t)/Btotal(T)) over time. However, the other profiles may suffice in cases where cellular function or pharmacological/toxic effects are driven by peak, rather than sustained occupancy (e.g. ion channel blockade vis-à-vis pro-arrhythmia [4]), which necessarily coincides with Cmax.
Characterization of dynamic binding site occupancy under conditions of time-dependent binding site availability
We used Eqs 10 and 14 to explore the effect of decreasing Λ (and, in particular, speeding ki) on achieving the SSO versus nSSO profile as a function of:
Λ: 83,000 hr (equilibrium) to 300 ms (the approximate timescale of ion channel transitions), sampled as noted.
Kd′ (for reference): fixed at 1 nM, except where otherwise noted.
kon: 1x10⁹ (diffusion limit) to 1x10³ M-1 s-1, sampled as noted.
: 1x100 to 1x10⁻⁶ s-1, sampled as noted.
L0: sampled at 1 nM (i.e. 50% occupancy at equilibrium, equating to 0.95 ⋅ 50% in our model), 19 nM (95% occupancy at equilibrium, equating to 0.95 ⋅ 95% in our model), as well as other concentrations (as noted).
Key limitations of our approach
Our generalized analytical occupancy relationships avoid assumptions about the specific dynamic mechanisms driving binding site availability. However, such simplified relationships are subject to certain limitations compared with Markov-based simulation models tailored to specific cellular systems (e.g. as was used in our previous work [1,4]), including the potential for underestimated sensitivity of dynamic occupancy to decreasing Λ resulting from: 1) the use of fixed free ligand concentration (where ligand and binding site buildup may or may not occur in phase); and 2) neglect of competition with endogenous molecules that may also build and decay over time.
Results
Whereas static occupancy can be quantified using the Hill, Michaelis-Menten, and similar algebraic expressions, quantification of dynamic occupancy necessitates more complex time-dependent differential equation-based models. However, detailed knowledge of the participating species, parameters (e.g. rate constants), and initial conditions (e.g. states and species levels) is needed to fully implement such models. We set about in this work to characterize the relationships between intrinsic and extrinsic rates and SSO versus nSSO profiles using a set of closed form dimensionless relationships that we derived for this purpose (described in Materials and methods).
Scenario 1
In this scenario, binding site lifetimes are assumed to depend on the rates of production and degradation of binding site-containing species versus formation and decay of the binding-competent state (i.e. transition to the binding competent state fully mirrors the buildup and decay of the species). was maintained in all cases, except as otherwise noted. We characterized the sensitivity of c(τ) to kon and koff as a function of decreasing Λ based on the following criteria:
The non-equilibrium threshold of Λ at which occupancy becomes kinetically- versus Kd-driven (i.e. the equilibrium regime).
The approximate kon and required to achieve 50% and 95% occupancy under SSO conditions (L0 = Kd′ and 19 ⋅ Kd′, respectively).
The fold-increase in L0 required to approach the qSSO profile.
The results are summarized below and in Table 1.
Table 1. Approximate values needed to achieve the SSO profile as a function of ki, calculated from 10 ⋅ ki/L0, where L0 = Kd and koff ≥ k−i (noting that koff is not hijacked under these conditions).
| Λ |
ki (s-1) |
Buildup t1/2 |
k−i (s-1) |
Kd = koff/kon (nM) |
koff = Kd ⋅ kon (s-1) |
~ (M-1 s-1) |
|---|---|---|---|---|---|---|
| 83,333 hr | 1x10⁻⁸ | 19,254 hr | 1x10⁻⁸ | 1 | - | - |
| 833 hr | 1x10⁻⁶ | 192.5 hr | 1x10⁻⁶ | 1 | 1x10⁻⁵ | 1x10⁴ |
| 83 | 1x10⁻⁵ | 19.25 hr | 1x10⁻⁵ | 1 | 1x10⁻⁴ | 1x10⁵ |
| 8.33 hr | 1x10⁻⁴ | 1.9 hr | 1x10⁻⁴ | 1 | 1x10⁻³ | 1x10⁶ |
| 50 min | 1x10⁻³ | 11.6 min | 1x10⁻³ | 1 | 1x10⁻² | 1x10⁷ |
| 5 min | 1x10⁻² | 1.16 min | 1x10⁻² | 1 | 1x10⁻¹ | 1x10⁸ |
| 30 s | 1x10⁻¹ | 6.9 s | 1x10⁻¹ | 1 | 1x100 | 1x10⁹§ |
| 3 s | 1x100 | 0.69 s | 1x100 | 1 | 1x101 | 1x10¹⁰§ |
| 300 ms | 1x101 | 69 ms | 1x101 | 1 | 1x10² | 1x10¹¹§ |
| 199 hr | 1x10⁻⁴ | 1.9 hr | 1x10⁻⁶ | 1 | 1x10⁻³ | 1x10⁶ |
| 20 hr | 8x10⁻⁴ | 14.4 min | 1x10⁻⁵ | 1 | 1x10⁻² | 1x10⁷ |
| 2.1 hr | 3x10⁻³ | 3.9 min | 1x10⁻⁴ | 1 | 1x10⁻¹ | 1x10⁸ |
§Exceeds the diffusion limit (further gains in c(τ) are necessarily driven by L0).
The equilibrium regime
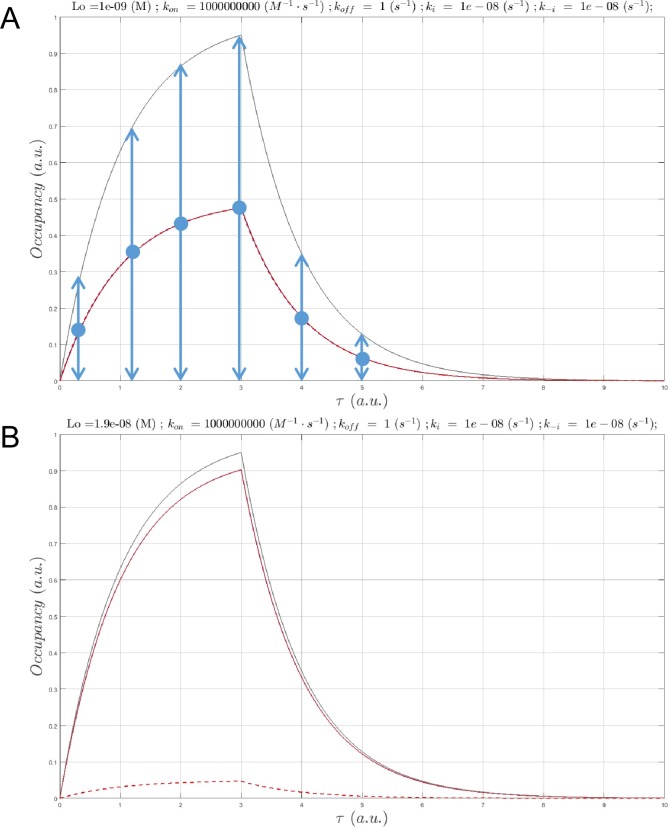
The equilibrium regime extends from Λ > 83,333 hr (ki = k−i = 1x10⁻⁸ s-1), at which c(τ) is fully independent of absolute koff and kon (constrained in our study to koff/kon = Kd), converging in all cases to the SSO profile (Fig 8). Under these conditions, the bound fraction is 50% or 95% (L0 = 1 nM or 19 nM, respectively) at all instants of time, and c(τ) exhibits the signature “saw-tooth” morphology of Btotal(τ). The quasi-equilibrium regime resides between 833 < Λ < 83,333 hr (Fig 9A).
Fig 8.
(A) Plot of Btotal(τ) (gray), c(τ) (red), and Bfree(τ) (obscured by c(τ)). ki = k−i = 1x10⁻⁸ s-1, Λ = 83,333 hr, and L0 = Kd = 1 nM, which yields 50% SSO at all times (denoted by equal lengths of the vertical arrows above and below their respective centroids), irrespective of kon and koff (holding Kd constant at 1 nM). (B) Same as A, except with L0 = 19 ⋅ Kd, which yields the expected SSO = 95%.
Fig 9.
(A) Plot of Btotal(τ) (gray), c(τ) at a fixed L0 = Kd = 1 nM and Λ = 8,333 hr (ki = k−i = 1x10⁻⁷ s-1), in which kon was sampled between 1x10³ M-1 s-1 to 1x10⁵ M-1 s-1 (solid lines color-coded from blue to red as a function of increasing kon), and Bfree(τ) (dotted lines color coded the same as c(τ)). c(τ) diverges slightly from SSO at kon = 1x10³ M-1 s-1. (B) Same as A, except Λ = 1,667 hr (ki = k−i = 5x10⁻⁷ s-1, = 1x10³ M-1 s-1). (C) Same as A, except Λ = 833 hr (ki = k−i = 1x10⁻⁶ s-1, = 1x10⁴ M-1 s-1). (D) Same as A, except Λ = 167 hr (ki = k−i = 5x10⁻⁶ s-1, = 5x10⁴ M-1 s-1). (E) Same as A, except Λ = 3 hr (ki = k−i = 1x10⁻⁵ s-1, = 1x10⁵ M-1 s-1). (F) Same as A, except Λ = 8.3 hr (ki = k−i = 1x10⁻⁴ s-1, = 1x10⁶ M-1 s-1). (G) Same as A, except Λ = 50 min (ki = k−i = 1x10⁻³ s-1, = 1x10⁷ M-1 s-1). (H) Same as A, except Λ = 5 min (ki = k−i = 1x10⁻² s-1, = 1x10⁸ M-1 s-1). kon = 1x10⁵ M-1 s-1, the fastest kon sampled at this ki (1,000-fold < ), results in nearly zero occupancy.
The non-equilibrium regime
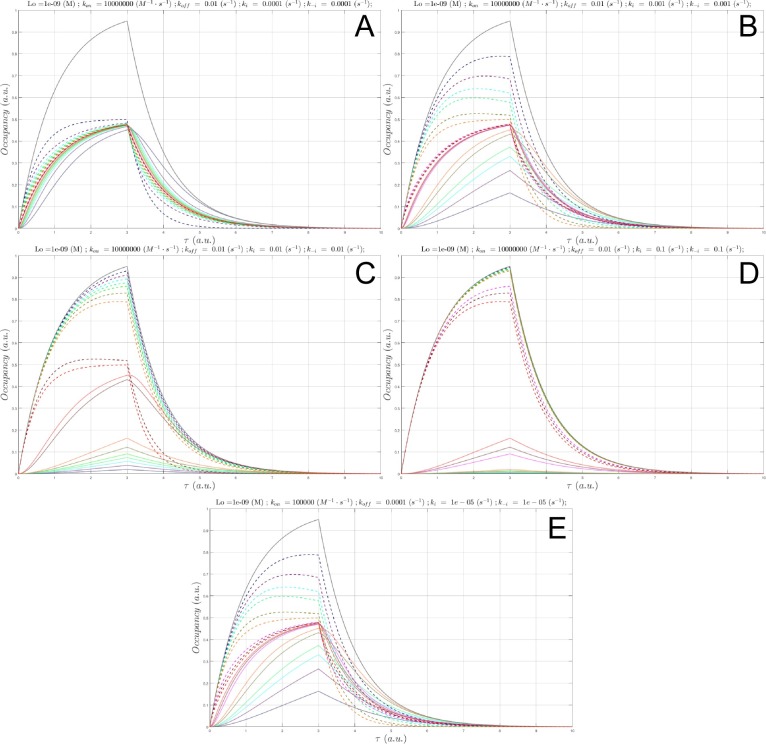
c(τ) enters the non-equilibrium regime in our model at Λ ≅ 833 hr (ki = k−i = 1x10⁻⁶ s-1), where the SSO profile is achieved at kon ≥ = 1x10⁴ M-1 s-1 (Fig 9). Suboptimal kon results in the nSSO profile and loss of the signature saw-tooth morphology. c(τ) lags behind, and decays ahead of Btotal(τ), and c50 and c95 are no longer achieved.
Higher steady-state occupancies are achieved with decreasing Λ and kon in the range of 1x10⁵ to 1x10⁷ M-1 s-1 (Fig 10).
Fig 10.
(A) Plot of Btotal(τ) (gray), c(τ) at a fixed L0 = Kd = 1 nM and Λ = 8.3 hr (ki = k−i = 1x10⁻⁴ s-1, = 1x10⁶ M-1 s-1), in which kon was sampled between 1x10⁵ M-1 s-1 to 1x10⁷ M-1 s-1 (solid lines color-coded from blue to red according to increasing kon), and Bfree(τ) (dotted lines color coded the same as c(τ)). (B) Same as A, except Λ = 50 min (ki = k−i = 1x10⁻³ s-1). (C) Same as A, except Λ = 5 min (ki = k−i = 1x10⁻² s-1 = 1x10⁸ M-1 s-1). (D) Same as A, except Λ = 30 s (ki = k−i = 1x10⁻¹ s-1, = 1x10⁹ M-1 s-1). (E) Same as A, except Λ = 3 s (ki = k−i = 1x100 s-1, = 1x10¹⁰ M-1 s-1). kon = 1x10⁷ M-1 s-1, the fastest kon sampled at this ki (1,000-fold < ), results in nearly zero occupancy.
Additional simulation results as a function of Λ, kon, and koff are provided in the Supplementary Information (S1 and S4 Figs).
Achieving the SSO profile depends on fast kon, even for long-lived binding sites
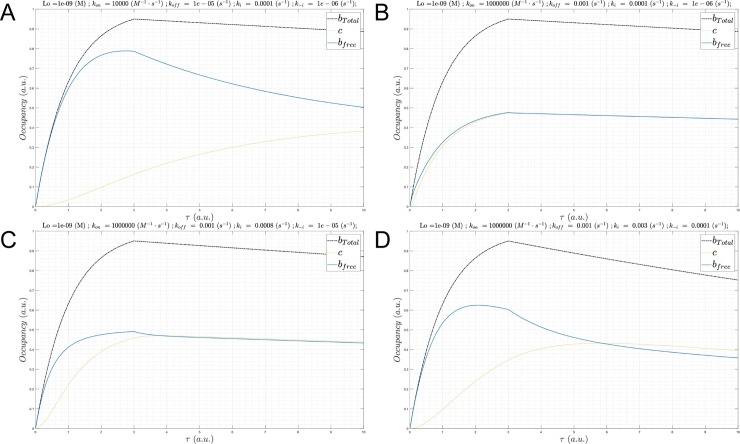
We assume that long lifetimes of cognate partners are achieved via fast buildup and slow decay of the binding-competent structural state or species levels, the latter of which may consist of synthesis and degradation or inter-compartmental shuttling (noting that species dilution caused by cell growth is not necessarily well described by our exponential functions). As is apparent from Fig 11, achieving steady-state occupancy remains dependent on kon ≥ , even at very slow binding site decay rates. At kon < , c(τ) may converge to Btotal(τ) far beyond the Bmax time point.
Fig 11.
(A) Plot of Btotal(τ) (black), Bfree(τ) (blue), and c(τ) (gold) for Λ = 199 hr (ki = k−i = 1x10⁻⁴ s-1 1x10⁻⁶ s-1, = 1x10⁶ M-1 s-1), L0 = Kd = 1 nM, koff = 1x10⁻⁵ s-1, and kon = 1x10⁴ M-1 s-1. (B) Same as A, except Λ = 199 hr (ki = 1x10⁻⁴ s-1, k−i = 1x10⁻⁶ s-1, = 1x10⁶ M-1 s-1), koff = 1x10⁻³ s-1, and kon = 1x10⁶ M-1 s-1. In this example, approximate SSO is achieved at this kon. (C) In this example, kon is too slow to keep up with Btotal(τ), but c(τ) converges to steady-state during the decay phase. Same as A, except Λ = 20 hr (ki = 8x10⁻⁴ s-1, k−i = 1x10⁻⁵ s-1, = 1x10⁶ M-1 s-1), koff = 1x10⁻³ s-1, and kon = 1x10⁶ M-1 s-1. (D) Same as A, except Λ = 2.1 hr (ki = 3x10⁻³ s-1, k−i = 1x10⁻⁴ s-1, = 1x10⁷ M-1 s-1), koff = 1x10⁻³ s-1, and kon = 1x10⁶ M-1 s-1. Approximate SSO is achieved at this kon.
Scenario 2
Binding site buildup and decay in this scenario are assumed to depend on fast conformational dynamics relative to the lifetime of the binding site-containing species, which may range case-by-case from ms (e.g. voltage-gated ion channels) to hr. We assume that scenarios 1 and 2 play different roles in biodynamics (i.e. the generation of non-equilibrium conditions and MDEs, respectively). However, our overall conclusions do not depend on this assumption. As for scenario 1, we set about to characterize the effect of decreasing time-dependent binding site availability on c(τ).
The hypothetical equilibrium regime
As for scenario 1, the SSO profile is achieved in the equilibrium case in a kinetics-agnostic manner (Λ = 3,851 hr and ki = k−i = 1x10⁻⁷ s-1) (S5 Fig). Under these conditions, the bound fraction is 50% or 95% (L0 = 1 nM or 19 nM, respectively) at all instants of time, and c(τ) exhibits the same signature bi-sigmoidal morphology as that of Btotal(τ) (S5 Fig).
The non-equilibrium regime
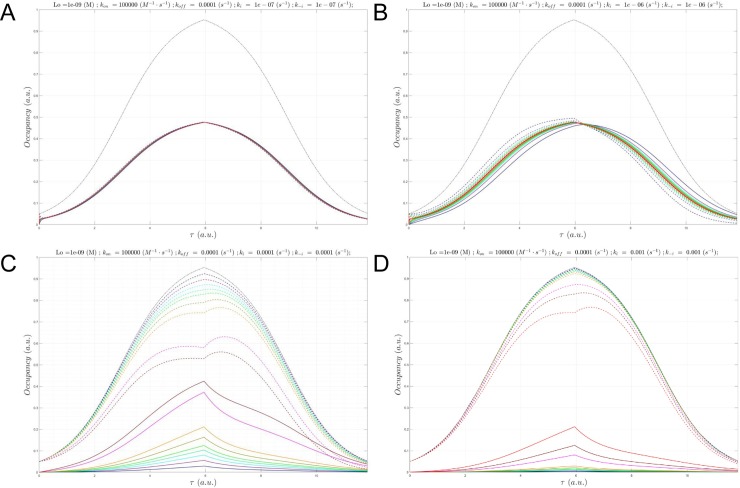
As for scenario 1, faster kon is needed to achieve the SSO profile as ki becomes progressively faster. The nSSO profile, and loss of the signature bi-sigmoidal c(τ) morphology, result from suboptimal kon. In such cases, cmax may no longer reach c50 or c95, and c(τ) lags behind, and decays ahead of Btotal(τ). c(τ) enters the non-equilibrium regime at Λ ≅ 833 hr (ki = k−i = 1x10⁻⁶ s-1), where a minimum kon of ~1x10⁵ M-1 s-1 is required to fully achieve the SSO profile (Fig 12).
Fig 12.
(A) Plot of Btotal(τ) (gray), c(τ) at a fixed L0 = 1 nM and Λ = 3,851 hr (ki = k−i = 1x10⁻⁷ s-1), in which kon was sampled between 1x10³ M-1 s-1 to 1x10⁵ M-1 s-1 (solid lines color-coded from blue to red according to increasing kon), and Bfree(τ) (dotted lines color coded the same as c(τ)). The c(τ) are beginning to diverge from the steady-state at this Λ. (B) Same as A, except Λ = 385 hr (ki = k−i = 1x10⁻⁶ s-1). (C) Same as A, except Λ = 3.85 hr (ki = k−i = 1x10⁻⁴ s-1). (D) Same as A, except Λ = 23.1 min (ki = k−i = 1x10⁻³ s-1). kon = 1x10⁵ M-1 s-1, the fastest kon sampled at ki = k−i = 1x10⁻² s-1, results in nearly zero occupancy (not shown).
Additional simulation results as a function of Λ, L0, kon, and koff are provided in S6 and S7 Figs.
The implications of binding dynamics for known short-lived binding sites
We next assessed the implications of binding dynamics for hERG channel blockade and LDL receptor (LDL-R) binding to wild type (wt) versus the disease-causing gain-of-function D374Y mutant form of PCSK9.
PCSK9-LDL receptor
We characterized PCSK9-LDL-R dynamic occupancy based on our scenario 1 model and the pH-dependent binding kinetics data reported in [12] (summarized in Table 2). Rapid buildup of PCSK9 can be inferred from its observed ~5 min half-life [24], which is driven by zymogen activation [25] rather than de novo expression (as may be the case for many short Λ species). Negligible PCSK9-LDL-R occupancy at neutral pH follows from the exceptionally high Kd relative to circulating plasma PCSK9 (which ranges between 30–3,000 ng/ml in humans (~405 pM to 40.5 nM) [26]), suggesting that extracellular binding depends on other factors. Binding and LDL-R degradation have indeed been shown to depend on heparin sulfate proteoglycans present on the extracellular surface of hepatocytes [27]. On the other hand, significant nSSO is achieved at the upper end of the concentration range for both wt and mutant forms of PCSK9 at lysosomal pH (Fig 13), suggesting that gain-of-function mutations act either through relatively small increases in dynamic occupancy relative to wt, or through some other means (e.g. by slowing PCSK9 degradation).
Table 2. Measured binding kinetics data for wt and D374Y mutant PCSK9- LDL-R [12].
Fold differences between kon and koff for D374Y versus wt are shown in parenthesis, noting that the t1/2 of the bound complex is similar to that of wt PCSK9, but considerably longer than that of the D374Y mutant (which is likely subject to koff hijacking). The ratio of was calculated based on = 1x10⁸ M-1 s-1, corresponding to ki = 1x10⁻² s-1 (predicted from Eq 13 under the assumption that ki = k−i).
| wt | D374Y | |||
|---|---|---|---|---|
| pH 7.4 | pH5.3 | pH 7.4 | pH5.3 | |
|
kon (M-1 s-1) |
1.86x10³ | 4.73x10⁵ | 4.57x10³ (+2.5-fold) |
6.74x10⁵ (+1.4-fold) |
| 53,763 | 211 | 21,881 | 148 | |
|
koff (s-1) |
1.17x10⁻³ | 1.97x10⁻³ | 4.64x10⁻⁴ (-2.5-fold) |
3.64x10⁻⁴ (-5.4-fold) |
|
(s-1) |
1.17x10⁻³ | 1.97x10⁻³ | 2.3x10⁻³§ | 2.3x10⁻³§ |
|
Kd (M) |
628x10-9 | 4.19x10⁻⁹ | 101x10-9 | 0.54x10⁻⁹ |
|
Kd′ (M) |
628x10-9 | 4.19x10⁻⁹ | 503x10-9 | 3.4x10⁻⁹ |
§Similar clearance rates are assumed for both mutant and wt PCSK9.
Fig 13.
(A) Plot of the hypothetical Btotal(τ) (gray) and c(τ) for PCSK9 and PCSK9-LDL-R binding at a fixed PCSK9 L0 = 1 nM, Λ = 5 min (ki = k−i = 1x10⁻² s-1), and the kon and koff values given in Table 2 (solid lines color-coded as follows: wt/pH 7.4 dark blue (not visible); wt/pH 5.3 purple; D374Y/pH 7.4 cyan; D374Y/pH5.3 green), and Bfree(τ) (dotted lines color coded the same as c(τ)). Simulated occupancy is essentially zero for both wt and mutant PCSK9 at neutral pH, whereas negligible nSSO is achieved at low pH. (B) Same as A, except L0 = 0 nM. Moderate nSSO is achieved at low pH (maximum occupancy = 68% versus 75% for the wt and mutant forms, respectively). (C) Same as A, except L0 = 40.5 nM. High nSSO is achieved at low pH, where the gap between wt and mutant forms narrows to only a few percent at all time points (maximum occupancy = 82% versus 85% for the wt and mutant forms, respectively).
hERG channel blockade by non-trappable compounds
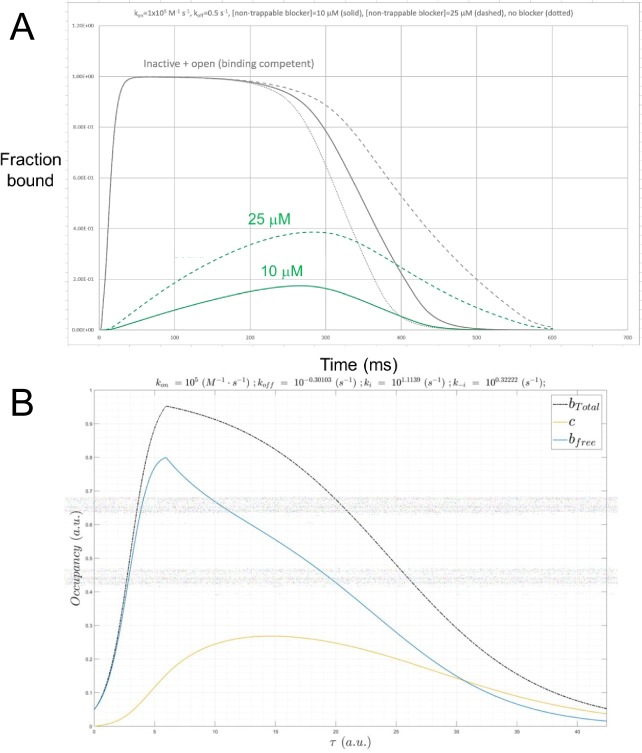
Certain hERG blockers are trapped within closed channels (which we refer to as “trappable”), whereas others are expelled during channel closing (which we refer to as “non-trappable”) [4,28]. Trappable blocker occupancy builds to Kd′ (the specific time-dependence of which depends on kon), whereas that by non-trappable blockers builds and decays during each gating cycle. The ultrashort ~350 ms lifetime of the open and inactivated channel states results in koff hijacking, in which and koff ≥ k−i (~2 s−1) for the trappable and non-trappable cases, respectively [4]. In our previous work, we characterized the dynamic occupancy of a set of hypothetical non-trappable blockers using an alternate model, consisting of the O’Hara-Rudy action potential (AP) simulator, in which we replaced the Hodgkin-Huxley hERG model with a Markov state model incorporating blocker binding [4]. Here, we used the predicted pro-arrhythmic n ⋅ Kd′ versus n ⋅ Kd as a function of kon, koff, and as a metric of dynamic occupancy, and qualitatively compared the results with our binding dynamics models (Fig 14 versus S6 Fig and Table 3 versus Table 1).
Fig 14.
(A) Plot of dynamic fractional hERG occupancy in mid-myocardial (M) cells by a hypothetical non-trappable blocker exhibiting kon = 1x10⁵ M-1 s-1 and koff = 5x10⁻¹ s-1 (Kd = 5 μM and = 20 μM) sampled at 10 and 25 μM (green solid and dashed curves, respectively). The total dynamic binding site level consists of the sum of the open/conducting and inactivated channel populations (gray dotted, solid, and dashed curves corresponding to 0, 10, and 25 μM blocker concentrations, respectively). The overall shape of the channel state population curves qualitatively resembles our logistic model (in which ki is very fast), noting that recovery from inactivation (the decay region of the curves) is slowed by blockade due to the smaller contribution of the hERG current to the membrane potential, which in turn, alters the response of the channel population (consistent with the recursive effect depicted in Fig 2). The blocker occupancy curves reflect nSSO occupancy at kon = 1x10⁵ M-1 s-1 (where , as suggested from Table 1), and the peak occupancy is far below 50% at 5 μM. Nevertheless, even transient fractional occupancy approaching the ~45% level can be highly pro-arrhythmic [4]. (B) Plot of Btotal(τ) (gray), Bfree(τ) (blue) and c(τ) (gold) simulated using our logistic model (scenario 2) for a hERG blocker exhibiting Kd = 5 μM (kon = 1x10⁵ M-1 s-1 and koff = 0.5 s-1) and [free blocker] = 10 μM. ki and k−i were set to 13 s-1 and 2.1 s-1, respectively, so as to reproduce Bmax at τ ≈ 50 ms and Λ ≈ 350 ms. Btotal(τ) and c(τ) are qualitatively similar to the curves in A.
Table 3. L0 (expressed as n ⋅ Kd and n ⋅ Kd′) for a set of hypothetical hERG blockers resulting in the pro-arrhythmic fractional channel occupancy levels predicted from our AP simulations.
Blocker Kd = 5 μM in all cases, where kon ranges between 1x10⁴ and 1x10⁹ M-1 s-1 and koff between 0.005 and 5,000 (noting that the pro-arrhythmic occupancy level increases as koff speeds). n ⋅ Kd was back-calculated from the predicted pro-arrhythmic occupancy using Eq 19.
| kon (M-1 s-1) | 1x10⁴ | 1x10⁵ | 1x10⁶ | 1x10⁷ | 1x10⁸ | 1x10⁹ |
| koff (s-1) | 5x10⁻² | 5x10⁻¹ | 5x100 | 5x101 | 5x10² | 5x10³ |
| (s-1) | 2 | 2 | 2 | 2 | 2 | 2 |
| Fractional pro-arrhythmic hERG occupancy (%) | 42 | 45 | 53 | 54 | 55 | 55 |
| → pro-arrhythmic occupancy (M) | 2.6x10⁻⁴ | 2.9x10⁻⁵ | 7.8x10⁻⁶ | 6.2x10⁻⁶ | 6.0x10⁻⁶ | 6.0x10⁻⁶ |
| n ⋅ Kd → pro-arrhythmic occupancy (M) | 3.6x10⁻⁶ | 4.1x10⁻⁶ | 5.7x10⁻⁶ | 5.9x10⁻⁶ | 6.1x10⁻⁶ | 6.1x10⁻⁶ |
Implications of binding dynamics for drug discovery
Both drug-target and endogenous time-dependent binding partner occupancy are described by similar biodynamics principles. Namely:
Extrinsic rates: the rates of buildup and decay of the binding site and ligand, which may vary with conditions.
Intrinsic rates: kon and koff, which may also vary with conditions.
Fractional occupancy at each instant of time (c(τ)). It is reasonable to assume that molecular response (both efficacious and toxic) depends on c(τ) ≥ a fractional occupancy threshold during each binding site buildup/decay cycle (in general, ranging from a small fraction to nearly 100%, case-by-case).
Our results suggest the paramount importance of tuning kon and koff to the rates of binding site buildup and decay, respectively, for achieving the Goldilocks zone of efficacious target occupancy and target/off-target selectivity (Fig 15). Constant maximal fractional occupancy is maintained under the SSO profile at the lowest possible L (where c(τ) depends solely on L = n ⋅ Kd). On the other hand, fractional occupancy in the qSSO regime approaches a constant level only under saturating conditions (i.e. at n >> 1) (S3 Fig). Target/off-target selectivity may be compromised with the nSSO profile, depending on the ratio of Kd(target)/Kd(off−target), keeping in mind that nSSO may exist for the target, and SSO for one or more off-targets and/or competing endogenous substrates.
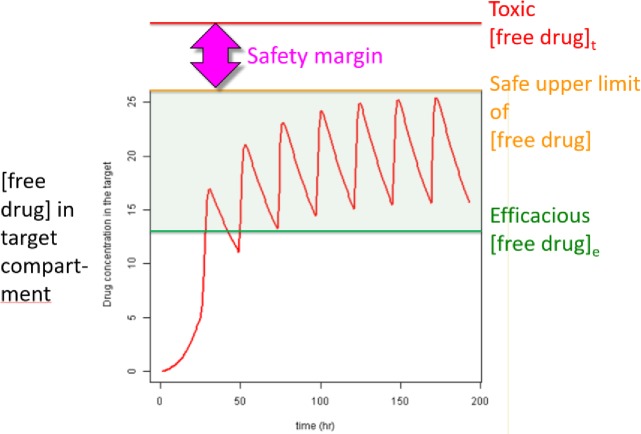
Fig 15. Hypothetical plot of drug L versus time (red), showing a series of buildup-decay cycles (one per dose) culminating in a steady-state condition, together with the efficacious threshold of L (green), the safe upper limit of L (orange), and the toxic level of L (red).
L is maintained in the efficacious/sub-toxic “green zone” by overshooting and decaying back to the efficacious level. Optimizing to the SSO regime affords the greatest chance of achieving a therapeutic index in humans.
Tuning kinetics to the qSSO profile
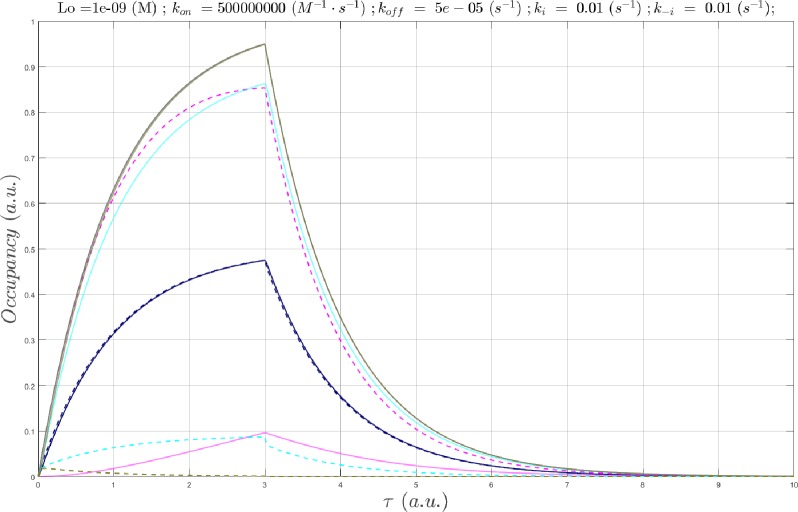
Optimization of drug koff or “residence time” (i.e. t1/2 = ln(2)/koff) does not translate to increased occupancy when koff < ki (unless k−i is slowed in the bound state). We used Eq 10 to test the effect of slowing koff under qSSO versus SSO conditions (i.e. kon < kon_ss versus kon ≥ kon_ss) at constant Kd (Fig 16).
Fig 16.
Plot of Btotal(τ) (gray), c(τ) at L0 = koff/kon =1 nM and Λ = min (ki = k−i = 1x10⁻² s-1), in which koff and kon were sampled at 5x10⁻¹ s-1/5x108 M-1 s-1 (blue), 5x10⁻⁷ s-1/5x105 M-1 s-1 (magenta), 5x10⁻² s-1/5x108 M-1 s-1 (cyan), and 5x10⁻⁵ s-1/5x108 M-1 s-1 (olive) (solid lines), and Bfree(τ) (dotted lines correspond to the c(τ) color scheme). c(τ) is unaffected by slowing koff (magenta curve) when kon < . However, when kon ≥ , c(τ) increases when koff is further slowed (e.g. 5x10⁻¹ s-1 → 5x10⁻² s-1 (cyan curve) and 5x10⁻¹ s-1 → 5x10⁻⁵ s-1 (olive curve)).
Lastly, we used Eq 10 to test the effect of increasing L0 toward the qSSO profile at kon < kon_ss (Fig 17 and S2 Fig).
Fig 17.
(A) Plot of Btotal(τ) (black), Bfree(τ) (blue), and c(τ) at L0 = 0.5 ⋅ Kd = 0.5 nM and Λ = 5 min (ki = k−i = 1x10⁻³ s-1, = 1x10⁸ M-1 s-1), where koff = 1x10⁻¹ s-1/kon = 1x10⁸ M-1 s-1 (gold). (B) Same as A, except at L0 = Kd =1 nM, and koff = 3x10⁻⁴ s-1/kon = 3x10⁵ M-1 s-1. Although c(τ) reaches ~c31 in both cases, the steady-state scenario in A reaches ~c31 at all instants of time (an example of kinetically tuned binding), whereas the nSSO scenario results in considerably greater Bfree(τ) prior to cmax (an example of non-kinetically tuned binding). (C) Plot of Btotal(τ) (gray), c(τ) at Kd = 1 nM, Λ = 5 min (ki = k−i = 1x10⁻³ s-1, = 1x10⁸ M-1 s-1), koff = 1x10⁻⁵ s-1, and kon = 1x10⁴ M-1 s-1, in which L0 was sampled between 1 nM and 2 μM (solid lines), and Bfree(τ) (dotted lines correspond to the c(τ) color scheme). Slow kon is only compensated at sufficiently high L0, which in this case, approaches SSO conditions at L0 = 1 μM.
The putative effects of competition and drug pharmacokinetics (PK) on drug-target occupancy
Although we have not considered the effects of endogenous ligand competition and time-dependent drug concentration (L(t)) on dynamic drug-target occupancy, these factors can only serve to further increase kon_ss. The rates of binding site and drug buildup within the target-containing compartment (which may or may not be slower than the rate of drug buildup within the central compartment) should ideally be synchronized to ensure that L is always ≥ Kd. Fractional drug-target occupancy is decreased by Le ⋅ Ki/Ke in the presence of endogenous ligand competition, as is apparent from the following equation [23]:
| (20) |
where Le, Ke, and Ki are the free endogenous ligand concentration and Kd, and inhibitory drug Kd, respectively. For example, drug SSO = 50% is achieved at L50 = Ki + Le when Ki = Ke, and L50 further increases with increasing Le (or synchronization with binding site buildup) and/or decreasing Ke. It is further apparent that qSSO is achieved at higher L than in the non-competitive case, and that competition between endogenous ligand binding via the SSO profile would be greatly favored over inhibitory drug binding via the nSSO profile (more the reason for optimizing to kon ≥ kon_ss).
The binding kinetics profiles of marketed drugs are consistent with non-equilibrium drug-target binding
We set about to test the relative importance of kon_ss versus koff in the human setting using measured kon and Kd data curated by Dahl and Akrud for 32 marketed drugs [29] (reproduced in Table 4). We assume that marketed drugs observe steady-state or quasi-steady-state occupancy for targets with fast ki and k−i, or bind to targets that build and decay slowly (i.e. kinetics-agnostic occupancy). The data can be summarized as follows:
Table 4. Published kon, koff, and Kd values for a set of marketed drugs [29].
The drugs are grouped by target. Cases of Kd < 1 nM are underlined, kon > 1x10⁵ M-1 s-1 are shown in bold, and t1/2 > 30 min are italicized.
| Drug | Target |
kon (M-1 s-1) |
koff (s-1) |
t1/2 (min) |
Kd (M) |
|---|---|---|---|---|---|
| Aliskiren | Renin | 4.00E+05 | 1.1E-04 | 105 | 3.00E-10 |
| Aclidinium | Muscarinic M3 receptor | 1.10E+06 | 2.0E-05 | 578 | 1.80E-11 |
| Ipratropium | Muscarinic M3 receptor | 4.10E+06 | 1.1E-03 | 11 | 2.60E-10 |
| Tiotropium | Muscarinic M3 receptor | 7.60E+05 | 7.2E-06 | 1604 | 9.50E-12 |
| Candesartan | Human angiotensin II type 1 receptor | 2.60E+04 | 1.9E-04 | 61 | 7.40E-09 |
| Telmisartan | Human angiotensin II type 1 receptor | 9.10E+04 | 1.5E-04 | 77 | 1.70E-09 |
| Granisetron | 5-HT3 | 7.50E+05 | 7.5e-04 | 15 | 1.00E-09 |
| Lapatinib | ERBB2/EGFR | 1.30E+04 | 3.9e-05 | 296 | 3.00E-09 |
| Desloratadine | Histamine H1 receptor | 3.20E+04 | 3.2e-05 | 361 | 1.00E-09 |
| Amlodipine | L-type calcium channel | 1.50E+05 | 3.0E-04 | 39 | 2.00E-09 |
| Verapamil | L-type calcium channel | 9.20E+07 | 2.8E0 | 0.004 | 3.00E-08 |
| Phenytoin | Na+ channel | 2.50E+04 | 5.0E-01 | 0.02 | 2.00E-05 |
| Amprenavir | HIV-1 protease | 4.40E+06 | 4.9E-03 | 2 | 1.10E-09 |
| Atazanavir | HIV-1 protease | 1.70E+06 | 6.9E-04 | 17 | 4.00E-10 |
| Indinavir | HIV-1 protease | 1.50E+06 | 1.6e-03 | 7 | 1.10E-09 |
| Lopinavir | HIV-1 protease | 6.60E+06 | 6.5E-04 | 18 | 1.00E-10 |
| Ritonavir | HIV-1 protease | 3.90E+06 | 2.2E-03 | 5 | 6.10E-10 |
| Saqunavir | HIV-1 protease | 8.20E+05 | 2.3E-04 | 50 | 3.20E-10 |
| Nelfinavir | HIV-1 protease | 6.60E+05 | 6.7E-04 | 17 | 1.60E-09 |
| Boceprevir | Hepatitis C virus nonstructural protease (NS3) | 2.40E+03 | 4.9E-05 | 236 | 2.00E-08 |
| Ciluprevir | Hepatitis C virus nonstructural protease (NS3) | 9.10E+05 | 7.3E-04 | 16 | 6.20E-09 |
| Telaprevir | Hepatitis C virus nonstructural protease (NS3) | 2.20E+03 | 9.6E-05 | 120 | 4.30E-08 |
| Deoxy-conformycin | Adenosine deaminase | 2.40E+06 | 4.8E-06 | 2,406 | 2.00E-12 |
| Efavirenz | HIV-1 reverse transcriptase | 1.40E+01 | 6.8E-05 | 170 | 5.00E-06 |
| Elvitegravir | HIV integrase | 2.10E+06 | 8.3e-03 | 1 | 4.00E-09 |
| Raltegravir | HIV integrase | 2.50E+05 | 2.5e-03 | 5 | 1.00E-08 |
| Methotrexate | Chicken dihydrofolate reductase | 3.70E+07 | 3.3e-04 | 35 | 9.00E-12 |
| Trimethoprim | Escherichia coli dihydrofolate reductase | 7.20E+07 | 1.4e-03 | 8 | 2.00E-11 |
| Oseltamivir | Viral neuraminidase | 7.90E+05 | 2.5e-04 | 46 | 3.10E-10 |
| Saxagliptin | Human dipeptidyl- peptidase IV | 1.60E+05 | 5.4e-05 | 214 | 3.50E-10 |
| Vildagliptin | Human dipeptidyl- peptidase IV | 8.70E+04 | 9.8e-04 | 12 | 1.10E-08 |
| Triclosan | Enoyl-ACP reductase and Francisella tularensis | 8.20E+06 | 4.2e-04 | 28 | 5.10E-11 |
kon ranges between 1.4x101 and 9.2x10⁷ M-1 s-1, with kon ≥ 1x10⁵ M-1 s-1 occurring in ~72% of the cases, sufficient for achieving the SSO profile for binding site buildup times between 1 m ≲ t1/2 ≲ 19 h (blue text in Table 4).
koff ranges between 4.8x10⁻⁶ and 2.8 s-1, with koff < 3.9x10⁻⁴ s-1 (t1/2 ≳ 30 min) occurring in ~47% of the cases (green text in Table 4).
Kd < 1 nM was achieved in ~44% of the cases (red text in Table 4), which is due to koff < 3.9x10⁻⁴ s-1 in 57% of those cases (i.e. extreme potency is not driven by slow koff).
koff > 3.9x10⁻⁴ s-1 and kon > 1x10⁵ M-1 s-1 (i.e. kon-driven occupancy) occurs in ~44% of the cases.
koff < 3.9x10⁻⁴ s-1 and kon < 1x10⁵ M-1 s-1 (i.e. koff-driven occupancy) occurs in only ~19% of the cases, of which 4 are receptors, 2 are NS3 protease, and 1 is HIV-1 RT (noting that kon is near our cutoff in the receptor ligand telmisartan, and the NS3 inhibitor ciluprevir exhibits fast kon).
These observations (and numbers 4 and 5 in particular) are consistent with our claim that high dynamic occupancy under non-equilibrium conditions found in vivo depends first and foremost on fast kon, and further suggest that the rates of buildup of many of the targeted binding sites are ≥ 1x10⁻⁵ s-1 (based on Table 1), assuming that kon was, in fact, wittingly or unwittingly optimized to kon_ss. This contrasts with the claim of Dahl and Akrud [29] and Folmer [30] that the drugs were optimized on the basis of Kd (noting that Folmer acknowledges the greater contribution of fast kon over slow koff to drug success [30]).
Discussion
The fundamental mechanisms by which molecular properties are transduced into cellular structure-function are poorly understood. Molecules are an unruly lot, whose states are distributed randomly in the absence of transducible energy inputs to achieve maximal configurational entropy. The relevant energy inputs consist largely of: 1) H-bond losses and gains among solvating water molecules (versus other liquid solvents) underlying intra- and intermolecular free energy barriers; and 2) continual/continuous production and decay of the participating species needed to maintain non-equilibrium conditions. Furthermore, out of phase dynamic counter-balancing is essential for overcoming the inherent susceptibility of exponential molecular state transitions to under- and overshooting (suggesting a putative architecture of cellular function-generating systems, consisting of Yins, Yangs, and clocks). Our biodynamics theory is aimed at capturing such principles at both the atomistic molecular and non-atomistic multi-molecular systems levels (beyond conventional mass action kinetics). Multiple levels of integrated dynamic contributions underlying cellular function, dysfunction, pharmacodynamics, and drug PK are addressed by our theory, the implications of which are summarized in the following sections.
The rates of change in binding partner levels/states are sensed via binding dynamics
The bound fraction of binding or catalytic sites can be calculated under strictly equilibrium conditions using the Hill and Michaelis-Menten equations, respectively. However, binding sites undergo transient buildup and decay driven by synthesis/degradation, translocation, or conformational state transitions to/from their binding-competent states. The lifetimes of many proteins range from single-digit minutes to hours [21] (e.g. PCSK9 is on the order of 5 min [24], and tumor cell line-derived NIK ranges from ~5–30 min [31]). The lifetimes of binding competent states can range from μs (e.g. mRNA) or ms (e.g. voltage-gated ion channels) to the lifetime of the molecule itself. Here, we have shown that dynamic occupancy is greatly influenced by the time window of binding site availability, where the SSO profile is only achieved when kon is on the order of ki. We assume that the association and dissociation rate constants for endogenous partners are kinetically tuned to the dynamic ranges of Btotal(t) and L(t). Perturbations to partner states/levels can be sensed through binding dynamics, and specifically, kinetic tuning/de-tuning of C(t) via:
Modulation of the maximum time-dependent binding partner levels (Btotal(t)) (the “extrinsic” rates [1]).
Slowing/speeding of ki and k−i thereby shifting the kon threshold for achieving the SSO profile (i.e. ) or the qSSO profile.
Modulation of partner-specific association and dissociation rate constants (kon and koff) (the “intrinsic” rates [1]).
Sensitivity of cellular function to the bound state depends on:
- The dynamic range in Btotal(t):
- Constitutively low Btotal(t) levels may result in undetectable levels of the bound state.
- Constitutively high Btotal(t) levels may result in reduced sensitivity of the bound state to changes in concentration of the other partner(s).
- kon (subject to allosteric modulation, case-by-case).
- Very fast kon (>> kon_ss) diminishes the sensitivity of the bound state to changes in partner concentration.
- Very slow kon (<< kon_ss) may result in undetectable levels of the bound state at lower partner concentrations.
We assume that cellular systems operate within the binding sensitive regime, such that the buildup and decay of binding partners and the bound states thereof remain in phase over time. Although we have assumed a constant free ligand concentration in constructing our analytical dynamic occupancy expressions, it is apparent that this condition rarely occurs in vivo (noting that buildup and decay of the binding partners may proceed at different rates, and in an in- or out-of-phase relationship). As such, variable ligand concentration introduces potentially far greater kinetic demands on dynamic occupancy, which is likely underestimated in our approach.
The implications of biodynamics for pharmacodynamics and drug discovery
Efficacious and toxic drug levels are conventionally defined in terms of the equilibrium scenario (Eq 20), which rests on the assumptions that drug-target occupancy, drug exposure within the target compartment (typically intra- or extracellular), and target level are quasi-time-independent quantities, when in fact, they are not:
Biomolecular species underlying cellular function undergo continuous production/degradation and state transitions (including drug targets).
Drug levels build and decay based on PK principles (S7 Fig).
Drug-target binding builds and decays based on binding dynamics principles.
Drug-target binding alters the rates of dysfunction promoting processes (i.e. pharmacodynamics).
Pharmacodynamics may be taken as the mitigation of Yin-Yang imbalances [1] via the insertion of one or more exogenous MDEs into afflicted system(s) (where inhibition and stimulation effectively slow and speed target buildup, respectively). As for endogenous complexes:
Buildup of drug-target occupancy is on-rate driven, and the bound state must rebuild with each target buildup/decay cycle due to loss of the bound drug-target population.
On-rate may be driven by kon and/or free drug concentration.
The SSO profile is achievable, in practice, for kinetically tuned binding, in which kon is optimized to ≥ , as dictated by the lifetime of the target or binding site (Fig 18). Under these conditions, efficacious or toxic occupancy, which can conceivably vary from << 50% to 95+% is expected at a free drug concentration = n ⋅ Kd (e.g. n = 19 yields 95% occupancy), noting that the putative safe range of trappable hERG blocker occupancy ranges between 0–3% [4]. Conversely, achieving the qSSO profile (converging to ~95% occupancy) may require considerably larger n than the SSO profile.
In the absence of kinetic tuning, the SSO profile is unachievable via escalation of drug concentration, although the qSSO profile is conceivable at sub-toxic exposures. This constitutes a potential source of in vitro-in vivo disconnects and clinical failures due to loss of the therapeutic index. The worst-case scenario consists of a drug that is kinetically mistuned to its target, while being kinetically tuned to one or more off-targets, and that competes for the target with an endogenous kinetically tuned partner.
Residence time (i.e. ln(2)/koff below the rate of binding site decay adds no benefit to occupancy (target dynamics are not considered by other workers advocating koff optimization [32,33]).
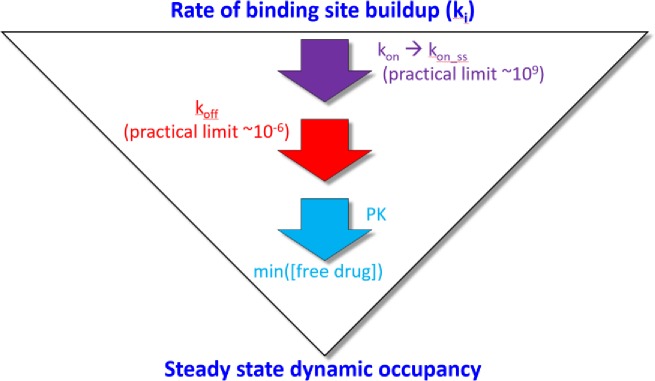
Fig 18.
Optimization of dynamic occupancy is achieved by first speeding kon to ≥ (based on the binding site lifetime), followed by slowing koff to k−i, a process we refer to as “kinetic tuning.” The ultimate objective is to achieve the highest occupancy at the lowest free drug concentration (i.e. the SSO profile), affording the greatest chance for achieving a therapeutic index in humans.
Conclusion
In our previous work [1], we outlined a first principles theoretical framework (referred to herein as biodynamics) that explains the general mechanisms of cellular analog computing on the basis of non-equilibrium biomolecular state transitions, as well as the key implications of our theory for:
The transformation of chemical systems into living cells capable of maintaining non-equilibrium conditions, harnessing exponential behavior, and exploiting water H-bond energy to generate state transition barriers.
The origin of disease-causing cellular dysfunction (Yin-Yang imbalances), and the pharmacological mitigation thereof (insertion of exogenous MDEs capable of fully or partially restoring the normal Yin-Yang balance).
The current work is focused on the interplay between two key biodynamics contributions consisting of molecular dynamics and binding dynamics. We used a simplified analytical model that qualitatively captures these contributions to explore the possible effects of non-equilibrium conditions (namely, binding site buildup and decay) on dynamic occupancy. Our results suggest that:
Achieving the SSO profile as a function of diminishing binding site lifetime depends on increasingly faster kon (noting that nSSO → the qSSO profile is achievable only at high L compared with SSO).
Nature has likely tuned kon to achieve SSO or qSSO binding for endogenous partners (i.e. maximal binding efficiency).
Our findings challenge the conventional equilibrium binding paradigm on which much of modern drug discovery is based, as follows:
Knowledge of target and binding site buildup and decay rates is essential for achieving the SSO profile on a non-trial-and-error basis.
Binding site lifetimes ranging from single-digit hours to milliseconds require increasingly faster kon to achieve the SSO profile (i.e. kinetic tuning versus potency optimization).
Increased drug exposure (i.e. PK) is a poor substitute for kinetically tuned binding, in which the qSSO profile is only asymptotically approached. As such, dose escalation during clinical trials is an extremely risky proposition from the safety standpoint.
Supporting information
(a) Plot of Btotal(τ) (gray), c(τ) at a fixed L0 = Kd =1 nM and Λ =50 min (ki = k−i = 1x10⁻³ s-1, = 1x10⁷ M-1 s-1), in which kon was sampled between 1x10⁷ M-1 s-1 to 1x10⁹ M-1 s-1 (solid lines color-coded from blue to red according to increasing kon), and Bfree(τ) (dotted lines color coded the same as c(τ)). (b) Same as (a), except Λ = 5 min (ki = k−i = 1x10⁻² s-1, = 1x10⁸ M-1 s-1). (c) Same as (a), except Λ = 30 s (ki = k−i = 1x10⁻¹ s-1, = 1x10⁹ M-1 s-1). (d) Same as (a), except Λ = 3 s (ki = k−i = 1x100 s-1, = 1x10¹⁰ M-1 s-1). (e) Same as (a), except Λ = 300 ms (ki = k−i = 1x101 s-1, = 1x10¹¹ M-1 s-1). kon = 1x10⁹ M-1 s-1, the fastest kon sampled at this ki (which is 100-fold < ), results in nearly zero occupancy.
(TIF)
(a) Plot of Btotal(τ) (gray), c(τ) at a fixed L0 = 19 ⋅ Kd = 19 nM and Λ = 50 min (ki = k−i = 1x10⁻³ s-1), in which kon was sampled between 1x10³ to 1x10⁵ M-1 s-1 (solid lines color-coded from blue to red according to increasing kon), and Bfree(τ) (dotted lines color coded the same as c(τ)). (b) Same as (a), except Λ = 5 min (ki = k−i = 1x10⁻² s-1, = 1x10⁸ M-1 s-1). (c) Same as (a), except Λ = 5 min (ki = k−i = 1x10⁻² s-1) and L0 = 100 nM. kon = 1x10⁵ M-1 s-1, the fastest kon sampled at this ki (which is 1,000-fold < ), fails to achieve the SSO profile. (d) Same as (c), except L0 = 200 nM.
(TIF)
(a) Plot of Btotal(τ) (gray), c(τ) at a fixed L0 = 19 ⋅ Kd = 19 nM and Λ =50 min (ki = k−i = 10−3 s-1, = 1x10⁷ M-1 s-1), in which kon was sampled between 1x10⁵ to 1x10⁷ M-1 s-1 (solid lines color-coded from blue to red according to increasing kon), and Bfree(τ) (dotted lines correspond to the c(τ) color scheme). (b) Same as (a), except Λ = 5 min (ki = k−i = 1x10⁻² s-1, = 1x10⁸ M-1 s-1). (c) Same as (a), except Λ = 300 ms (ki = k−i = 1x101 s-1, = 1x10¹¹ M-1 s-1) and L0 = 2 μM. Equilibrium occupancy (c95) is achieved at the fastest kon sampled (1x10⁶ to 1x10⁷ M-1 s-1), with the exception of Λ = 300 ms (ki = 1x101 s-1), which only reaches qSSO (even at L0 > 25 μM).
(TIF)
(a) Plot of Btotal(τ) (gray), c(τ) at a fixed L0 = 19 ⋅Kd = 19 nM and Λ = 50 min (ki = k−i = 1x10⁻³ s-1, = 1x10⁷ M-1 s-1), in which kon was sampled between 1x10⁷ to 1x10⁹ M-1 s-1 (solid lines color-coded from blue to red according to increasing kon), and Bfree(τ) (dotted lines correspond to the c(τ) color scheme). b) Same as (a), except Λ = 5 min (ki = k−i = 1x10⁻² s-1, = 1x10⁸ M-1 s-1). (c) Same as (a), except Λ = 30 s (ki = k−i = 1x10⁻¹ s-1, = 1x10⁹ M-1 s-1).
(TIF)
Plot of Btotal(τ) (gray), c(τ) at a fixed L0 = 1 nM and Λ = 38,508 hr (ki = k−i = 1x10⁻⁸ s-1), in which kon was sampled between 1x10³ M-1 s-1 to 1x10⁵ M-1 s-1 (solid lines color-coded from blue to red according to increasing kon), and Bfree(τ) (obscured by c(τ)).
(TIF)
(a) Plot of Btotal(τ) (gray), c(τ) at a fixed L0 = 1 nM and Λ = 3.85 hr (ki = k−i = 1x10⁻⁴ s-1), in which kon was sampled between 1x10⁴ M-1 s-1 to 1x10⁹ M-1 s-1 (solid lines color-coded from blue to red according to increasing kon), and Bfree(τ) (dotted lines color coded the same as c(τ)). (b) Same as (a), except Λ = 2.3 min (ki = k−i = 1x10⁻² s-1). (c) Same as (a), except Λ = 13.9 s (ki = k−i = 1x10⁻¹ s-1). (d) Same as (a), except Λ = 1.39 s (ki = k−i = 1x100 s-1). (e) Same as (a), except Λ = 139 ms (ki = k−i = 1x101 s-1).
(TIF)
Plot of Btotal(τ) (gray), c(τ) at a fixed Kd = 1 nM, Λ = 2.3 min (ki = k−i = 1x10⁻² s-1), koff = 1x10⁻⁵ s-1, and kon = 1x10⁴ M-1 s-1, in which L0 was sampled between 1 nM and 500 nM (solid lines), and Bfree(τ) (dotted lines color coded the same as c(τ)). kon < is only compensated at sufficiently high L0, which in this case, qSSO at L0 = 500 nM.
(TIF)
Acknowledgments
We gratefully acknowledge Xin Chen and Andrei Golosov for helpful discussions and comments on this manuscript.
Data Availability
All relevant data are within the paper and its Supporting Information files.
Funding Statement
The authors received no specific funding for this work.
References
- 1.Pearlstein RARA McKay DJJDJJ, Hornak V, Dickson C, Golosov A, Harrison T, et al. Building New Bridges between In Vitro and In Vivo in Early Drug Discovery: Where Molecular Modeling Meets Systems Biology. Curr Top Med Chem. 2017;17: 1–1. 10.2174/1568026617666170414152311 [DOI] [PubMed] [Google Scholar]
- 2.Daniel R, Rubens JR, Sarpeshkar R, Lu TK. Synthetic analog computation in living cells. Nature. Nature Publishing Group; 2013;497: 619–623. 10.1038/nature12148 [DOI] [PubMed] [Google Scholar]
- 3.Howe RM. Fundamentals of the Analog Computer. IEEE Control Syst Mag. 2005; 29–36. [Google Scholar]
- 4.Pearlstein RA, MacCannell KA, Erdemli G, Yeola S, Helmlinger G, Hu Q-Y, et al. Implications of dynamic occupancy, binding kinetics, and channel gating kinetics for hERG blocker safety assessment and mitigation. Curr Top Med Chem. 2016;16. [DOI] [PubMed] [Google Scholar]
- 5.O’Hara T, Virág L, Varró A, Rudy Y. Simulation of the undiseased human cardiac ventricular action potential: model formulation and experimental validation. PLoS Comput Biol. 2011;7: e1002061 10.1371/journal.pcbi.1002061 [DOI] [PMC free article] [PubMed] [Google Scholar]
- 6.Willis WT, Jackman MR, Messer JI, Kuzmiak-Glancy S, Glancy B. A simple hydraulic analog model of oxidative phosphorylation. Med Sci Sports Exerc. 2016;48: 990–1000. 10.1249/MSS.0000000000000884 [DOI] [PMC free article] [PubMed] [Google Scholar]
- 7.Alon U. An introduction to systems biology: design principles of biological circuits Chapman & Hall/CRC; 2007. [Google Scholar]
- 8.Keener J, Sneyd J, editors. Mathematical Physiology [Internet]. New York, NY: Springer New York; 2009. 10.1007/978-0-387-75847-3 [DOI] [Google Scholar]
- 9.Keener JP. Mathematical physiology 2009: systems physiology ii. 2nd revise Springer; 2008. [Google Scholar]
- 10.Beard DA. Biosimulation: simulation of living systems [Internet]. Cambridge University Press; 2012. Available: https://books.google.com/books?id=PPl3yNpij9gC&pg=PR4&lpg=PR4&dq=Daniel+A.+Beard.+Biosimulation:+Simulation+of+Living+Systems.+Cambridge+University+Press,+Cambridge,+UK.,+2012.+ISBN+978-0-521-76823-8.&source=bl&ots=RKhaR4C26H&sig=WXszESobIMh3VrWyH9lDX8nuZ [Google Scholar]
- 11.Voit EO. A first course in systems biology. Garland Science; 2013. [Google Scholar]
- 12.Pearlstein RA, Hu Q-Y, Zhou J, Yowe D, Levell J, Dale B, et al. New hypotheses about the structure-function of proprotein convertase subtilisin/kexin type 9: Analysis of the epidermal growth factor-like repeat A docking site using WaterMap. Proteins Struct Funct Bioinforma. Wiley-Blackwell; 2010;78: 2571–2586. 10.1002/prot.22767 [DOI] [PubMed] [Google Scholar]
- 13.Pearlstein RA, Sherman W, Abel R. Contributions of water transfer energy to protein-ligand association and dissociation barriers: Watermap analysis of a series of p38α MAP kinase inhibitors. Proteins Struct Funct Bioinforma. 2013;81 10.1002/prot.24276 [DOI] [PubMed] [Google Scholar]
- 14.Tran Q-T, Williams S, Farid R, Erdemli G, Pearlstein R. The translocation kinetics of antibiotics through porin OmpC: Insights from structure-based solvation mapping using WaterMap. Proteins Struct Funct Bioinforma. 2013;81 10.1002/prot.24185 [DOI] [PubMed] [Google Scholar]
- 15.Velez-Vega C, McKay DJJ, Kurtzman T, Aravamuthan V, Pearlstein RA, Duca JS. Estimation of solvation entropy and enthalpy via analysis of water oxygen-hydrogen correlations. J Chem Theory Comput. 2015;11 10.1021/acs.jctc.5b00439 [DOI] [PMC free article] [PubMed] [Google Scholar]
- 16.Pratt JM, Petty J, Riba-Garcia I, Robertson DHL, Gaskell SJ, Oliver SG, et al. Dynamics of Protein Turnover, a Missing Dimension in Proteomics. 2002; 579–591. 10.1074/mcp.M200046-MCP200 [DOI] [PubMed] [Google Scholar]
- 17.Hopper AK, Patel M, Furia BS, Peltz SW, Trotta CR, Trotta CR, et al. Proteome Half-Life Dynamics in Living Human Cells. 2011; 764–769. [DOI] [PubMed] [Google Scholar]
- 18.Yen HS, Xu Q, Chou DM, Zhao Z, Elledge SJ. Global Protein Stability Profiling in Mammalian Cells. 2008;322: 918–924. [DOI] [PubMed] [Google Scholar]
- 19.Rothman S. How is the balance between protein synthesis and degradation achieved? 2010; 1–11. [DOI] [PMC free article] [PubMed] [Google Scholar]
- 20.Jiang X, Coffino P, Li X. Development of a method for screening short-lived proteins using green fluorescent protein. 2004; [DOI] [PMC free article] [PubMed]
- 21.Loriaux PM, Hoffmann A, Haugh JM. A Protein Turnover Signaling Motif Controls the Stimulus-Sensitivity of Stress Response Pathways. PLoS Comput Biol. 2013;9 10.1371/journal.pcbi.1002932 [DOI] [PMC free article] [PubMed] [Google Scholar]
- 22.Hoor M ten. “Are we there yet?”… Can Equilibrium ever be Achieved? ChemEd NZ. 2009; 7–8 Available: http://nzic.org.nz/chemed-nz/issue-archive.html [Google Scholar]
- 23.Invitrogen Corporation. Theory of Binding Data Analysis. Fluoresc Polariz Tech Resour Guid Chapter 7. 2008; 1–18. Available: www.invitrogen.com/drugdiscovery
- 24.Grefhorst A, Mcnutt MC, Lagace TA, Horton JD. Plasma PCSK9 preferentially reduces liver LDL receptors in mice. 2008;49: 1303–1311. 10.1194/jlr.M800027-JLR200 [DOI] [PMC free article] [PubMed] [Google Scholar]
- 25.Benjannet S, Rhainds D, Essalmani R, Mayne J, Wickham L, Jin W, et al. NARC-1/PCSK9 and Its Natural Mutants ZYMOGEN CLEAVAGE AND EFFECTS ON THE LOW DENSITY LIPOPROTEIN (LDL) RECEPTOR AND LDL CHOLESTEROL*. 2004; 10.1074/jbc.M409699200 [DOI] [PubMed]
- 26.Schulz R, Schluter KD, Laufs U. Molecular and cellular function of the proprotein convertase subtilisin/kexin type 9 (PCSK9). Basic Res Cardiol. 2015;110 10.1007/s00395-015-0463-z [DOI] [PMC free article] [PubMed] [Google Scholar]
- 27.Gustafsen C, Olsen D, Vilstrup J, Lund S, Reinhardt A, Wellner N, et al. Heparan sulfate proteoglycans present PCSK9 to the LDL receptor. Nat Commun. Springer US; 2017;8: 1–14. 10.1038/s41467-016-0009-6 [DOI] [PMC free article] [PubMed] [Google Scholar]
- 28.Stork D, Timin EN, Berjukow S, Huber C, Hohaus a, Auer M, et al. State dependent dissociation of HERG channel inhibitors. Br J Pharmacol. 2007;151: 1368–1376. 10.1038/sj.bjp.0707356 [DOI] [PMC free article] [PubMed] [Google Scholar]
- 29.Dahl G, Akerud T. Pharmacokinetics and the drug-target residence time concept. Drug Discov Today. 2013;18: 697–707. 10.1016/j.drudis.2013.02.010 [DOI] [PubMed] [Google Scholar]
- 30.Folmer RHAA. Drug target residence time: a misleading concept. Drug Discov Today. 2017;00: 1–5. 10.1016/j.drudis.2017.07.016 [DOI] [PubMed] [Google Scholar]
- 31.Annunziata CM, Davis RE, Demchenko Y, Bellamy W, Zhan F, Lenz G, et al. Frequent engagement of the classical and alternative NF-κB pathways by diverse genetic abnormalities in multiple myeloma. Cancer Cell. 2007;12: 115–130. 10.1016/j.ccr.2007.07.004 [DOI] [PMC free article] [PubMed] [Google Scholar]
- 32.Copeland RA, Pompliano DL, Meek TD. Drug–target residence time and its implications for lead optimization. Nat Rev Drug Discov. 2006;5: 730–739. 10.1038/nrd2082 [DOI] [PubMed] [Google Scholar]
- 33.Schoop A, Dey F. On-rate based optimization of structure-kinetic relationship—Surfing the kinetic map. Drug Discov Today Technol. Elsevier Ltd; 2015;17: 9–15. 10.1016/j.ddtec.2015.08.003 [DOI] [PubMed] [Google Scholar]
Associated Data
This section collects any data citations, data availability statements, or supplementary materials included in this article.
Supplementary Materials
(a) Plot of Btotal(τ) (gray), c(τ) at a fixed L0 = Kd =1 nM and Λ =50 min (ki = k−i = 1x10⁻³ s-1, = 1x10⁷ M-1 s-1), in which kon was sampled between 1x10⁷ M-1 s-1 to 1x10⁹ M-1 s-1 (solid lines color-coded from blue to red according to increasing kon), and Bfree(τ) (dotted lines color coded the same as c(τ)). (b) Same as (a), except Λ = 5 min (ki = k−i = 1x10⁻² s-1, = 1x10⁸ M-1 s-1). (c) Same as (a), except Λ = 30 s (ki = k−i = 1x10⁻¹ s-1, = 1x10⁹ M-1 s-1). (d) Same as (a), except Λ = 3 s (ki = k−i = 1x100 s-1, = 1x10¹⁰ M-1 s-1). (e) Same as (a), except Λ = 300 ms (ki = k−i = 1x101 s-1, = 1x10¹¹ M-1 s-1). kon = 1x10⁹ M-1 s-1, the fastest kon sampled at this ki (which is 100-fold < ), results in nearly zero occupancy.
(TIF)
(a) Plot of Btotal(τ) (gray), c(τ) at a fixed L0 = 19 ⋅ Kd = 19 nM and Λ = 50 min (ki = k−i = 1x10⁻³ s-1), in which kon was sampled between 1x10³ to 1x10⁵ M-1 s-1 (solid lines color-coded from blue to red according to increasing kon), and Bfree(τ) (dotted lines color coded the same as c(τ)). (b) Same as (a), except Λ = 5 min (ki = k−i = 1x10⁻² s-1, = 1x10⁸ M-1 s-1). (c) Same as (a), except Λ = 5 min (ki = k−i = 1x10⁻² s-1) and L0 = 100 nM. kon = 1x10⁵ M-1 s-1, the fastest kon sampled at this ki (which is 1,000-fold < ), fails to achieve the SSO profile. (d) Same as (c), except L0 = 200 nM.
(TIF)
(a) Plot of Btotal(τ) (gray), c(τ) at a fixed L0 = 19 ⋅ Kd = 19 nM and Λ =50 min (ki = k−i = 10−3 s-1, = 1x10⁷ M-1 s-1), in which kon was sampled between 1x10⁵ to 1x10⁷ M-1 s-1 (solid lines color-coded from blue to red according to increasing kon), and Bfree(τ) (dotted lines correspond to the c(τ) color scheme). (b) Same as (a), except Λ = 5 min (ki = k−i = 1x10⁻² s-1, = 1x10⁸ M-1 s-1). (c) Same as (a), except Λ = 300 ms (ki = k−i = 1x101 s-1, = 1x10¹¹ M-1 s-1) and L0 = 2 μM. Equilibrium occupancy (c95) is achieved at the fastest kon sampled (1x10⁶ to 1x10⁷ M-1 s-1), with the exception of Λ = 300 ms (ki = 1x101 s-1), which only reaches qSSO (even at L0 > 25 μM).
(TIF)
(a) Plot of Btotal(τ) (gray), c(τ) at a fixed L0 = 19 ⋅Kd = 19 nM and Λ = 50 min (ki = k−i = 1x10⁻³ s-1, = 1x10⁷ M-1 s-1), in which kon was sampled between 1x10⁷ to 1x10⁹ M-1 s-1 (solid lines color-coded from blue to red according to increasing kon), and Bfree(τ) (dotted lines correspond to the c(τ) color scheme). b) Same as (a), except Λ = 5 min (ki = k−i = 1x10⁻² s-1, = 1x10⁸ M-1 s-1). (c) Same as (a), except Λ = 30 s (ki = k−i = 1x10⁻¹ s-1, = 1x10⁹ M-1 s-1).
(TIF)
Plot of Btotal(τ) (gray), c(τ) at a fixed L0 = 1 nM and Λ = 38,508 hr (ki = k−i = 1x10⁻⁸ s-1), in which kon was sampled between 1x10³ M-1 s-1 to 1x10⁵ M-1 s-1 (solid lines color-coded from blue to red according to increasing kon), and Bfree(τ) (obscured by c(τ)).
(TIF)
(a) Plot of Btotal(τ) (gray), c(τ) at a fixed L0 = 1 nM and Λ = 3.85 hr (ki = k−i = 1x10⁻⁴ s-1), in which kon was sampled between 1x10⁴ M-1 s-1 to 1x10⁹ M-1 s-1 (solid lines color-coded from blue to red according to increasing kon), and Bfree(τ) (dotted lines color coded the same as c(τ)). (b) Same as (a), except Λ = 2.3 min (ki = k−i = 1x10⁻² s-1). (c) Same as (a), except Λ = 13.9 s (ki = k−i = 1x10⁻¹ s-1). (d) Same as (a), except Λ = 1.39 s (ki = k−i = 1x100 s-1). (e) Same as (a), except Λ = 139 ms (ki = k−i = 1x101 s-1).
(TIF)
Plot of Btotal(τ) (gray), c(τ) at a fixed Kd = 1 nM, Λ = 2.3 min (ki = k−i = 1x10⁻² s-1), koff = 1x10⁻⁵ s-1, and kon = 1x10⁴ M-1 s-1, in which L0 was sampled between 1 nM and 500 nM (solid lines), and Bfree(τ) (dotted lines color coded the same as c(τ)). kon < is only compensated at sufficiently high L0, which in this case, qSSO at L0 = 500 nM.
(TIF)
Data Availability Statement
All relevant data are within the paper and its Supporting Information files.


