Abstract
PiT-2, a type III sodium-dependent phosphate transporter, is a causative gene for the brain arteriolar calcification in people with familial basal ganglion calcification. Here we examined the effect of PiT-2 haploinsufficiency on vascular calcification in uremic mice using wild-type and global PiT-2 heterozygous knockout mice. PiT-2 haploinsufficiency enhanced the development of vascular calcification in mice with chronic kidney disease fed a high phosphate diet. No differences were observed in the serum mineral biomarkers and kidney function between the wild-type and PiT-2 heterozygous knockout groups. Micro computed tomography analyses of femurs showed that haploinsufficiency of PiT-2 decreased trabecular bone mineral density in uremia. In vitro, sodium-dependent phosphate uptake was decreased in cultured vascular smooth muscle cells isolated from PiT-2 heterozygous knockout mice compared with those from wild-type mice. PiT-2 haploinsufficiency increased phosphate– induced calcification of cultured vascular smooth muscle cells compared to the wild-type. Furthermore, compared to wild-type vascular smooth muscle cells, PiT-2 deficient vascular smooth muscle cells had lower osteoprotegerin levels and increased matrix calcification, which was attenuated by osteoprotegerin supplementation. Thus, PiT-2 in vascular smooth muscle cells protects against phosphate-induced vascular calcification and may be a therapeutic target in the chronic kidney disease population.
Keywords: chronic kidney disease, phosphate, PiT-2, vascular calcification, vascular smooth muscle cell
INTRODUCTION
Vascular calcification (VC), a component of chronic kidney disease (CKD)-mineral and bone disorder, increases the risk of cardiovascular disease and death in the CKD population.1,2 Among various risk factors for VC, phosphate (P) is the most powerful inducer.3–5 One of the mechanisms by which P induces VC is through direct effects on vascular smooth muscle cells (VSMCs) via PiT-1, a type III sodium (Na)-dependent P transporter.6,7 Increased extracellular P interacts with PiT-1, thereby inducing osteochondrogenic transition and apoptosis of VSMCs, degradation of extracellular matrix, and release of unstable matrix vesicles/exosomes.8–12 Currently, PiT-1 in VSMCs is considered as a therapeutic target for VC.
PiT-2 is the second member of the type III Na-dependent P transporter that is expressed in various tissues including VSMCs, renal proximal tubules, bones, and brain.13–15 Compared to PiT-1, the function of PiT-2 in VC has been much less investigated. However, recent gene linkage analyses disclosed that mutations in PiT-2 underlie a majority of the cases of familial basal ganglion calcification (FBGC). FBGC is a rare hereditary disorder characterized by arteriolar calcifications in the hypothalamic and basal ganglion regions of the brain that leads to a variety of adverse neurological symptoms.16–19 PiT-2 deficiency in mice recapitulates the brain calcification observed in people, and is associated with elevated P levels in cerebrospinal fluid.20,21 We have very recently shown that PiT-2 deficiency in mice decreases bone mineral density (BMD) in the craniofacial and long bones.22 To date, however, it is still not known how PiT-2 exerts its protective function against calcification in brain vessels, or if it also protects against VC in the peripheral circulation, either normally or under disease conditions.23,24 Thus, our aim was to elucidate the role of PiT-2 on VC using global PiT-2 heterozygous (HET) knockout mice and primary cultured VSMCs.21
RESULTS
PiT-2 targeting, genotype and phenotype of wild-type (WT) and HET mice
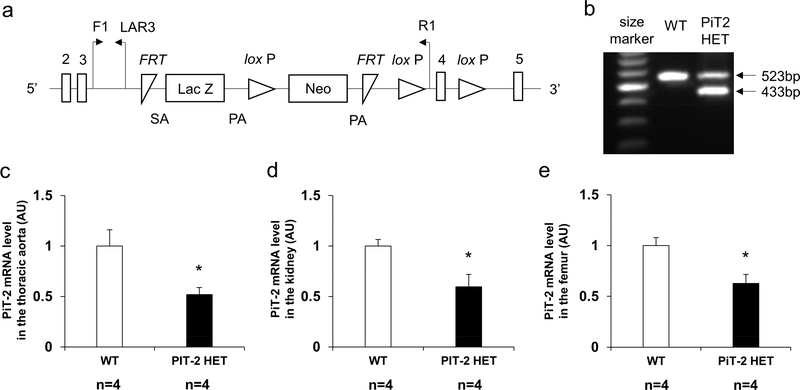
Figure 1a shows the gene targeting scheme for generating mice with a knockout-first allele of PiT-2. In the present study, PiT-2 HET mice were used instead of PiT-2 KO mice because PiT-2 KO mice showed early mortality and were susceptible to physical stress.21 DNA extracted from tail biopsy specimens showed that PiT-2 HET mice carried both WT and knockout-first alleles (Figure 1b). As shown in Figure 1c-e, mRNA expression of PiT-2 in the aorta, kidney, and femur of PiT-2 HET C57BL/6 mice was decreased by approximately 40% compared to WT C57BL/6 mice, as expected. Alizarin Red S staining of the abdominal aorta and brain revealed no calcification in 10-weeks-old female WT and PiT-2 HET C57BL/6 mice fed a standard diet (Supplemental Figure 1).
Figure 1 |. Genomic design of a knock-out first allele and characterization of PiT-2 HET mice.
(a) Presentation of the knockout-first allele. (b) Expression of genomic DNA determined by PCR in WT and PiT-2 HET mice. PiT-2 mRNA level in the (c) aorta, (d) kidney, (e) and femur. Three samples from each genotype were used for quantitative RT-PCR and six samples for biochemical determination. Data are expressed as mean ± SEM and compared by unpaired t-test. A two-tailed P<0.05 was considered statistically significant. *P<0.05 versus WT. AU, arbitrary unit; bp, base pair; F1, forward primer recognition site; FRT, flippase recognition target; LAR3, ligation amplification reaction. Neo, neomycin phosphotransferase; PA, polyadenylation; PiT-2 HET, PiT-2 heterozygous knockout; R1, reverse primer recognition site; SA, splice acceptor; WT, wild-type.
PiT-2 haploinsufficiency did not alter renal P handling in mice with intact kidney function
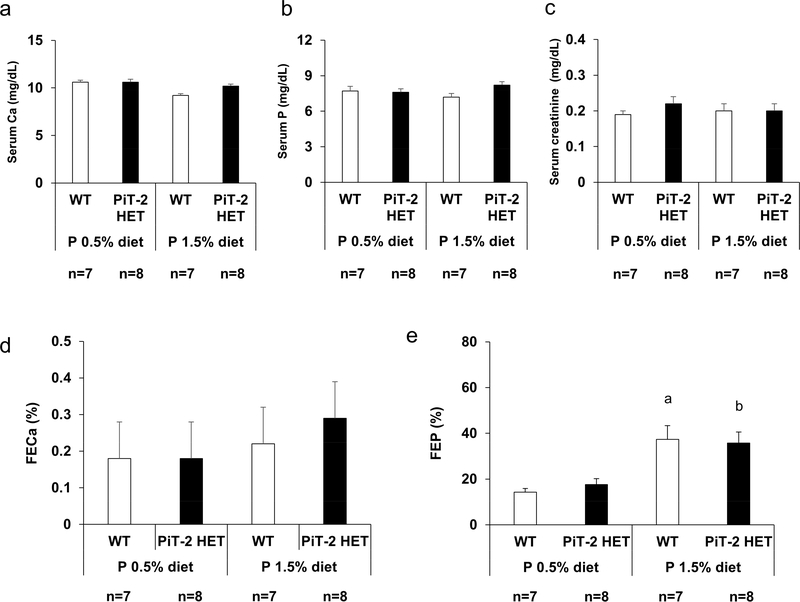
To determine the impact of PiT-2 haploinsufficiency on renal P handling in mice with intact kidneys, metabolic cage studies were performed. Twenty-weeks-old female WT and PiT-2 HET mice backcrossed onto DBA/2 strain for at least five generations were fed a normal (0.5%) P (NP) diet for 2 weeks and then switched to a high (1.5%) P (HP) diet for another 11 days (Supplementary Figure S1A). As shown in Figure 2a-c, when mice were fed a NP diet, no significant differences were observed in serum levels of P, calcium (Ca), and creatinine (Cr) between WT and PiT-2 HET groups. Likewise, after the diets were changed from 0.5% P to 1.5% P, no significant differences in serum P, Ca, and Cr levels and fractional excretion of Ca were observed between genotypes (Figure 2a-d). As for fractional excretion of P (FEP), HP diet feeding significantly increased FEP in both genotypes when compared with NP diet feeding (Figure 2e). However, there was no significant difference in FEP between WT and PiT-2 HET mice fed either a NP or HP diet.
Figure 2 |. Impact of PiT-2 haploinsufficiency on renal phosphate handling under normal kidney function (metabolic cage study).
(a) Serum Ca level. (b) Serum P level. (c) Serum creatinine level. (d) FECa on either a 0.5% P diet or 1.5% P diet. (e) FEP on either a 0.5% P diet or 1.5% P diet. Data are expressed as mean ± SEM (n=7–8) and compared by one-way ANOVA followed by Tukey–Kramer test. A two-tailed P<0.05 was considered statistically significant. aP<0.05 versus WT mice fed a 0.5% P diet. bP<0.05 versus PiT-2 HET mice fed a 0.5% P diet. ALP, alkaline phosphatase; Ca, calcium; FECa, fractional excretion of Ca; FEP, fractional excretion of P; P, phosphate; PiT-2 HET, PiT-2 heterozygous knockout; WT, wild-type.
PiT-2 protected against VC in CKD mice fed a high P diet
Next, we determined the role of PiT-2 haploinsufficiency in VC induced by CKD following NP or HP diet feeding (Supplementary Figure S1B). For these studies, female PiT-2 HET and WT mice were bred onto a DBA/2 background for at least five generations to enhance their susceptibility to VC.25–27 CKD was induced surgically using a two-step 5/6 nephrectomy procedure as previously described.28,29
None of the mice in any of the groups died during the study period. As shown in Table 1, there were no significant differences among the four groups regarding the baseline serum levels of urea nitrogen, Cr, Ca, and P. By contrast, as shown in Table 2, moderate renal insufficiency was induced in CKD mice based on serum urea nitrogen and Cr levels, and these were not significantly different between genotypes or diets. In addition, PiT-2 haploinsufficiency did not significantly alter serum levels of Ca, P, or alkaline phosphatase (ALP) in response to NP or HP diet. Consistent with previous findings,26 serum fibroblast growth factor 23 (FGF23) and parathyroid hormone (PTH) levels in the CKD/HP groups were significantly higher than those in the CKD/NP groups regardless of genotype. Interestingly, the serum osteoprotegerin (OPG) level in PiT-2 HET-CKD/HP mice was slightly, but significantly lower than WT-CKD/HP mice.
Table 1 |.
Serum biochemistries at baseline (CKD study)
| Group | n | BUN (mg/dL) | Serum Cr (mg/dL) | Serum Ca (mg/dL) | Serum P (mg/dL) |
|---|---|---|---|---|---|
| WT-CKD/NP | 6 | 15 ± 1 | 0.16 ± 0.02 | 11.3 ± 0.3 | 8.9 ± 0.5 |
| PiT-2 HET-CKD/NP | 5 | 16 ± 1 | 0.18 ± 0.01 | 10.6 ± 0.2 | 8.3 ± 0.3 |
| WT-CKD/HP | 8 | 17 ± 1 | 0.17 ± 0.02 | 11.1 ± 0.3 | 8.9 ± 0.5 |
| PiT-2 HET-CKD/HP | 10 | 16 ± 1 | 0.16 ± 0.01 | 10.9 ± 0.3 | 8.6 ± 0.2 |
Data are expressed as mean ± SEM and compared by one-way ANOVA followed by Tukey-Kramer test. A P-value less than 0.05 was considered statistically significant. BUN, blood urea nitrogen; Ca, calcium; CKD, chronic kidney disease; Cr, creatinine; HP, high (1.5%) P; NP, normal (0.5%) P; P, phosphate; PiT-2 HET, PiT-2 heterozygous knockout; WT, wild-type.
Table 2 |.
Serum biochemistries at termination (CKD study)
| Group | n | BUN (mg/dL) | Serum Cr (mg/dL) | Serum Ca (mg/dL) | Serum P (mg/dL) | Serum ALP (U/L) | Serum PTH (pg/mL) | Serum OPG (pg/mL) | Serum FGF23 (pg/mL) |
|---|---|---|---|---|---|---|---|---|---|
| WT-CKD/NP | 6 | 37 ± 3 | 0.28 ± 0.02 | 11.0 ± 0.2 | 7.0 ± 0.3 | 164 ± 7 | 473 ± 71 | 4467 ± 365 | 1539 ± 226 |
| PiT-2 HET-CKD/NP | 5 | 36 ± 2 | 0.30 ± 0.01 | 10.1 ± 0.2 | 8.6 ± 0.3 | 168 ± 10 | 660 ± 20 | 4743 ± 509 | 2670 ± 387 |
| WT-CKD/HP | 8 | 32 ± 2 | 0.29 ± 0.05 | 9.9 ± 0.3 | 10.0 ± 0.7 a | 146 ± 8 | 1490 ± 144 a | 5707 ± 379 | 6507 ± 1037 a |
| PiT-2 HET-CKD/HP | 10 | 43 ± 5 | 0.27 ± 0.04 | 9.1 ±0.3 | 10.4 ± 0.9 b | 165 ± 8 | 1462 ± 231 b | 4193 ± 360 c | 5618 ± 1307 b |
Data are expressed as mean ± SEM and compared by one-way ANOVA followed by Tukey-Kramer test. A P-value less than 0.05 was considered statistically significant.
P<0.05 versus WT-CKD/NP
P<0.05 versus PiT-2 HET-CKD/NP
P<0.05 versus WT-CKD/HP.
ALP, alkaline phosphatase; BUN, blood urea nitrogen; Ca, calcium; CKD, chronic kidney disease; Cr, creatinine; FGF23, fibroblast growth factor 23; HP, high (1.5%) P; NP, normal (0.5%) P; OPG, osteoprotegerin; P, phosphate; PiT-2 HET, PiT-2 heterozygous knockout; PTH, parathyroid hormone; WT, wild-type.
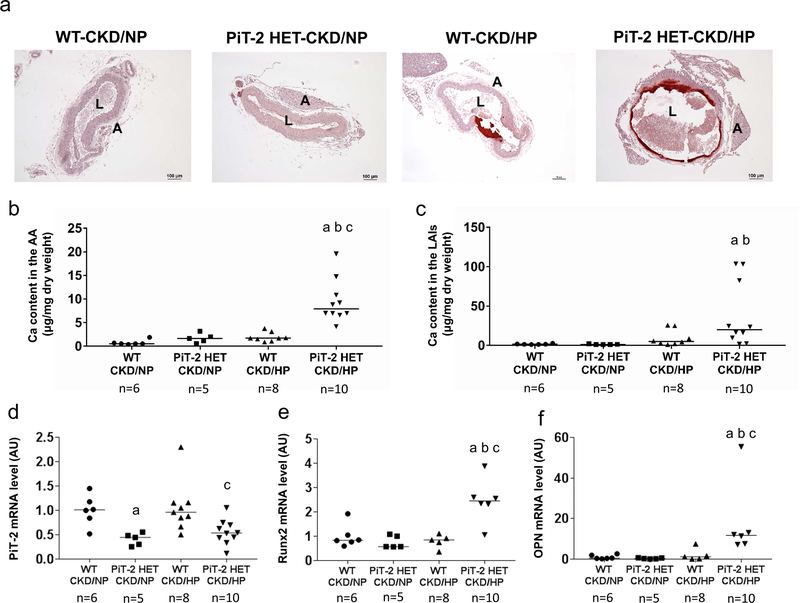
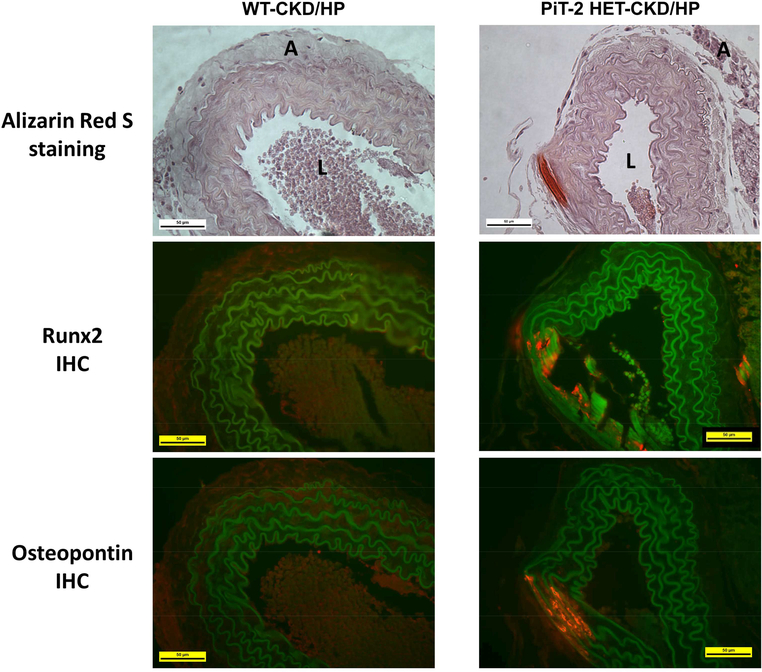
Uremic mice fed a NP diet did not develop calcification in the aorta as determined by Alizarin Red S staining (Figure 3a). In contrast, both WT and HET CKD mice fed the HP diet presented substantial aorta calcification restricted to the medial layer. Quantitation of Ca content revealed a 4.0-fold increase in Ca content in the aortic arch of PiT-2 HET-CKD/HP mice compared to WT-CKD/HP mice (Figure 3b). Likewise, a 5.0-fold increase was observed in PiT-2 HET-CKD/HP mice compared to WT-CKD/HP mice when Ca content was measured in lower abdominal aorta and common iliac arteries (9.6 ± 3.6 vs 38.4 ± 13.0 mg/μg, respectively, P=0.06) (Figure 3c). Importantly, PiT-2 mRNA expression in the aorta of PiT-2 HET-CKD mice was significantly decreased by half compared with that of WT-CKD mice, whereas mRNA expression of runt-related transcription factor 2 (Runx2) and osteopontin (OPN) were significantly increased in PiT-2 HET-CKD/HP mice compared to the other groups (Figure 3d-g). When protein expression of Runx2 and OPN were examined by immunohistochemistry, staining for both proteins was mostly evident at the calcified area of the medial layer of the aorta in the PiT-2 HET-CKD/HP mice and not present in the non-calcified area (Figure 4). Furthermore, the stained area of Runx2 and OPN in the PiT-2 HET-CKD/HP group was much greater than that in WT-CKD/HP group, indicating that both Runx2 and OPN expression was increased by PiT-2 haploinsufficiency under CKD and high P loading.
Figure 3 |. Effects of PiT-2 haplo-insufficiency on vascular calcification and calcification-related gene expression in CKD mice.
(a) Representative microphotograph of the abdominal aorta. Original magnification, x200, scale bar = 50 μm. (b) Calcium content in the AA. (c) Calcium content in the LAIs. Relative mRNA expression of (d) PiT-2, (e) Runx2, and (f) OPN in the aorta. Data are expressed as mean ± SEM (n=6–10) and compared by one-way ANOVA followed by Tukey–Kramer test or Steel-Dwass test. A two-tailed P<0.05 was considered statistically significant. aP<0.05 versus WT-CKD/NP group. bP<0.05 versus PiT-2 HET-CKD/NP group. cP<0.05 versus WT-CKD/HP group. AA, aortic arch; AU, arbitrary unit; CKD, chronic kidney disease; HP, high phosphate; LAIs, lower abdominal aorta with bilateral common iliac arteries; NP, normal phosphate; OPN, osteopontin; Runx2, runt-related transcription factor 2; PiT-2 HET, PiT-2 heterozygous knockout; WT, wild-type.
Figure 4 |. Immunohistochemistry of bone-related proteins in the abdominal aorta of CKD mice.
Sections of mouse abdominal aorta in the WT-CKD/HP and PiT-2 HET-CKD/HP groups were assessed by Alizarin Red S staining and immunohistochemistry for Runx2 and osteopontin. A, adventitia; CKD, chronic kidney disease; HP, high (1.5%) P diet; IHC, immunohistochemistry; L, lumen, P, phosphate; Runx2, runt-related transcription factor 2; WT, wild-type. Original magnification = 200x. Scale bar = 50 μm.
PiT-2 deficiency did not enhance brain calcification in CKD mice fed a high P diet
To determine the role of PiT-2 haploinsufficiency in brain calcification, we qualitatively examined calcification in the thalamus by Alizarin Red S staining. However, at termination, neither WT-CKD/HP mice nor PiT-2 HET-CKD/HP mice showed staining indicative of calcification in the hypothalamus (Supplemental Figure 2).
PiT-2 haploinsufficiency did not alter expression of major renal P transporters and renal P handling in CKD mice
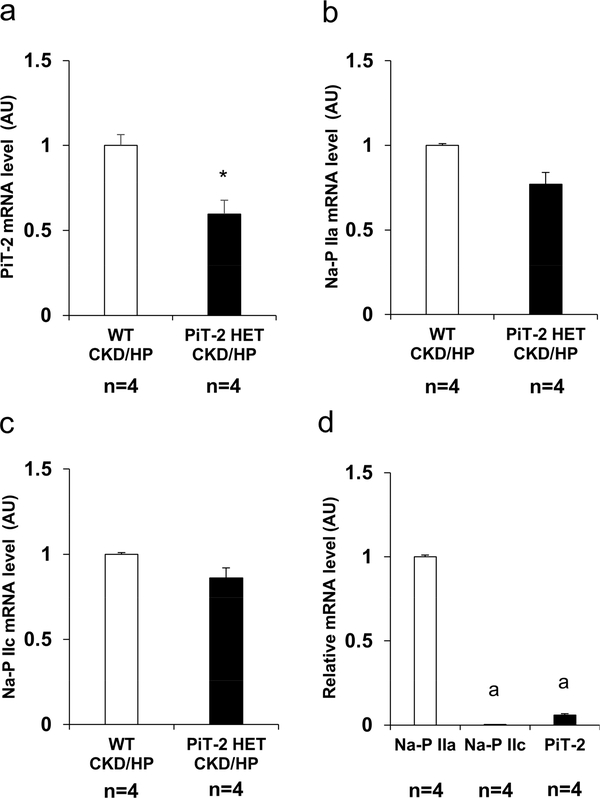
To determine whether PiT-2 haploinsufficiency in CKD and high P diet feeding alters renal expression of other Na-dependent P transporters, we examined mRNA expression of PiT-2 and Na-P IIa and IIc in the kidney. As expected, PiT-2 mRNA expression in the kidney of the PiT-2 HET-CKD/HP mice was significantly decreased compared with the WT-CKD/HP mice (Figure 5a). By contrast, no statistically significant differences were observed between the WT and PiT-2 HET mice (Figure 5b and c). Furthermore, when the expression of Na-dependent P transporters were compared in the WT group, the relative mRNA expression of Na-P IIa was 300 and 20 fold higher than Na-P IIc and PiT-2, respectively (Figure 5d).
Figure 5 |. Expression of Na-dependent P transporters in the kidney of CKD mice.
Relative mRNA level of (A) PiT-2, (B) Na-P IIa, and (C) Na-P IIc in the kidney. (D) Relative mRNA level of Na-dependent P transporters in the kidney. Data are expressed as mean ± SEM (n=4) and compared by unpaired t-test or one-way ANOVA followed by Tukey–Kramer test. A two-tailed P<0.05 was considered statically significant. *P<0.05 versus Na-P IIa mRNA expression. AU, arbitrary unit; CKD, chronic kidney disease; Na, sodium; P, phosphate; PiT-2 HET, PiT-2 heterozygous knockout; WT, wild-type.
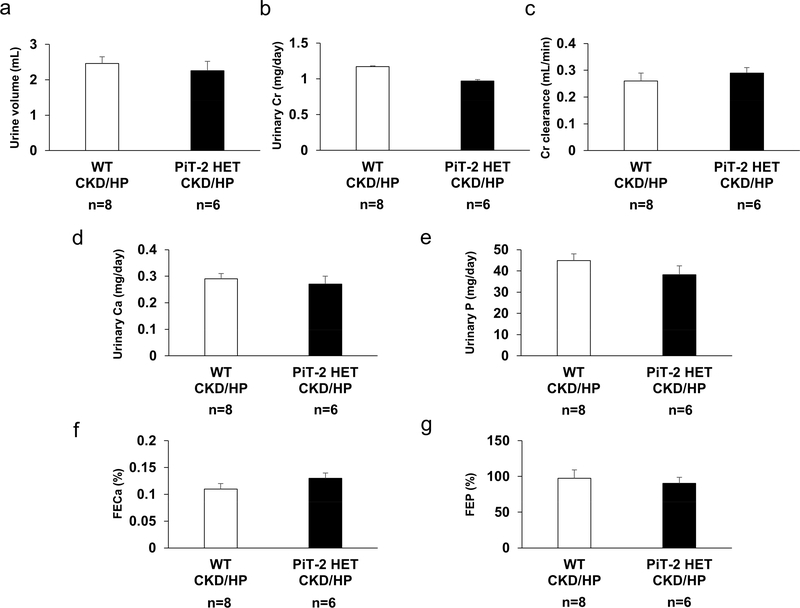
To further confirm the impact of PiT-2 haploinsufficiency on renal P handling under CKD and HP diet, we conducted metabolic cage study of CKD mice. As shown in Figure 6, there were no significant differences between WT-CKD/HP and PiT-2 HET-CKD/HP mice regarding urinary Cr, Ca, and P parameters including fractional excretion of Ca and FEP.
Figure 6 |. Effect of PiT-2 haploinsufficiency on renal phosphate handling under CKD (metabolic cage study).
(a) Urine volume. (b) Urinary Cr excretion. (c) Cr clearance. (d) Urinary Ca. (E) Urinary P. (f) FECa. (g) FEP. Ca, calcium; CKD, chronic kidney disease; Cr, creatinine; FECa, fractional excretion of Ca; FEP, fractional excretion of P; HP, high (1.5%) phosphate; PiT-2 HET, P, phosphate; PiT-2 heterozygous knockout; WT, wild-type. Data are expressed as mean ± SEM (n = 7 or 8) and compared by unpaired t-test. A two-tailed P<0.05 was considered statically significant.
PiT-2 haploinsufficiency decreased trabecular bone volume in CKD mice fed a high P diet
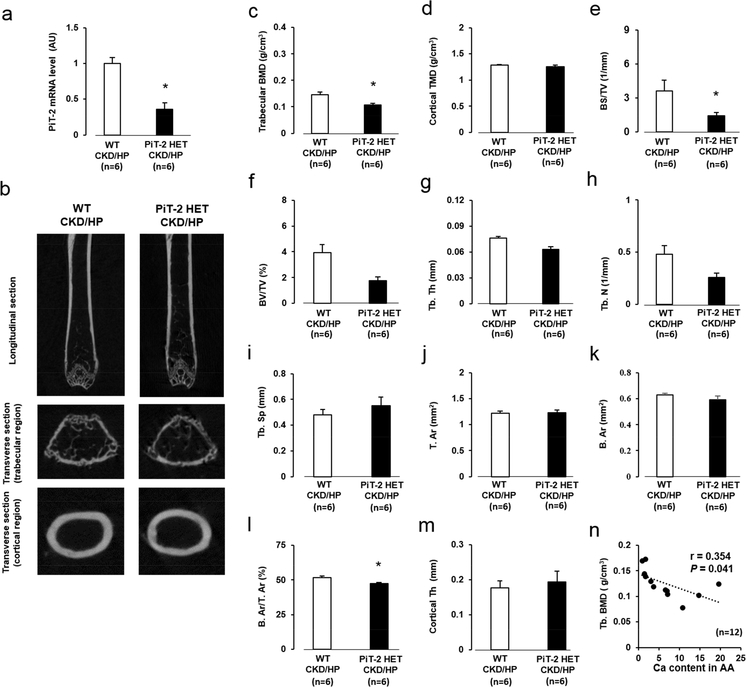
As expected, PiT-2 mRNA expression in the femur of the PiT-2 HET-CKD mice was almost half of the WT-CKD mice (Figure 7a). To determine the role of PiT-2 haploinsufficiency on bone metabolism under CKD and HP diet, we conducted micro computed tomography (CT) analyses of femurs (Figure 7b). Although overall cortical tissue mineral density was comparable, trabecular BMD in the PiT-2 HET-CKD/HP group was significantly decreased compared with the WT-CKD/HP group (Figure 7c and d).
Figure 7 |. Effect of PiT-2 haploinsufficiency on bone mineral density and static bone parameters measured by micro CT.
(a) PiT-2 mRNA expression in the aorta (b) Representative photomicrographs of femurs presented in longitudinal and transverse sections. (c) Trabecular BMD. (d) Cortical TMD. (e) BS/TV. (f) BV/TV. (g) Tb. Th. (h) Tb. N. (i) Tb. Sp. (j) T. Ar. (k) B. Ar. (l) B. Ar/T. Ar. (m) Cortical Th. (n) Correlation between aortic calcium content in the AA and trabecular BMD (n=12). Data are expressed as mean ± SEM (n=6) and compared by unpaired t-test. A two-tailed P<0.05 was considered statically significant. *P<0.05 versus WT-CKD/HP group. AA, aortic arch; Ar, area; B, bone; BMD, bone mineral density; BS; bone surface; BV, bone volume; CKD, chronic kidney disease; CT, computed tomography; HP, high P; N, number; NP, normal P; P, phosphate; PiT-2 HET, PiT-2 heterozygous knockout; Sp; separation; T, total; Tb, trabecular; Th, thickness; TMD, tissue mineral density; TV, total volume; WT, wild-type.
When specific bone parameters were further interrogated by micro CT, PiT-2 HET-CKD/HP had significantly decreased trabecular bone volume/total volume, bone thickness, body surface/total volume, and number and increased separation compared to WT-CKD/HP mice (Figure 7e-h). Although total area, bone area, and cortical thickness were comparable, bone area/trabecular area was significantly decreased in the PiT-2 HET-CKD/HP group compared with the WT-CKD/HP group (Figure 7j-m).
To determine the relationship between VC and bone metabolism in CKD mice, correlation analyses were conducted. A significant and negative correlation was observed between Ca content in the aortic arch and trabecular BMD (Figure 7n).
PiT-2 haploinsufficiency decreased P uptake and increased calcification of primary VSMCs (in vitro)
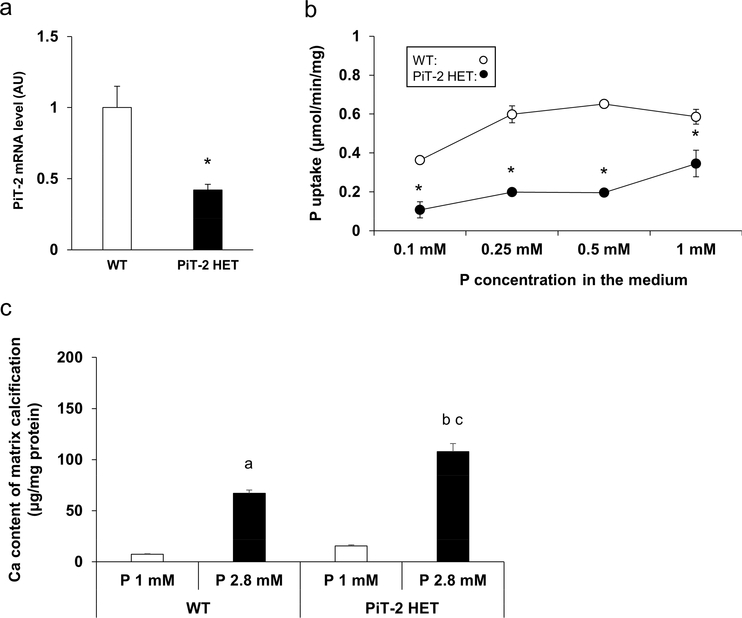
To determine whether PiT-2 haploinsufficiency directly affected the susceptibility of VSMCs to calcification, we isolated and cultured primary VSMCs from the aortas of WT and PiT-2 HET mice. As expected, PiT-2 mRNA levels were ~50 % lower in VSMCs from the PiT-2 HET mice compared to VSMCs from WT mice (Figure 8a). Consistent with PiT-2 expression levels, the rate of Na-dependent P uptake was significantly decreased in PiT-2 HET mice compared to WT mice (Figure 8b). Finally, when VSMCs from either genotype was cultured in medium containing high (2.8 mM) P, matrix calcification of the cultured VSMCs was significantly enhanced, and notably, Ca content in VSMCs derived from the PiT-2 HET mice was significantly increased compared with those from the WT mice (Figure 8c).
Figure 8 |. Effects of PiT-2 haploinsufficiency on cultured VSMCs.
(a) PiT-2 mRNA level. (b) Na-dependent P uptake rate. (c) Quantification of matrix calcification in the primary cultured VSMCs derived from either WT or PiT-2 HET mice. Data are expressed as mean ± SEM (n=3) and compared by un-paired t-test or one-way ANOVA followed by Tukey–Kramer test. A two-tailed P<0.05 was considered statically significant. *P<0.05 versus WT group. aP<0.05 versus WT-derived VSMCs treated with 1 mM P medium. bP<0.05 versus WT-derived VSMCs treated with 2.8% P medium. cP<0.05 versus PiT-2 HET-derived VSMCs treated with 1% P medium. Ca, calcium; Na, sodium; OPG, osteoprotegerin; P, phosphate; PiT-2 HET; PiT-2 heterozygous knockout; siRNA, small interfering RNA; VSMCs, vascular smooth muscle cells; WT, wild-type.
PiT-2 deficiency leads to enhanced calcification of VSMCs (in vitro)
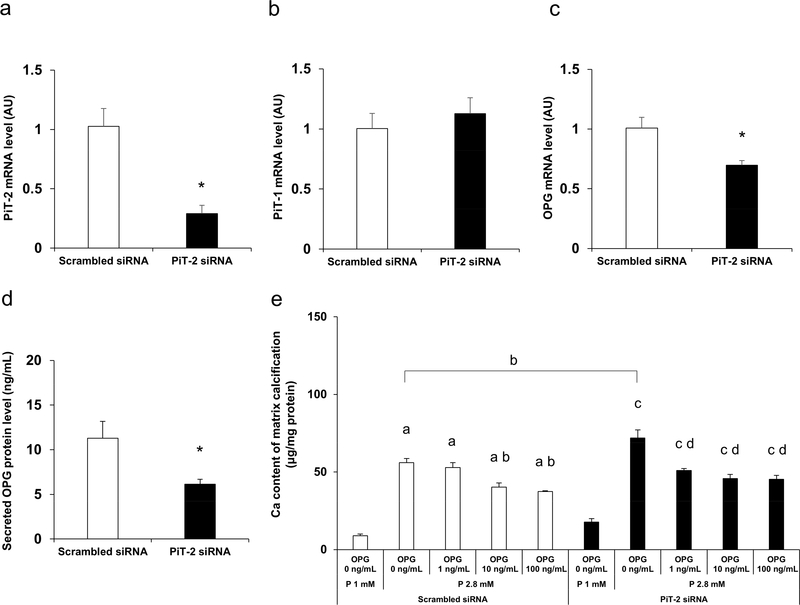
To elucidate the mechanisms by which PiT-2 deficiency leads to enhanced VSMCs susceptibility to P-induced calcification, we studied VSMCs in which PiT-2 levels were knocked down using small interfering RNA (siRNA). Preliminary high throughput RNA sequencing conducted using VSMCs treated with scrambled siRNA or PiT-2 siRNA disclosed that PiT-2 deficiency led to significantly decreased mRNA expression levels of OPG, a calcification inhibitor (data not shown).
To validate the RNA sequencing data, we knocked down PiT-2 and determined the expression of OPG in VSMCs. VSMCs were treated with either scrambled siRNA or PiT-2 siRNA, followed by incubation in normal P (1 mM) medium for three days. PiT-2 siRNA significantly decreased PiT-2 mRNA expression level by ~70% compared to scrambled siRNA, whereas no difference in PiT-1 mRNA level was observed between the groups (Figure 9a and b). Consistent with RNA sequencing data, the OPG mRNA level in PiT-2 knockdown cells was significantly lower than control cells (Figure 9c). Furthermore, the secreted OPG protein level in the conditioned media was also decreased significantly in VSMCs treated with PiT-2 siRNA compared with those treated with scrambled -siRNA (Figure 9d).
Figure 9 |. Effects of PiT-2 knockdown on the cultured VSMCs.
(a) PiT-2 mRNA level. (b) PiT-1 mRNA level. (c) OPG mRNA level. (d) OPG protein expression levels in the conditioned media of wild-type-derived VSMCs treated with either scrambled siRNA or PiT-2 siRNA and cultured under normal (1.0 mM) P medium for three days. (e) Quantification of calcium deposit in the matrix in WT-derived VSMCs treated with either scrambled siRNA or PiT-2 siRNA under OPG supplementation (0, 1, 10, or 100 ng/mL). Data are expressed as mean ± SEM (n=3) and compared by un-paired t-test or one-way ANOVA followed by Tukey–Kramer test. A two-tailed P<0.05 was considered statistically significant. *P<0.05 versus scrambled siRNA- VSMCs treated with 1% P medium aP<0.05 versus scrambled siRNA- VSMCs treated with 1 mM P medium without OPG supplementation. bP<0.05 versus scrambled siRNA- VSMCs treated with 2.8 mM P medium without OPG supplementation. cP<0.05 versus PiT-2 siRNA-VSMCs treated with 1 mM P medium without OPG supplementation. dP<0.05 versus PiT-2 siRNA-VSMCs treated with 2.8 mM P medium without OPG supplementation. AU, arbitrary unit; OPG, osteoprotegerin; P, phosphate; siRNA, small interfering RNA; VSMCs, vascular smooth muscle cells; WT, wild-type.
To determine whether addition of OPG could protect against calcification in PiT-2 knockdown cells, VSMCs were treated with increasing concentrations of exogenous OPG. As shown in Figure 9e, treatment with OPG significantly and dose-dependently decreased calcification in PiT-2 siRNA treated VSMCs compared to vehicle control. Likewise, OPG inhibited calcification of scrambled siRNA treated VSMCs, and at the highest OPG concentration, calcification levels in PiT-2 and scrambled siRNA treated cultures were comparable. (Figure 9e).
4. DISCUSSION
In the present study, PiT-2 haploinsufficiency enhanced aortic Ca deposition and decreased trabecular bone volume in uremic mice fed a high P diet. Notably, kidney function and serum mineral markers were not altered in PiT-2 HET mice compared with WT mice. In vitro, PiT-2 haploinsufficiency and deficiency enhanced P-induced matrix calcification of the cultured VSMCs in concomitant with a decrease in anti-calcific protein OPG. Finally, OPG supplementation attenuated matrix calcification of VSMCs enhanced by PiT-2 deficiency. These are the first studies to assess the role of PiT-2 in VC in uremic mice, and suggest that PiT-2 has a protective effect against VC.
PiT-1 and PiT-2, type III Na-dependent P transporters, were initially identified as receptors for retroviruses and considered to play house-keeping roles, but were subsequently found to have more cell-specific roles.13,30 PiT-1 promotes diverse calcification processes of VSMCs through increased osteochondrogenic differentiation.7,10,11 In contrast, in the present study, PiT-2 deficiency promoted VC both in vivo and in vitro, indicating the protective role of PiT-2 in VC. Our data is further supported by a very recent study showing an upregulation of PiT-2 in osteoblast-like cells by calcitriol, suggesting that the anti-calcific property was mediated by PiT-2.23 These results confirm the notion that the calcification process of VSMCs is regulated by these two type III Na-dependent P transporters and the impact of both transporters on VC are either procalcific or anti-calcific.
The mechanism whereby PiT-2 protects against VC is currently not known. In the present study, PiT-2 haploinsufficiency and deficiency decreased OPG expression in the cultured VSMCs and OPG supplementation reversed the level of matrix calcification increased by PiT-2 deficiency. Our findings are consistent with previous studies showing OPG’s protective effects against VC, where it is known to modulate receptor activator of nuclear factor kappa B (RANK)/RANK-ligand/OPG axis.31–34 Furthermore, OPG binds to and inhibits tumor necrosis factor-related apoptosis-inducing ligand (TRAIL), which is involved in diverse VC process.35 Since TRAIL induces apoptosis of VSMCs, it may promote VC by providing nucleation basis for mineralization.36,37 Thus, it is likely that the increased susceptibility of PiT-2 deficient mice to VC observed in our uremic animal model was in part due to decreased OPG levels. Thus, PiT-2 may be a promising therapeutic target for the prevention of VC. However, it is also possible that increased OPG expression caused by PiT-2 deficiency is an indirect effect. Hence, further experimental studies are required to determine whether enhanced VC by PiT-2 deficiency was through OPG decrease in the VSMCs or by other unknown mechanisms.
Calcification inhibitors are also important in the regulation of ectopic calcification including VC.6,11 In the present study, we examined the impact of PiT-2 deficiency on OPN as well as OPG. Previous studies have shown that OPG and OPN are increased at the calcified vessel.38–40 Consistent with previous reports, OPN mRNA level was increased in the calcified vessel of PiT-2 HET-CKD/HP mice, indicating that OPN increases in response to calcification stress as a counter regulatory mechanism and not regulated by PiT-2. By contrast, OPG was decreased in PiT-2 HET mice as well as VSMCs treated with PiT-2 siRNA. These results suggest that PiT-2 differentially impacts the expression of some calcification inhibitors. Further studies are necessary to determine whether PiT-2 affects other calcification inhibitors, including matrix gla protein, and how PiT-2 regulates OPG expression.
As for the discrepancy between saturated P uptake test and high P-induced VC, P uptake-dependent and P uptake-independent functions of phosphate transporters have been described.10,41 In our previous study, we found that PiT-1 accelerates matrix calcification by both transporter function dependent and independent mechanisms.10 A recent study in bone cells has presented data supporting the hypothesis that PiT-2/PiT-1 heterodimers mediate P signaling independent of P uptake.42 Further studies are necessary to differentiate P uptake-dependent and -independent functions of PiT-2, especially with regard to its role in the pathogenesis of VC.
PiT-2 expression in the renal proximal tubule is affected by dietary P intake and has been proposed to regulate P reabsorption in the kidney.14 Thus, it is plausible to consider that PiT-2 haploinsufficiency may indirectly enhance VC by affecting renal function and P metabolism. Based on our metabolic cage study, PiT-2 haploinsufficiency did not affect renal P handling under normal kidney function and CKD compared with WT mice. When both genotypes were challenged with CKD and P loading, no differences were observed regarding kidney function and serum levels of P, PTH, and FGF23. Furthermore, the mRNA expression of renal Na-P IIa and Na-P IIc and serum FGF23 levels were comparable between the two CKD/HP groups. Importantly, Na-P IIa in the kidney was much higher than that of Na-P IIc and PiT-2 in the WT-CKD/HP group. These results collectively suggest that PiT-2 haploinsufficiency in the kidney is not contributing markedly to the increased VC in PiT-2 HET CKD/HP.
Considering that PiT-2 is a potentially therapeutic target for VC, it is of clinical significance to determine how PiT-2 expression is regulated in CKD. A very recent paper showed that PiT-2 expression was increased in the aorta of uremic rats.43 This paper indicated that PiT-2 might be regulated by some factors observed in the CKD condition. Given that PiT-2 is protective against VC, it is probable that PiT-2 increases in response to increased VC stress in CKD. Notably, in the present study, PiT-2 expression in the PiT-2 HET mice were consistently decreased in the aorta, kidney, and femur, independent of the customized diet. These results suggest that PiT-2 expression may not be regulated by P overload, high PTH, and high FGF23. Further studies are necessary to determine what factors associated with CKD affect PiT-2 expression in the tissues and in which organ PiT-2 expression is affected by CKD condition.
PiT-1 is expressed in the bone and involved in bone development and growth.42–45 In contrast, the role of PiT-2 in the bone has been much less studied.46,47 A recent study showed that normal bone mineralization was observed in PiT-1 hypomorphic mice and PiT-2 was increased in those mice, suggesting that PiT-2 might play a role in bone mineralization by compensating for PiT-1 loss.45 In the present study, trabecular BMD was decreased in the HET-CKD/HP group, whereas serum levels of Ca, P, and PTH were comparable between both CKD/HP groups. Interestingly, a negative correlation was observed between the levels of VC and trabecular BMD in uremic mice fed a high P diet. There is a growing evidence that the bone-vascular axis plays critical roles in the pathogenesis of VC.48,49 Indeed, both decreased and increased bone turnover are shown to accelerate VC process.50,51 In this regard, decreased mineralization in the bone of uremic PiT-2 HET mice fed a high P diet might have contributed to the enhanced VC in our study. However, it still remains unclear which bone cells were affected by PiT-2 deficiency and how PiT-2 deficiency altered bone metabolism. Hence, further studies including bone morphometric analysis and in vitro work with cultured bone cells are warranted to investigate the detailed mechanisms that will explain the impact of PiT-2 deficiency on bone metabolism in CKD.
In conclusion, global PiT-2 haploinsufficiency enhanced calcification of the aorta and decreased trabecular bone mineral density in the 5/6 nephrectomized mice fed a high P diet. Our in vitro study showed that PiT-2 deficiency augmented matrix calcification of cultured VSMCs, potentially, in part, by downregulating OPG. Further studies are necessary to determine the molecular mechanisms by which PiT-2 exerts its protective effect on VC and bone metabolism, especially the impact of PiT-2 deficiency on matrix vesicles formation.52 Understanding these mechanisms might provide promising new targets for the prevention and treatment of VC and bone disorders in the CKD population.
MATERIALS AND METHODS
Detailed materials and methods are available in Supplementary Information online.
Ethical consideration and animal care
Protocols were in compliance with the NIH Guideline for the Care and Use of Laboratory Animals and have been approved by the Institutional Animal Care and Use Committee at the University of Washington. All mice were maintained in a specific pathogen-free environment and housed in a climate-controlled on a 12 hour day/night cycle and allowed free access to food and water ad libitum.
Generation, genotyping, and breeding of PiT-2 HET mice
PiT-2 HET mice were purchased from European Mouse Mutant Archives.21 Female WT and PiT-2 HET littermates were used in the study. Genotyping of mice using DNA from tail biopsies was done using the standard HotSHOT method.21
Metabolic cage study of non-CKD mice
To determine the impact of PiT-2 haploinsufficiency on renal P handling, 20-week-old female WT and PiT-2 HET mice backcrossed to DBA/2 for at least five generations were fed 0.5% P diet for 2 weeks and then 1.5% P diet for another two weeks. Mice were housed in metabolic cages for 24 hours urine collections and saphenous vein blood was collected for FEP calculations (Supplementary Figure S1A).
Induction of VC by CKD and high P diet feeding
WT and PiT-2 HET mice with a mixed background of C57BL/6 and C57BL/6 NTac were backcrossed to DBA/2 mice for at least five generations. This is because previous studies have shown that DBA/2 mice are highly susceptible to ectopic calcification because of the lack of ATP-binding cassette subfamily C member 6 (ABCC6), which is involved in the anti-calcification pathway via adenosine metabolism, in contrast to C57BL/6.53 Female mice were used because they showed higher susceptibility to calcification than male mice.25,54 To induce CKD, female WT and PiT-2 HET mice aged 10–13 weeks underwent a two-step, 5/6 nephrectomy (Supplementary Figure S1B).28,29 Briefly, mice were anesthetized with isoflurane and underwent a total excision of the right kidney (CKD surgery 1). One week later, both poles of the left kidney were resected leaving an intact kidney segment that was returned to the body cavity (CKD surgery 2). After each surgery, the peritoneum was closed with 5/0 Visorb® suture and skin was closed with 7 mm wound clips. At two weeks after the CKD surgery 2, mice were placed on a normal (0.5%) or high (1.5%) P diet for 11 days and terminated. At termination, blood, spot urine, whole aorta, femurs, and remnant kidney were collected and stored until further analyses.
Metabolic cage study of CKD mice
To determine the impact of PiT-2 haploinsufficiency on renal P handling under CKD, 11-week-old female WT and PiT-2 HET mice backcrossed to DBA/2 for at least five generations underwent a two-step, 5/6 nephrectomy procedure. One week after the CKD surgery, mice were fed a 1.5% P diet for 1 week, followed by housing in metabolic cages for 24 hours urine collections and saphenous vein blood draw for calculating urine parameters (Supplementary Figure S1C).
Serum and urine analysis
Serum and urinary levels of P and ALP were determined by a standard auto-analyzer. Serum and urinary levels of urea nitrogen, Ca, Cr, OPG, PTH, and FGF23 were measured by commercially available kits.
Histological analysis of upper abdominal aorta and brain
Upper abdominal aortas and whole brains were fixed with modified Clark’s fixative (75% methanol and 25% glacial acetic acid), soaked in 70% ethanol, and embedded in paraffin. Serial sections (5–10 μm thickness) were used for Alizarin Red S staining and immunohistochemistry for Runx2 and OPN.26,27
Ca quantification of calcified aorta
Approximately 6 mm of the aortic arch and 4 mm of the lower abdominal aorta plus bilateral common iliac arteries were lyophilized to a constant weight, followed by Ca extraction with 0.6 mol/L hydrochloric acid at 37 ºC for 24 hours on a shaker, determined colorimetrically, and normalized to the tissue dry weight.12,21,26
Micro CT analysis of femurs
Femurs (n = 6 per group) from WT-CKD/HP and PiT-2 HET-CKD/HP groups were dissected, stored in 70% ethanol, and then scanned using a 1076 Skyscan micro CT desktop scanner (Skyscan, Kontich, Belgium). Raw scan data were subsequently reconstructed using NRecon software (v1.6.9.4) and analyzed using CTAn software (Skyscan). Morphometrics and densities were calculated for trabecular and cortical regions as previously described.22
Isolation and culture of VSMCs
VSMCs were isolated from aortas of 4-week-old WT and PiT-2 HET mice.7,10 Aortic VSMCs were seeded at a density of 1 × 10⁵ cells/mL for primary culture, and split 1:2 at confluency. Passages between 7 and 10 were used for the experiments.
P uptake test of VSMCs
Aortic VSMCs were incubated with radiolabeled H2PO4 and unlabeled K2HPO4 in either Na-containing Earle’s Balanced Salt Solution (EBSS) or Na-free, choline-containing EBSS for 20 min. 7,10 Lysate was then collected and radioactive counts were recorded using a liquid scintillation counter. Na-dependent P uptake was calculated by subtracting uptake in choline containing media from total P uptake in Na containing media and normalized to incubation time and protein concentration for the cell lysate determined by the Bicinchoninic acid (BCA) Protein Assay.
Induction and quantification of calcification in cultured VSMCs
To induce matrix calcification, VSMCs isolated from the WT and PiT-2 HET mouse aortas were cultured in the normal (1.0 mM) or high (2.8 mM) inorganic P medium for 6 days. Ca content of VSMCs was determined and normalized to total cellular protein determined by the BCA Protein Assay.7,10
PiT-2 knockdown and high throughput RNA sequencing in cultured VSMCs
To determine the effect of PiT-2 knockdown on gene and protein expression of VSMCs, primary cultured VSMCs isolated from WT mouse aorta were treated with either scramble siRNA or PiT-2 siRNA and exposed to high P medium (1.0 mM) for 3 days, followed by collection of total RNA and cultured media. Total RNA was used for quantitative RT-PCR. High-throughput RNA sequencing was conducted by standard methods (http://www.htseq.org/). The OPG protein levels in the cultured media were measured by an enzyme-linked immunosorbent assay.
OPG supplementation and matrix calcification of cultured VSMCs
To determine the effect of OPG, WT-derived VSMCs treated with either scrambled or PiT-2 siRNA were supplemented with medium that contain 3 mM FBS, 2.8 mM P, and recombinant OPG protein (0. 1, 10, or 100 ng/mL) for 6 days.
Quantitative real-time PCR
Standard methods were used as previously described.7,23 Primers and probes are shown in Table S1.
Statistical analyses
Data are presented as mean ± standard error. Normality was determined by Shapiro-Wilk test. Differences among groups were analyzed by unpaired t-test and one-way ANOVA, followed by Tukey–Kramer test, for normally-distributed data and Steel-Dwass test for non-normally distributed data. A two-tailed P<0.05 was considered statistically significant. All statistical analyses were performed using the JMP version 13.2 software program (SAS Institute Inc., Cary, NA, USA).
Detailed methods.
Supplementary Material
Table S1. List of primers and probes used for quantitative RT-PCR.
Figure S1. Study design of metabolic cage studies and CKD study.
Figure S2. Brain calcification in CKD mice
Acknowledgments
ACKNOWLEDGMENTS
C.M. Giachelli is supported by grants from the National Institutes of Health (HL62329, HL081785, and HL114611) and the Department of Defense (OR120074). S. Yamada is supported by grants from the Japanese Society for the Promotion of Science Postdoctoral Fellowship for Research Abroad (JSPS 20150701) and the Uehara Memorial Foundation 2017.
Footnotes
DISCLOSURE
All the authors declared no competing interests.
Publisher's Disclaimer: This is a PDF file of an unedited manuscript that has been accepted for publication. As a service to our customers we are providing this early version of the manuscript. The manuscript will undergo copyediting, typesetting, and review of the resulting proof before it is published in its final citable form. Please note that during the production process errors may be discovered which could affect the content, and all legal disclaimers that apply to the journal pertain.
REFERENCES
- 1.Blacher J, Guerin AP, Pannier B, et al. Arterial calcifications, arterial stiffness, and cardiovascular risk in end-stage renal disease. Hypertension. 2001;38:938–942. [DOI] [PubMed] [Google Scholar]
- 2.Russo D, Corrao S, Battaglia Y, et al. Progression of coronary artery calcification and cardiac events in patients with chronic renal disease not receiving dialysis. Kidney Int. 2011;80:112–118. [DOI] [PMC free article] [PubMed] [Google Scholar]
- 3.Jono S, McKee MD, Murry CE, et al. Phosphate regulation of vascular smooth muscle cell calcification. Circ Res. 2000;87:E10–E17. [DOI] [PubMed] [Google Scholar]
- 4.Giachelli CM, Jono S, Shioi A, et al. Vascular calcification and inorganic phosphate. Am J Kidney Dis. 2001;38(4 Suppl 1):S34–S37. [DOI] [PubMed] [Google Scholar]
- 5.Li X, Yang HY, Giachelli CM. Role of the sodium-dependent phosphate cotransporter, Pit-1, in vascular smooth muscle cell calcification. Circ Res. 2006;98:905–912. [DOI] [PubMed] [Google Scholar]
- 6.Giachelli CM. The emerging role of phosphate in vascular calcification. Kidney Int. 2009;75:890–897. [DOI] [PMC free article] [PubMed] [Google Scholar]
- 7.Li X, Yang HY, Giachelli CM. Role of the sodium-dependent phosphate cotransporter, Pit-1, in vascular smooth muscle cell calcification. Circ Res. 2006;98:905–912. [DOI] [PubMed] [Google Scholar]
- 8.Son BK, Kozaki K, Iijima K, et al. Statins protect human aortic smooth muscle cells from inorganic phosphate-induced calcification by restoring Gas6-Axl survival pathway. Circ Res. 2006;98:1024–1031. [DOI] [PubMed] [Google Scholar]
- 9.Kapustin AN, Chatrou ML, Drozdov I, et al. Vascular smooth muscle cell calcification is mediated by regulated exosome secretion. Circ Res. 2015;116:1312–1323. [DOI] [PubMed] [Google Scholar]
- 10.Chavkin NW, Chia JJ, Crouthamel MH, et al. Phosphate uptake-independent signaling functions of the type III sodium-dependent phosphate transporter, PiT-1, in vascular smooth muscle cells. Exp Cell Res. 2015;333:39–48. [DOI] [PMC free article] [PubMed] [Google Scholar]
- 11.Paloian NJ, Giachelli CM. A current understanding of vascular calcification in CKD. Am J Physiol Renal Physiol. 2014;307:F891–F900. [DOI] [PMC free article] [PubMed] [Google Scholar]
- 12.Pai A, Leaf EM, El-Abbadi M, et al. Elastin degradation and vascular smooth muscle cell phenotype change precede cell loss and arterial medial calcification in a uremic mouse model of chronic kidney disease. Am J Pathol. 2011;178:764–773. [DOI] [PMC free article] [PubMed] [Google Scholar]
- 13.Forster IC, Hernando N, Biber J, et al. Phosphate transporters of the SLC20 and SLC34 families. Mol Aspects Med. 2013;34:386–395. [DOI] [PubMed] [Google Scholar]
- 14.Villa-Bellosta R, Ravera S, Sorribas V, et al. The Na+-Pi cotransporter PiT-2 (SLC20A2) is expressed in the apical membrane of rat renal proximal tubules and regulated by dietary Pi. Am J Physiol Renal Physiol. 2009;296:F691–F699. [DOI] [PMC free article] [PubMed] [Google Scholar]
- 15.Collins JF, Bai L, Ghishan FK. The SLC20 family of proteins: dual functions as sodium-phosphate cotransporters and viral receptors. Pflugers Arch. 2004;447:647–652. [DOI] [PubMed] [Google Scholar]
- 16.Betsholtz C, Keller A. PDGF, pericytes and the pathogenesis of idiopathic basal ganglia calcification (IBGC). Brain Pathol. 2014;24:387–395. [DOI] [PMC free article] [PubMed] [Google Scholar]
- 17.Hsu SC, Sears RL, Lemos RR, et al. Mutations in SLC20A2 are a major cause of familial idiopathic basal ganglia calcification. Neurogenetics. 2013;14:11–22. [DOI] [PMC free article] [PubMed] [Google Scholar]
- 18.Keller A, Westenberger A, Sobrido MJ, et al. Mutations in the gene encoding PDGF-B cause brain calcifications in humans and mice. Nat Genet. 2013;45:1077–1082. [DOI] [PubMed] [Google Scholar]
- 19.Legati A, Giovannini D, Nicolas G, et al. Mutations in XPR1 cause primary familial brain calcification associated with altered phosphate export. Nat Genet. 2015;47:579–581. [DOI] [PMC free article] [PubMed] [Google Scholar]
- 20.Jensen N, Schrøder HD, Hejbøl EK, et al. Loss of function of Slc20a2 associated with familial idiopathic Basal Ganglia calcification in humans causes brain calcifications in mice. J Mol Neurosci. 2013;51:994–999. [DOI] [PMC free article] [PubMed] [Google Scholar]
- 21.Wallingford MC, Chia J, Leaf EM, et al. SLC20A2 deficiency in mice leads to elevated phosphate levels in cerbrospinal fluid and glymphatic pathway-associated arteriolar calcification, and recapitulates human idiopathic basal ganglia calcification. Brain Pathol. 2017;27:64–76. [DOI] [PMC free article] [PubMed] [Google Scholar]
- 22.Yamada S, Wallingford MC, Borgeia S, et al. Loss of PiT-2 results in abnormal bone development and decreased bone mineral density and length in mice. Biochem Biophys Res Commun. 2018;495:553–559. [DOI] [PMC free article] [PubMed] [Google Scholar]
- 23.Keasey MP, Lemos RR, Hagg T, et al. Vitamin-D receptor agonist calcitriol reduces calcification in vitro through selective upregulation of SLC20A2 but not SLC20A1 or XPR1. Sci Rep. 2016;6:25802. [DOI] [PMC free article] [PubMed] [Google Scholar]
- 24.Crouthamel MH, Lau WL, Leaf EM, et al. Sodium-dependent phosphate cotransporters and phosphate-induced calcification of vascular smooth muscle cells: redundant roles for PiT-1 and PiT-2. Arterioscler Thromb Vasc Biol. 2013;33:2625–2632. [DOI] [PMC free article] [PubMed] [Google Scholar]
- 25.van den Broek FA, Bakker R, den Bieman M, et al. Genetic analysis of dystrophic cardiac calcification in DBA/2 mice. Biochem Biophys Res Commun. 1998;253:204–208. [DOI] [PubMed] [Google Scholar]
- 26.El-Abbadi MM, Pai AS, Leaf EM, et al. Phosphate feeding induces arterial medial calcification in uremic mice: role of serum phosphorus, fibroblast growth factor-23, and osteopontin. Kidney Int. 2009;75:1297–1307. [DOI] [PMC free article] [PubMed] [Google Scholar]
- 27.Lau WL, Leaf EM, Hu MC, et al. Vitamin D receptor agonists increase klotho and osteopontin while decreasing aortic calcification in mice with chronic kidney disease fed a high phosphate diet. Kidney Int. 2012;82:1261–1270. [DOI] [PMC free article] [PubMed] [Google Scholar]
- 28.Hewitson TD, Ono T, Becker GJ. Small animal models of kidney disease: a review. Methods Mol Biol. 2009;466:41–57. [DOI] [PubMed] [Google Scholar]
- 29.Cooke D, Ouattara A, Ables GP. Dietary methionine restriction modulates renal response and attenuates kidney injury in mice. FASEB J. 2018;32:693–702. [DOI] [PubMed] [Google Scholar]
- 30.Biber J, Hernando N, Forster I. Phosphate transporters and their function. Annu Rev Physiol. 2013;75:535–550. [DOI] [PubMed] [Google Scholar]
- 31.Bucay N, Sarosi I, Dunstan CR, et al. Osteoprotegerin-deficient mice develop early onsetosteoporosis and arterial calcification. Genes Dev. 1998;12:1260–1268. [DOI] [PMC free article] [PubMed] [Google Scholar]
- 32.Bennett BJ, Scatena M, Kirk EA, et al. Osteoprotegerin inactivation accelerates advanced atherosclerotic lesion progression and calcification in older ApoE−/− mice. Arterioscler Thromb Vasc Biol. 2006;26:2117–2124. [DOI] [PubMed] [Google Scholar]
- 33.Panizo S, Cardus A, Encinas M, et al. RANKL increases vascular smooth muscle cell calcification through a RANK-BMP4-dependent pathway. Circ Res. 2009;104:1041–1048. [DOI] [PubMed] [Google Scholar]
- 34.Collin-Osdoby P Regulation of vascular calcification by osteoclast regulatory factors RANKL and osteoprotegerin. Circ Res. 2004;95:1046–1057. [DOI] [PubMed] [Google Scholar]
- 35.Harper E, Forde H, Davenport C, et al. Vascular calcification in type-2 diabetes and cardiovascular disease: Integrative roles for OPG, RANKL and TRAIL. Vascul Pharmacol. 2016;82:30–40. [DOI] [PubMed] [Google Scholar]
- 36.Chasseraud M, Liabeuf S, Mozar A, et al. Tumor necrosis factor-related apoptosis-inducing ligand and vascular calcification. Ther Apher Dial. 2011;15:140–146. [DOI] [PubMed] [Google Scholar]
- 37.Galeone A, Brunetti G, Oranger A, et al. Aortic valvular interstitial cells apoptosis and calcification are mediated by TNF-related apoptosis-inducing ligand. Int J Cardiol. 2013;169:296–304. [DOI] [PubMed] [Google Scholar]
- 38.Yoshida H, Yokoyama K, Yaginuma T, et al. Difference in coronary artery intima and media calcification in autopsied patients with chronic kidney disease. Clin Nephrol. 2011;75:1–7. [PubMed] [Google Scholar]
- 39.Fitzpatrick LA, Severson A, Edwards WD, Ingram RT. Diffuse calcification in human coronary arteries. Association of osteopontin with atherosclerosis. J Clin Invest. 1994;94:1597–604. [DOI] [PMC free article] [PubMed] [Google Scholar]
- 40.Kaden JJ, Bickelhaupt S, Grobholz R, et al. , Borggrefe M.Receptor activator of nuclear factor kappaB ligand and osteoprotegerin regulate aortic valve calcification. J Mol Cell Cardiol. 2004;36:57–66. [DOI] [PubMed] [Google Scholar]
- 41.Beck L, Leroy C, Salaün C, et al. Identification of a novel function of PiT1 critical for cell proliferation and independent of its phosphate transport activity. J Biol Chem. 2009;284:31363–31374. [DOI] [PMC free article] [PubMed] [Google Scholar]
- 42.Bon N, Couasnay G, Bourgine A, et al. Phosphate (Pi)-regulated heterodimerization of the high-affinity sodium-dependent Pi transporters PiT1/Slc20a1 and PiT2/Slc20a2 underlies extracellular Pi sensing independently of Pi uptake. J Biol Chem. 2018;293:2102–2114. [DOI] [PMC free article] [PubMed] [Google Scholar]
- 43.Hortells L, Sosa C, Guillén N, et al. Identifying early pathogenic events during vascular calcification in uremic rats. Kidney Int. 2017;92:1384–1394. [DOI] [PubMed] [Google Scholar]
- 44.Nielsen LB, Pedersen FS, Pedersen L. Expression of type III sodium-dependent phosphate transporters/retroviral receptors mRNAs during osteoblast differentiation. Bone. 2001;28:160–166. [DOI] [PubMed] [Google Scholar]
- 45.Bourgine A, Pilet P, Diouani S, et al. Mice with hypomorphic expression of the sodium-phosphate cotransporter PiT1/Slc20a1 have an unexpected normal bone mineralization. PLoS One. 2013;8:e65979. [DOI] [PMC free article] [PubMed] [Google Scholar]
- 46.Rendenbach C, Yorgan TA, Heckt T, et al. Effects of extracellular phosphate on gene expression in murine osteoblasts. Calcif Tissue Int. 2014;94:474–483. [DOI] [PubMed] [Google Scholar]
- 47.Suzuki A, Ghayor C, Guicheux J, et al. Enhanced expression of the inorganic phosphate transporter Pit-1 is involved in BMP-2-induced matrix mineralization in osteoblast-like cells. J Bone Miner Res. 2006;21:674–683. [DOI] [PubMed] [Google Scholar]
- 48.Thompson B, Towler DA. Arterial calcification and bone physiology: role of the bone-vascular axis. Nat Rev Endocrinol. 2012;8:529–543. [DOI] [PMC free article] [PubMed] [Google Scholar]
- 49.London GM. Bone-vascular axis in chronic kidney disease: a reality? Clin J Am Soc Nephrol. 2009;4:254–257. [DOI] [PubMed] [Google Scholar]
- 50.Neven E, Bashir-Dar R, Dams G, et al. Disturbances in Bone Largely Predict Aortic Calcification in an Alternative Rat Model Developed to Study Both Vascular and Bone Pathology in Chronic Kidney Disease. J Bone Miner Res. 2015;30:2313–2324. [DOI] [PubMed] [Google Scholar]
- 51.Ferreira CR, Ziegler SG, Gupta A, et al. Treatment of hypophosphatemic rickets in generalized arterial calcification of infancy (GACI) without worsening of vascular calcification. Am J Med Genet A. 2016;170A:1308–1311. [DOI] [PMC free article] [PubMed] [Google Scholar]
- 52.Kapustin AN, Chatrou ML, Drozdov I, et al. Vascular smooth muscle cell calcification is mediated by regulated exosome secretion. Circ Res. 2015;116:1312–1323. [DOI] [PubMed] [Google Scholar]
- 53.Le Saux O, Urban Z, Tschuch C, et al. Mutations in a gene encoding an ABC transporter cause pseudoxanthoma elasticum. Nat Genet. 2000;25:223–227. [DOI] [PubMed] [Google Scholar]
- 54.Qiao JH, Fishbein MC, Demer LL, Lusis AJ. Genetic determination of cartilaginous metaplasia in mouse aorta. Arterioscler Thromb Vasc Biol. 1995;15:2265–2272. [DOI] [PubMed] [Google Scholar]
Associated Data
This section collects any data citations, data availability statements, or supplementary materials included in this article.
Supplementary Materials
Table S1. List of primers and probes used for quantitative RT-PCR.
Figure S1. Study design of metabolic cage studies and CKD study.
Figure S2. Brain calcification in CKD mice


