Abstract
Identification of small molecule ligands that bind to proteins is a critical step in drug discovery. Computational methods have been developed to accelerate the prediction of protein-ligand binding, but often depend on 3D protein structures. As only a limited number of protein 3D structures have been resolved, the ability to predict protein-ligand interactions without relying on a 3D representation would be highly valuable. We use an interpretable confidence-rated boosting algorithm to predict protein-ligand interactions with high accuracy from ligand chemical substructures and protein 1D sequence motifs, without relying on 3D protein structures. We compare several protein motif definitions, assess generalization of our model’s predictions to unseen proteins and ligands, demonstrate recovery of well established interactions and identify globally predictive protein-ligand motif pairs. By bridging biological and chemical perspectives, we demonstrate that it is possible to predict protein-ligand interactions using only motif-based features and that interpretation of these features can reveal new insights into the molecular mechanics underlying each interaction. Our work also lays a foundation to explore more predictive feature sets and sophisticated machine learning approaches as well as other applications, such as predicting unintended interactions or the effects of mutations.
Keywords: ligand, protein, interactions, motifs, drug discovery, quantitative structure-activity relationships, QSAR
1. Introduction
1.1. Decreasing returns in drug discovery pipelines
Return on investment in drug discovery efforts continues to decline, an observation that has been called Eroom’s law, or Moore’s law spelled backward [Scannell 2012]. Despite the use of high-throughput drug screens and increasingly sophisticated experimental and computational methods, many compounds that initially appear promising fail in later stages of testing after substantial investment has already been made. Predicting drug efficacy and toxicity as early as possible is of great advantage in an increasingly difficult drug discovery pipeline.
1.2. Existing methods for prediction of protein-ligand interactions
The most cost-effective procedure for screening compounds at any early stage would enable computational methods before more expensive, time-consuming experiments in vitro or in animals. There have been numerous efforts to computationally predict protein-ligand interactions (often referred to as quantitative structure-activity relationship or QSAR models). However, many of these methods rely on solved 3D structures to locate the binding pocket or other key features of the protein [Wang et al. 2014, Ragoz et al 2016, Ewing et al. 2001, Leach et al. 2006, Liang et al. 2003]. However only a small proportion of proteins, mapping to around 5,000 unique genes, with complete amino acid sequences have resolved 3D crystal structures [Berman et al. 2000, Hicks et al. 2017]. Thus, as an alternative to secondary or tertiary protein structure, we explore the use of features derived directly from known 1D sequences of proteins to describe the protein in the absence of structural information. This approach allows us to train models spanning a much larger collection of proteins.
Unlike methods relying on 3D structure, we featurize 1D protein sequences using protein motifs (amino acid-based) and ligand motifs (substructure-based) and learn combinations of these motif pairs that underlie each protein-ligand interaction. It is known that protein-ligand binding largely occurs at a single broad site (i.e. the binding pocket) in the protein and a specific set of atoms in the ligand. If we can successfully learn the properties of these molecular interfaces in the form of motif interactions, we could potentially screen for interactions for proteins that lack well annotated crystal structures.
Several methods have attempted to predict protein-ligand interactions without 3D structural data. One class of methods [Jacob and Vert 2008] uses the therapeutic class of a protein in conjunction with the chemical structure of the ligand. Other classes of methods [Campillos et al. 2008] follow a “guilt by association” principle by trying to determine similarity of an uncharacterized compound to other compounds with known targets. Both of these methods rely on existing annotated knowledge that limit extension to classes of uncharacterized proteins. We show that we are able to use sequence-based features of proteins and structure-based features of ligands to predict protein-ligand interactions without depending on existing targets or similar annotations.
The primary advantage of our approach is that it relies only on protein and ligand motifs without needing crystallized structures or direct comparisons to well understood protein-ligand interactions. In addition, we are able to look at which protein-ligand motif pairs combine together in a given interaction, thereby localizing the interaction to key parts of the protein and ligand. This work also lays a foundation to use the same motif-based approach to predict unintended secondary interactions of a compound, which is useful as many drugs also fail for such off-target effects. Further extensions enabled by reducing interactions to key motifs are assessing the impact of mutations through their effect on essential motifs underlying the interaction and predicting which protein variants are most susceptible to altered drug binding.
2. Methods
2.1. Data set
With the goal of predicting protein-ligand interactions from only protein sequence and ligand structure features, we first aggregated several sources of known protein-ligand interactions for training data. From the PubChem database of 3D structures with ligands from the Protein Data Bank (PDB) [Berman et al. 2000] we identified 69,959 proteins with a ligand bound. From the DrugBank [Wishart et al. 2006] we extracted 10,888 interactions of FDA-approved and experimental drugs with their known protein targets. From BindingDB [Chen et al. 2001] we used 30,925 interactions of drug target proteins and small molecules.
In order to eliminate identical or nearly-identical interactions, we compared all protein sequences to each other using pairwise BLAST (blastp), and grouped proteins having >90% identity. This resulted in 16,357 proteins and 25,118 ligands with a total of 62,561 positive interactions. We sampled protein-ligand pairs for training and test sets using different cross-validation strategies (see Section 2.5) to have a 1:100 imbalance of positives to negatives. The data set as a whole contains ~0.1% positives, but we found improved training and feasible construction of cross-validation folds with a 1:100 imbalance.
2.2. Protein Featurization
We used a bag-of-features representation for protein sequences, which does not preserve sequential order of features. We explored several different types of features to represent protein sequences. We used conserved signatures, defined by Prosite motifs [Hulo et al. 2008] and Pfam domains [Finn et al. 2006]. Prosite motifs include biologically meaningful residues, including but not limited to binding domains, post-translational modification sites and other active sites. Pfam domains are conserved protein domains based on multiple alignments and hidden Markov model profiles. We used two types of Prosite domains: “all Prosite” (all original motifs) and “short Prosite” motifs that exclude any motifs longer than 50 amino acids in order to avoid motifs that cover a majority of the protein. We trained models on all three motif types. Our featurizations resulted in 1,472 unique Prosite motifs, 1,071 short Prosite motifs and 3,324 Pfam motifs after limiting only to motifs that appeared in our data set. Each protein has an average of 5.8 all Prosite motifs, 1.5 short Prosite motifs and 1.5 Pfam motifs.
2.3. Ligand Featurization
We also used a bag-of-features representation for ligands. To featurize ligands we used structural signatures, also known as chemical substructures. PubChem [Kim et al. 2005] makes freely available a set of 554 substructures in the SMARTS format [Weininger 1988] that can be scanned in the ligand. 299 of these substructures were present in at least one compound in our full set of protein-ligand interactions. Ligands had an average of 22.8 substructure motif features.
2.4. Boosting Model
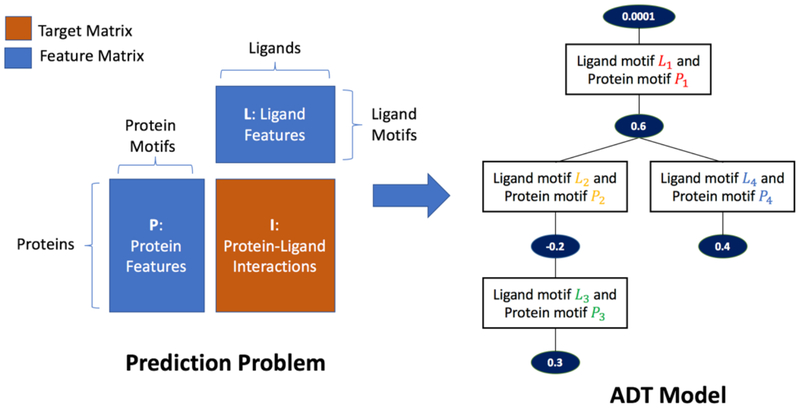
Our classification task was set up as the prediction of a binary matrix of protein-ligand interactions from paired feature sets of proteins and ligands, one for each dimension of the interaction matrix. Proteins are represented by the presence/absence of a set of protein motifs. Ligands are represented by the presence/absence of a set of ligand motifs. This formulation of the learning problem thus involves three binary matrices: matrix I for interactions of size (# proteins, # ligands) that we try to predict from matrix P for protein features of size (# proteins, # protein motifs) and matrix L for ligand features of size (# ligands, # ligand motifs). Figure 1 illustrates the data set up.
Figure 1.
Left: Prediction of protein-ligand interactions from two feature matrices. Right: The resulting Alternating Decision Tree (ADT) model where each splitter node contains a protein motif-ligand motif pair rule and the following prediction node contains the score for the rule.
To learn the prediction function, we use an algorithm known as MEDUSA [Kundaje et al. 2008] based on confidence-rated boosting algorithms [Schapire et al. 1999] and specifically optimized for learning from factorized paired interacting feature spaces. We implemented the algorithm as an efficient, parallelized software package called PFBoost [Greenside et al. 2017]. The algorithm iteratively minimizes the exponential loss to learn the structure and composition of a model known as an Alternating Decision Tree (ADT), which is a margin-based generalization of decision trees [Figure 1]. The algorithm begins with an empty ADT. All training examples are initially assigned an equal weight. Iteratively, (i) the algorithm learns a rule (called a splitter node) which is a simple binary predictor based on the presence of a protein motif-ligand motif pair (shown as rectangle boxes in Figure 1, Right), with an associated score (shown as ovals prediction nodes in Figure 1, Right), that minimizes the exponential loss across all training examples; and (ii) learns the optimal position for the rule to be added to the current structure of the ADT, either to the root prediction node or conditionally following another prediction node elsewhere in the ADT. After each iteration, the training examples are re-weighted according to the error in the current predictions to prioritize finding rules for incorrectly predicted examples in the subsequent iterations.
A path in the ADT is defined as any subset of contiguous, connected nodes from the root node down to a terminal node. Each path captures conditional dependencies in the rules. A training/test example can satisfy a rule (presence/absence of a motif-pair) encoded in a node in a path only if the example satisfies all the rules in the nodes that precede it in the path, i.e. the example has all the motif-pair rules in the preceding nodes. The final ADT model is thus an ensemble of conditional rules that allow a quantitative ‘prediction score’ on a protein-ligand example as the sum of the scores of all rules in valid paths that the example satisfies. The sign of the prediction score indicates the predicted binary output (interaction or no interaction) and the magnitude indicates the confidence of prediction.
This setup lends itself naturally to the prediction of a protein-ligand interaction as a function of combinations of protein motif-ligand motif pairs that are involved in the interaction. In our efficient, parallelized implementation, we further take advantage of linear algebra tricks involving sparse matrix operations that can implicitly compute the loss of all pairs of motif features at each boosting iteration without explicitly storing the outer product of the two feature spaces [Kundaje et al. 2008]. These optimizations allow us to scale to large datasets.
2.5. Cross Validation Approaches
We used cross validation in order to assess our model’s ability to predict held out protein-ligand interactions. In order to avoid inflated performance, we also clustered proteins based on their homology (see Section 2.1) into mutually exclusive groups and made sure that proteins belonging to the same group did not occur in the same training or testing folds. We used 10-fold cross validation, and we implemented four cross validation approaches to appropriately evaluate our ability to generalize to different categories of data:
Random holdout: We randomly sample entries in the target matrix to hold out. This results in seeing the same proteins and ligands in both training and test sets although not the same combinations.
Column holdout: We randomly sample some columns (ligands) to hold out entirely from the training set.
Row holdout: We randomly sample some rows (proteins) to hold out entirely from the training set.
Quadrant holdout: We randomly sample some columns (ligands) and rows (proteins) to hold out entirely from the training set.
3. Results
3.1. Model Performance
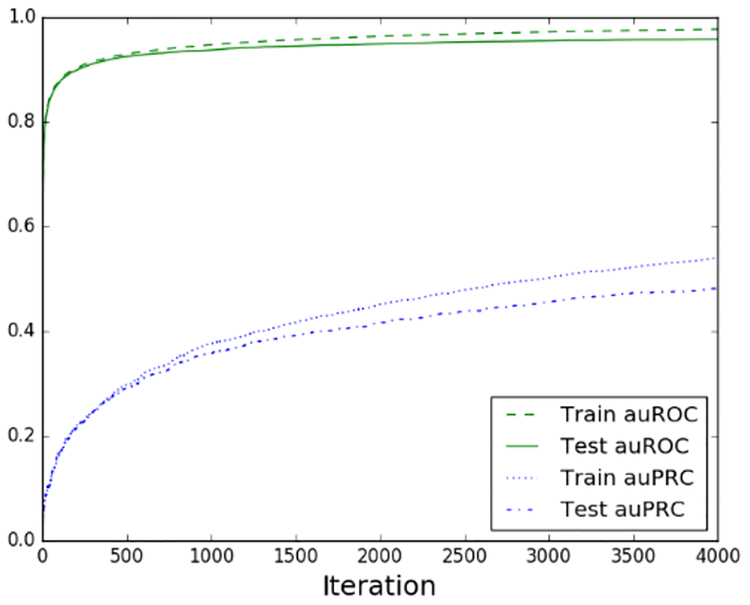
We trained our models for 4,000 iterations after observing that performance begins to plateau around that point [Figure 2]. Due to the significant class imbalance of the dataset we evaluated our predictive accuracy with auROC and auPRC. Boosting is well known for its inherent resistance of overfitting. We observe high performance for random holdout with minimal overfitting [Table 1]. However, a more interesting question is how well the model performs when entire classes of ligands and proteins are held out. As expected we observe a larger degree of overfitting when holding out groups of proteins or ligands as opposed to random entries [Table 1], but the model seemed to generalize quite well to held out ligands and had more difficulty with held out proteins. This result could be partly explained by sparse featurization of proteins as well as the grouping of homologous proteins into common cross-validation folds.
Figure 2.
Learning curve over 4,000 iterations for prediction with all Prosite motifs and random holdout.
Table 1.
Performance for all types of cross validation and for the three protein feature sets.
| All Prosite | Pfam | Short Prosite | |
|---|---|---|---|
| auROC, random holdout (Train/Test) | 0.96/0.95 | 0.95/0.93 | 0.94/0.93 |
| auPRC, random holdout (Train/Test) | 0.45/0.42 | 0.42/0.41 | 0.31/0.30 |
| auROC, ligand holdout (Train/Test) | 0.96/0.93 | 0.92/0.82 | 0.97/0.93 |
| auPRC, ligand holdout (Train/Test) | 0.46/0.32 | 0.38/0.19 | 0.39/0.31 |
| auROC, protein holdout (Train/Test) | 0.98/0.84 | 0.93/0.84 | 0.97/0.85 |
| auPRC, protein holdout (Train/Test) | 0.54/0.23 | 0.40/0.20 | 0.38/0.27 |
| auROC, quadrant holdout (Train/Test) | 0.96/0.95 | 0.91/0.86 | 0.97/0.95 |
| auPRC, quadrant holdout (Train/Test) | 0.45/0.34 | 0.36/0.29 | 0.38/0.34 |
We compared different types of motif feature sets for proteins - all Prosite, Pfam and short Prosite motifs - and we found that highest predictive power is achieved with all Prosite motifs by only a small amount. This is likely at least partly due to the larger number of Prosite motifs per protein, which give a richer featurization. As a result, we performed all downstream analysis on the model trained with all Prosite motifs and random holdout.
3.2. Most predictive motif features
The ADT model has all the advantages of a boosting-based ensemble method but also retains interpretability since it is a single generalized tree structure in contrast to the more standard boosted ensemble of decision trees. We analyzed the ADT to identify predictive protein motifs, ligand motifs and interactions of protein motifs and ligand motifs. We found that 595 of 1,472 Prosite protein motifs and 237 of 299 ligand substructure motifs were selected by the algorithm at some node in the model. We can directly assess how much each feature (protein or ligand motif) or feature pair (protein motif-ligand motif pair) in the ADT contributed to the overall margin of prediction (true label*prediction score) for each example by computing the difference in the margin score before and after nullifying the contribution of all nodes from the ADT containing the feature or feature pair. This essentially deletes these nodes from the ADT and re-computes the prediction as though they did not exist. We rank each protein motif-ligand motif pair from most to least “important” by its total effect on the prediction margin [Table 2]. We also separately compute the margin scores for each protein motif and ligand motif, separating out those that contributed to a positive or negative prediction.
Table 2.
Top 10 nodes in the ADT for contribution to the margin of prediction for positive interactions.
| Prosite Name | Prosite ID | SMART string | SMART name | |
|---|---|---|---|---|
| 1 | PROTEIN_KINASE_DOM | PS50011 | C(-C)(-N) | Ethylamine |
| 2 | PKC_PHOSPHO_SITE | PS00005 | C(-C)(-O) | Ethanol |
| 3 | CK2_PHOSPHO_SITE | PS00006 | C(-N)(=O) | Formamide |
| 4 | PROTEIN_KINASE_DOM | PS50011 | C=O | Formaldehyde |
| 5 | MYRISTYL | PS00008 | C(-O)(-O) | Methanediol |
| 6 | TYR_PHOSPHO_SITE | PS00007 | C(-C)(-O) | Ethanol |
| 7 | CK2_PHOSPHO_SITE | PS00006 | C(-C)(-O) | Ethanol |
| 8 | PKC_PHOSPHO_SITE | PS00005 | O-C-C-C-O | 1,3-Propanediol |
| 9 | CK2_PHOSPHO_SITE | PS00006 | C(-C)(-N) | Ethylamine |
| 10 | CAMP_PHOSPHO_SITE | PS00004 | C(-C)(-N) | Ethylamine |
To determine whether the margin scores for each feature were significant, we computed empirical p-values by shuffling the target matrix 100 times and calculating the number of times the feature’s margin score was greater than or equal to the set of margin scores for all features over all permuted matrices. This resulted in 2149 significant nodes or protein-ligand motifs pairs that significantly contributed to a positive protein-ligand interaction.
3.3. Known positive examples
Our margin-ranked features and feature pairs identified many compelling protein-ligand motif pairs that explain known protein-ligand interactions.
3.3.1. Uricase - Uric acid
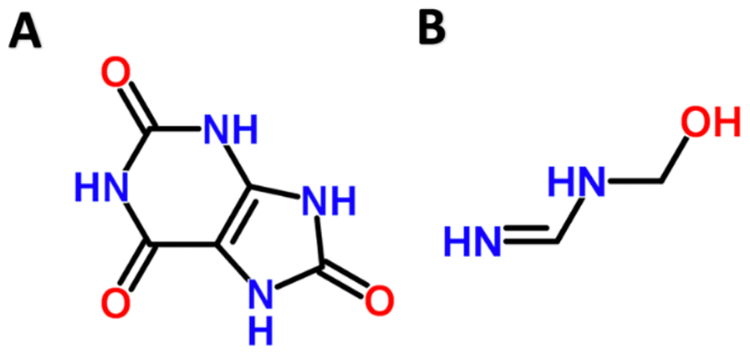
One of the significant nodes in our model shows PS00366 binds ligand motif O=C-N-C-N. PS00366 is uricase, which binds uric acid. The ligand motif O=C-N-C-N looks just like part of the uricase structure [Figure 3]. Further, we could confirm in PDB that there are many instances where PS00366 is within 5 angstroms of O=C-N-C-N [Berman et al. 2000].
Figure 3.
Uric acid (A) is bound by Uricase. The ligand motif O=C-N-C-N (B) was paired with Uricase in our model.
3.3.2. Chloramphenicol O-acetyltransferase – Chloramphenicol
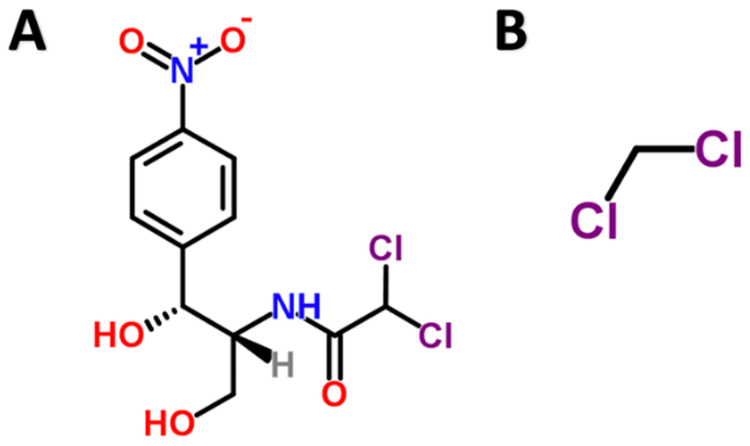
In another example, we found that PS00100, which is Chloramphenicol O-acetyltransferase, binds C(-Cl)(-Cl). C(-Cl)(-Cl) is a substructure of Chloramphenicol [Figure 4] and Chloramphenicol is the target of Chloramphenicol O-acetyltransferase.
Figure 4.
Chloramphenicol (A) and substructure C(-Cl)(-Cl) (B), which was paired with Chloramphenicol O-acetyltransferase in our model.
3.3.3. Transthyretin –T4
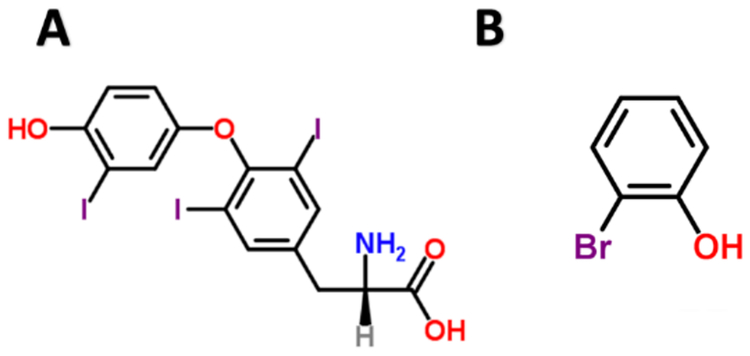
We found PS00768 paired to substructure motif Oc1c(Br)cccc1. PS00768 is transthyretin, a thyroid hormone-binding protein that is known to transport thyroxine (T4) from the bloodstream to the brain [Sigrist et al. 2012]. The substructure Oc1c(Br)cccc1 is 2-bromophenol, which looks just like one of the key substructures in thyroxine with one halogen replaced for another [Figure 5].
Figure 5.
Thyroxine (A) is a hormone transported by transthyretin. 2-bromophenol (B) is a substructure motif paired with transthyretin in our model.
3.4. Interpreting ADT Paths
3.4.1. Path lengths
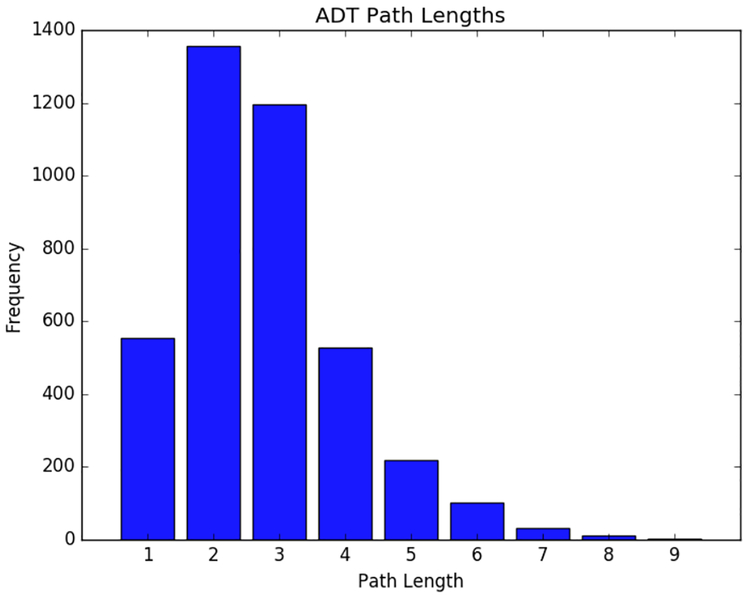
While it is encouraging to see many well known interactions explained by specific protein-ligand motifs, it is even more interesting to understand how these motif pairs combine with each other. Each path of size n in the ADT represents a combination of n protein motifs paired with n ligand motifs that additively give a final prediction of an interaction. When there is little interaction between features we often see stumps or short paths, but many paths in our model showed predictive combinations of up to 9 motif pairs [Figure 6].
Figure 6.
Distribution of path lengths in the ADT model suggests many interactions between protein-ligand motif pairs.
3.4.2. Protein kinase C – Phosphatidylserine
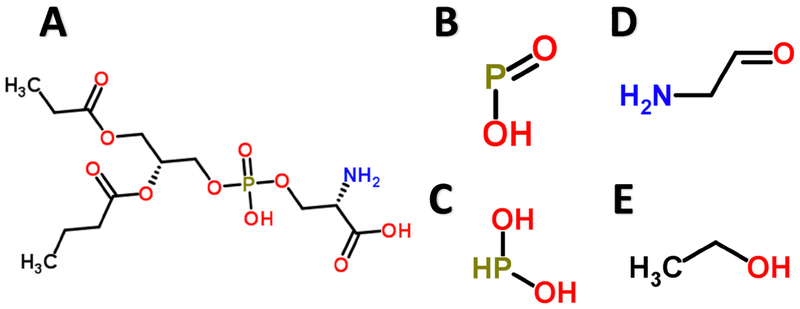
One such compelling example is a path of length 6 consisting of 4 ligand substructures (2 repeated in different nodes) all paired with PS00005, which is Protein kinase C phosphorylation site. Protein kinase C binds phosphatidylserine [Newton 1995]. The four unique ligand substructures were P(-O)(=O), C(~C)(~O), P(~O)(~O), and O=C-C-N, all of which resemble substructures of phosphatidylserine [Figure 7].
Figure 7.
Phosphatidylserine (A) is known to bind to Protein kinase C. Four substructure motifs (B, C, D, E) in the same path all paired with Protein kinase C and resemble substructures in (A).
4. Discussion
We have presented a method to predict protein-ligand interactions from only protein sequence motifs and ligand substructure motifs, without relying on 3D structure of proteins or known targets. This is one of the few methods that bridges chemical knowledge of ligand structures with biological knowledge of protein sequence in order to predict interactions between the two with high accuracy. In addition to demonstrating that it is possible to predict protein-ligand interactions using only motif-based featurizations, we further demonstrate that it is possible to extend our predictions to entirely held out ligands and also, although to a lesser extent, held out proteins.
We then demonstrate that we are able to interpret protein and ligand motif features from the model. There is limited existing knowledge on how individual motifs in ligands and proteins interact with one another in a given protein-ligand interaction without a 3D structure. We show that some of the pairs that we recover as most important in the model are actually known pairings from crystallized structures and thus our predictions may extend to non-crystallized structures. We also show how we can rapidly propose hypotheses about essential motif pairs with predictive pairings from our boosting model. In future work, we would like to extend the same modeling effort to predict interactions that may be off-target effects, although it is much harder to obtain enough confident training labels in that application.
Based on the success of using known protein motifs and ligand substructures, we envision generating novel feature sets that may provide even greater resolution. Protein motifs annotated in Prosite and PFAM are annotated with ligand-binding domains, which we have successfully recapitulated; the next step is to extend to unannotated features of sequences. It may be useful to extend the method to more general motifs such as protein k-mers or electrostatic groups of those k-mers in place of known protein motifs. We see an opportunity to apply more sophisticated methods such as multi-modal deep neural networks, which could learn powerful de-novo features from raw protein sequences and ligands, and functional embeddings. While there are numerous opportunities to extend this work, we have shown that even simple motif-based approaches can achieve competitive accuracy in protein-ligand predictions and can provide useful interpretation.
Acknowledgments
We are grateful for support from the Burroughs Wellcome Career Award at the Scientific Interface (MH) and BioX Stanford Interdisciplinary Graduate Fellowship (PG).
Contributor Information
Peyton Greenside, Program in Biomedical Informatics, Stanford University, Stanford, CA 94305.
Maureen Hillenmeyer, Stanford Genome Technology Center, Stanford University, Palo Alto, CA 94304.
Anshul Kundaje, Departments of Genetics and Computer Science, Stanford University, Stanford, CA 94305.
References
- 1.Berman H, Westbrook J, Feng Z, Gilliland G, Bhat T, Weissig H, Shindyalov I, and Bourne P (2000). The protein data bank. Nucleic Acids Res, 28(1):235–42. [DOI] [PMC free article] [PubMed] [Google Scholar]
- 2.Campillos M, Kuhn M, Gavin A-C, Jensen LJ, and Bork P (2008). Drug target identification using side-effect similarity. Science, 321(5886):263–6. [DOI] [PubMed] [Google Scholar]
- 3.Chen X, Lin Y, and Gilson M (2001). The binding database: overview and user’s guide. Biopolymers, 61(2):127–41. Journal Article United States. [DOI] [PubMed] [Google Scholar]
- 4.Dassault Systèmes BIOVIA, Pipeline Pilot, San Diego: Dassault Systèmes, 2008. [Google Scholar]
- 5.Ewing T, Makino S, Skillman A, and Kuntz I (2001). Dock 4.0: search strategies for automated molecular docking of flexible molecule databases. / Comput Aided Mol Des, 15(5):411–28. [DOI] [PubMed] [Google Scholar]
- 6.Finn R, Mistry J, Schuster-Bockler B, Griffiths-Jones S, Hollich V, Lassmann T, Moxon S, Marshall M, Khanna A, Durbin R, Eddy S, Sonnhammer E, and Bateman A (2006). Pfam: clans, web tools and services. Nucleic Acids Res, 34(Database issue):D247–51. [DOI] [PMC free article] [PubMed] [Google Scholar]
- 7.Greenside P, Hussami N, Chang J, Kundaje A. PyBoost: A parallelized Python implementation of 2D boosting with hierarchies. bioRxiv 170803; doi: 10.1101/170803 [DOI] [Google Scholar]
- 8.Hicks M, Bartha I, Iulio J, Abagyan R, Venter C, Telenti A. Functional characterization of 3D-protein structures [DOI] [PMC free article] [PubMed]
- 9.Informed by human genetic diversity. bioRxiv 182287; doi: 10.1101/182287. [DOI] [Google Scholar]
- 10.Hulo N, Bairoch A, Bulliard V, Cerutti L, Cuche B, de Castro E, Lachaize C, Langendijk-Genevaux R, and Sigrist C (2008). The 20 years of prosite. Nucleic Acids Res, 36(Database issue):D245–9. [DOI] [PMC free article] [PubMed] [Google Scholar]
- 11.Kim S, Thiessen PA, Bolton EE, Chen J, Fu G, Gindulyte A, Han L, He J, He S, Shoemaker BA, Wang J, Yu B, Zhang J, Bryant SH. PubChem Substance and Compound databases. Nucleic Acids Res. 2016. January 4; 44(D1):D1202–13. 10.1093/nar/gkv951. [DOI] [PMC free article] [PubMed] [Google Scholar]
- 12.Kotz, Treichel, and Weaver (2008). Chemistry and Chemical Reactivity, Enhanced Review Edition. [Google Scholar]
- 13.Kundaje A, Xin X, Lan C, Lianoglou S, Zhou M, Zhang L, and Leslie C (2008). A predictive model of the oxygen and heme regulatory network in yeast. PLoS Comput Biol, 4(11):e1000224. [DOI] [PMC free article] [PubMed] [Google Scholar]
- 14.Leach AR, Shoichet BK, and Peishoff CE (2006). Prediction of protein-ligand interactions, docking and scoring: successes and gaps. J Med Chem, 49(20):5851–5. [DOI] [PubMed] [Google Scholar]
- 15.Liang MP, Banatao DR, Klein TE, Brutlag DL, and Altman RB (2003). WebFEATURE: An interactive web tool for identifying and visualizing functional sites on macromolecular structures. Nucleic Acids Res, 31(13):3324–7. [DOI] [PMC free article] [PubMed] [Google Scholar]
- 16.Newton AC (1995). Protein kinase C: structure, function, and regulation. Journal of Biological Chemistry, 270(48), 28495–28498. [DOI] [PubMed] [Google Scholar]
- 17.Ragoza M, Hochuli J, Idrobo E, Sunseri J, & Koes DR (2016). Protein-Ligand Scoring with Convolutional Neural Networks. arXiv preprint arXiv:1612.02751. [DOI] [PMC free article] [PubMed] [Google Scholar]
- 18.Royal Society of Chemistry (2015). ChemSpider. http://www.chemspider.com/. Accessed July 2017.
- 19.Scannell JW, Blanckley A, Boldon H, & Warrington B (2012). Diagnosing the decline in pharmaceutical R&D efficiency. Nature reviews Drug discovery, 11(3), 191–200. [DOI] [PubMed] [Google Scholar]
- 20.Schapire RE., and Singer Y. “Improved boosting algorithms using confidence-rated predictions.” Machine learning 373 (1999): 297–336. [Google Scholar]
- 21.Sigrist CJA, de Castro E, Cerutti L, Cuche BA, Hulo N, Bridge A, Bougueleret L, Xenarios I New and continuing developments at PROSITE. Nucleic Acids Res. 2012; doi: 10.1093/nar/gks1067. [DOI] [PMC free article] [PubMed] [Google Scholar]
- 22.Wang C, Liu J, Luo F, Tan Y, Deng Z, & Hu QN (2014). Pairwise input neural network for target-ligand interaction prediction. In Bioinformatics and Biomedicine (BIBM), 2014 IEEE International Conference (67–70). [Google Scholar]
- 23.Weininger D (1988) SMILES 1. Introduction and encoding rules. J Chem Inf Comput Sci 28: 31–36. http://www.daylight.com. [Google Scholar]
- 24.Wishart D, Knox C, Guo A, Shrivastava S, Hassanali M, Stothard P, Chang Z, and Woolsey J (2006). Drugbank: a comprehensive resource for in silico drug discovery and exploration. Nucleic Acids Res, 34(Database issue):D668–72. [DOI] [PMC free article] [PubMed] [Google Scholar]


