

Abstract
The aim of our study was to compare the performance of ultrasonography (US) and dual-energy computed tomography (DECT) in detecting the crystal deposition at lower extremity joints in patients with gout. The correlation of imaging findings with microscopic findings was further assessed whenever aspiration is available.
We recruited consecutive patients who were presented with arthritis of lower extremity from January 2012 to December 2014. All the patients underwent DECT and US scan of bilateral knees, ankles, and feet. Synovial fluid was obtained by aspiration from an acute inflammatory joint if possible.
Finally, 60 patients fulfilling the 1977 gout classification criteria were included in our study. We found that US can detect significantly more patients with crystal deposition than DECT (81.7% vs 56.7%, by US and DECT, respectively, P < .001). The frequency of urate crystal deposition detected by US at MTP1, knee, and ankle joints regions was 56.7%, 63.3%, and 51.7%, respectively. The percentage of positivity of double contour sign on US was 33.3%, 48.3%, and 41.7% at the joints mentioned above, respectively. There was a good correlation between ultrasound and synovial fluid analysis in detecting crystal deposition (κ = 0.87, P = .001), while the agreement between DECT and synovial fluid analysis was just fair (κ = 0.28, P = .02).
The sensitivity of US in detecting urate crystal deposition in lower extremity joints was higher than DECT. The superiority was more obvious in knee and MTP1 joints. US should be considered as the first choice of image examinations when diagnosing gout.
Keywords: diagnosis, dual energy computed tomography, gout, synovial fluid analysis, ultrasonography
1. Introduction
The prevalence of gout is increasing in many countries, with the trend of younger population involvement. Gout is characterized by the deposition of monosodium urate monohydrate (MSU) crystals in various articular and periarticular tissues. The diagnosis of gout can be confirmed clinically in majority of patients because synovial fluid aspiration (SFA) is invasive and usually unfeasible. Moreover, the sensitivity of SFA is relatively low. New imaging techniques, such as ultrasonography (US) and dual-energy computed tomography (DECT), have been used more widely recently. They can provide additional information in the diagnosis of gout, particularly in patients with atypical manifestations and uncommonly affected regions.
US, a sensitive, convenient, and inexpensive imaging technique, can easily detect crystal deposition, synovitis, and bone erosion of the joints. Meanwhile, DECT can identify and color-code the MSU crystals to provide an overview of the crystal burden of the joint area.[1,2] Both these 2 techniques are noninvasive, and they were accepted widely and included in the new 2015 gout classification criteria developed by the American College of Rheumatology in collaboration with the European League Against Rheumatism.[3] These techniques have been considered to be important in diagnosing gout.
Few studies have compared US with DECT for the diagnosis of confirmed or suspected gout. Gruber et al found that the sensitivity of DECT and US in diagnosing gout was comparable.[4] However, DECT was shown to be less sensitive than US in another study.[5] With respect to the detection of MSU crystal deposition, DECT has been shown to be superior to US, particularly in the upper-limb joints, whereas no difference was found between the 2 methods in the lower extremities.[6] In a meta-analysis, both the pooled specificity and sensitivity of DECT were higher than those of US in identifying MSU deposition, even if both the double contour sign (DCS) and tophus are included in the US examination.[7] However, along with great improvement in the technique and equipment of US in recent years, the superiority of DECT in clinical practice is questioned. Moreover, whether different joint regions influence the efficacy of these 2 examinations remains unclear, particularly in the lower extremities that are most commonly affected in patients with gout.
In our study, we aimed to compare the performance of US and DECT in detecting crystal deposition at different joint regions in the lower extremity in patients who were clinically diagnosed with gout.
2. Materials and methods
2.1. Patients
In this cross-sectional study, we recruited consecutive patients with a clinical diagnosis of acute or chronic gout in Peking University First Hospital from January 2012 to December 2014. They were clinically diagnosed with primary gout based on the 1977 the American College of Rheumatology criteria.[8] All the patients underwent both US and DECT scans of the bilateral lower extremity, including 4 joint regions (first metatarsophalangeal joint [MTP]1, midfoot, ankle, and knee). The interval of US and DECT scan was <3 days. We attempted to obtain the synovial fluid to analyze uric acid crystals using polarization microscopy. Patients who were younger than 18 years, were pregnant or breastfeeding, had unavailable clinical data, had comorbid malignancy, or had other types of arthritis (including rheumatoid arthritis, psoriatic arthritis, osteoarthritis, chondrocalcinosis, and hydroxyapatite deposition), were excluded.
We collected the clinical data, including age, sex, body mass index, gout duration, serum uric acid (SUA) level, acute or chronic gout, and patient-reported concomitant disease, such as hypertension or diabetes. SFA using polarizing microscopy examination (Leica DM4500, Germany) was performed within minutes of sample acquisition. Two rheumatologists who were blinded to the clinical diagnosis and imaging examinations interpreted the SFA results.
This study was approved by the clinical research ethics committees of Peking University First Hospital. The research was conducted in accordance with the Declaration of Helsinki. The entire research scheme was explained in detail to each participant, and written informed consents were obtained.
2.2. Dual-energy computed tomography examination and radiation safety consideration
DECT was performed using a dual x-ray tube 128 detector row scanners (Somatom Definition Flash; Siemens Healthcare, Forchheim, Germany), using protocols previously described.[2] The tube potentials were 80 and 140 kV with an additional tin filter. The use of a different kV for each tube exploits the kV-dependent nature of CT numbers, allowing differentiation of materials with different effective atomic numbers. Postprocessing was performed using a commercial software program (“Gout,” Syngo CT Workplace, Siemens Medical Systems) to create material-selective images, where MSU deposits were coded as green. No contrast agent was used. The bilateral feet, ankle, and knee joints of each patient were scanned.
Two board-certified experienced radiologists (Yufeng Xu and He Wang), who were both blinded to the clinical diagnosis and US results, determined the presence of urate deposition and sites of urate deposition independently (Fig. 1A). The nail bed, skin, submillimeter, motion, and beam-hardening artifacts were excluded from the analysis and volume measurement (Fig. 2A). The presence of green voxels in the joint or periarticular structures of the index joint was classified as positive for the presence of MSU crystals. Of note, green pixilation in joint regions other than the index joint did not constitute a positive result for our analysis.
Figure 1.
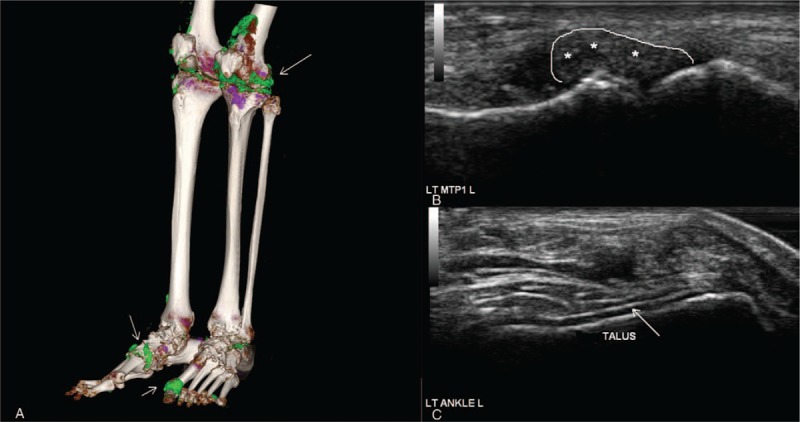
A 42-year-old male gout patient with urate crystal deposition in knees, ankles, and MTP1 joints, proved by polarization microscopy. (A) Three-dimensional reconstruction technique by DECT depicts urate crystal deposits (green color mapping, arrows) in the left MTP1 and bilateral knee joints, also around the extensor tendons of bilateral ankles. (B) Transversal and longitudinal scans of the left MTP1 joint confirmed the CT findings with intraarticular hyperechoic inhomogeneous material (asterisks). (C) Transversal and longitudinal scans of the left ankle joint confirmed the CT findings with double contour sign (arrows). Abnormal hyperechoic liner deposition was detected overlying talus. CT = computed tomography, DECT = dual-energy computed tomography, MTP = metatarsophalangeal joint.
Figure 2.
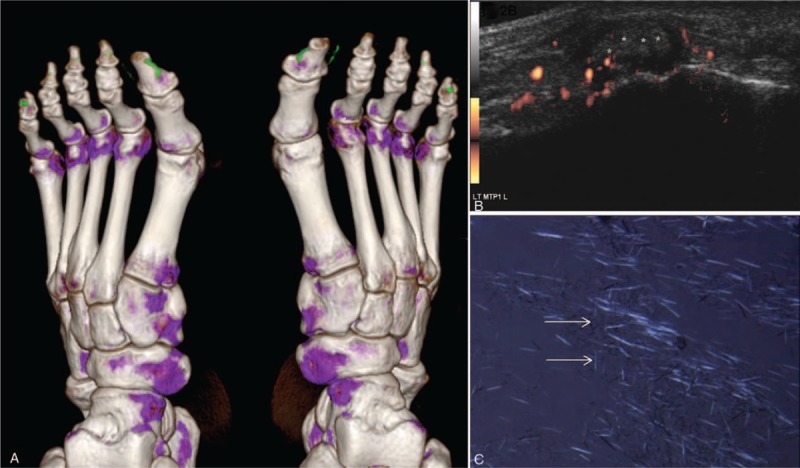
A 53-year-old male gout patient with urate crystal deposits proved by aspiration in the right MTP1 joint. (A) DECT depicts small false positive green deposits under the skin in three-dimensional volume-rendering reconstruction technique. Artifacts were seen in the nail of the bilateral 1st toes and 5th toes (asterisk). (B) A longitudinal-lateral US scan of the left MTP1 joint also showed the abnormalities (asterisks) including hyperechoic cloudy material. The power Doppler signals represent the hypervascularization caused by the acute inflammation. (C) Image of joint fluid containing MSU crystals obtained under a polarizing microscope (arrow). DECT = dual-energy computed tomography, MSU = monosodium urate monohydrate, MTP = metatarsophalangeal joint, US = ultrasonography.
The radiation dose of DECT scans for peripheral joints was optimized using phantom models in collaboration with our institution's medical physicist and was estimated to be no greater than that of the corresponding single energy CT scan. DECT's radiation dose was calculated to be 0.5 mSv per region scanned (e.g., 0.5 mSv for both feet and ankles). The total dose for all scanned peripheral joints in each patient ranged from 1 to 2 mSv, which is less than the average annual natural background radiation dose (2.4 mSv).[9]
2.3. US examination
Musculoskeletal US was performed using MyLab90 machine (Esaote, Genova, Italy) with 2 linear probes: LA435 (18–6 MHz) for the ankles and feet and LA523 (13–4 MHz) for the knees. All US scanning was performed by an experienced rheumatologist with more than 5 years of experience in maneuvering musculoskeletal US. All the images were reevaluated by another trained rheumatologist with 5 years of experience in musculoskeletal US. Both US rheumatologists were blinded to patient identity, clinical data, and DECT results.
The scan procedures were under the standardized guidelines published by Outcome Measures in Rheumatology.[10] The duration for scanning of each patient was more than 15 minutes. Pathologic findings, including DCS, tophi, and aggregates, were recorded. The definitions of the US elementary lesions based on the Outcome Measures in Rheumatology Clinical Trials US Gout Task Force were listed as following: DCS: abnormal hyperechoic band over the superficial margin of the articular hyaline cartilage, independent of the insonation angle, which may be either irregular or regular, or continuous or intermittent and can be distinguished from the cartilage interface sign; tophus (independent of location, e.g., extra-articular/intra-articular/intratendinous): a circumscribed, inhomogeneous, hyperechoic, and/or hypoechoic aggregation (which may or may not generate posterior acoustic shadow), which may be surrounded by a small anechoic rim; and aggregates (independent of location, e.g., intra-articular/intratendinous): heterogeneous hyperechoic foci that maintain their high degree of reflectivity even when the gain setting is minimized or the insonation angle is changed, which may occasionally generate posterior acoustic shadow.[11,12] Representative images were acquired and digitally saved.
The following joint regions were scanned by US: the knee (suprapatellar cyst, quadriceps tendon insertion, proximal and distal patellar tendon insertions, and femoral cartilage), ankle (tibiotalar joint, posterior tibial tendon, peroneus longus and brevis tendons, and Achilles tendon), midfoot (synovial membrane and hyaline cartilage), and all MTP joints (synovial membrane and hyaline cartilage). We classified the US examination findings as positive for gouty arthritis when tophus (Figs. 1B and 2B), DCS (Fig. 1C), or aggregates were seen.
2.4. Statistical analysis
Continuous measures were described as means, standard deviations, and percentiles. Categorical measures were summarized using frequencies and percentiles. Inter-reader agreement for assessment of urate crystal deposition using DECT or US was analyzed by calculating the intraclass correlation coefficient (ICC) and its 95% confidence interval (CI 95%). The McNemar test was used to analyze the positivity difference between DECT and US. The agreement between the different methods was measured by the Cohen κ coefficient; the κ coefficient and its corresponding 95% CI were interpreted. SFA was used as the standard reference method for calculating the sensitivity and specificity of US and DECT examinations. The Statistical Package for the Social Sciences (SPSS) V.17.0 was used to analyze collected data, with significance considered at 2-tailed P = .05.
3. Results
3.1. Patient characteristics
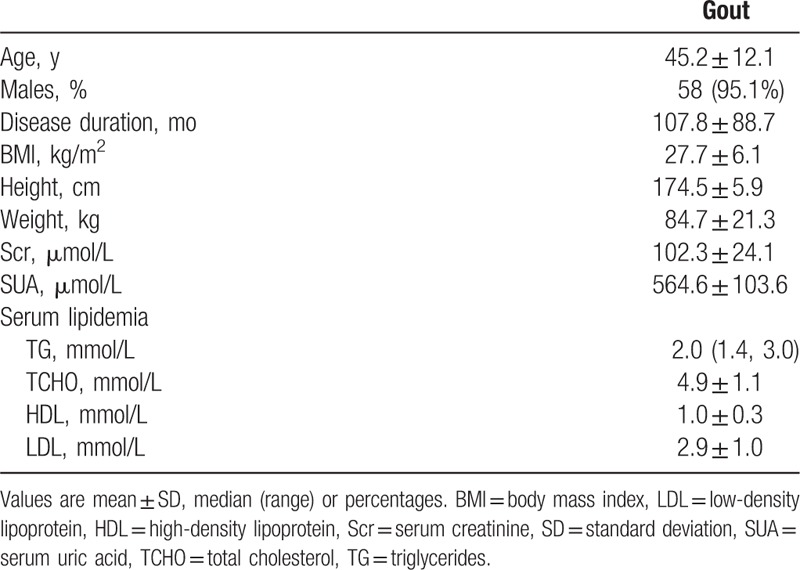
Sixty patients were recruited in our study. Their demographic features are shown in Table 1. Majority of patients were men. A history of hyperuricemia (SUA > 420 μmol/L) was found in 80.3% (49/60) of patients, and the mean uric acid level at recruitment (within 3 days of image examinations) was 564.6 ± 103.6 μmol/L. A previous diagnosis of gout in 46.7% (28/60) of patients was based on podagra (n = 20) or tophi (n = 8), and 53.3% (32/60) of patients were newly diagnosed with gout based on the 1977 criteria.[13] The disease duration was less than 2 years in 26.7% (16/60) of patients. At the time of diagnosis, 32/240 (13.3%) joint regions were affected. Acute gouty arthritis occurred in more than 3 joint regions in 58.3% (35/60) of patients; podagra was found in more than 2 joint regions in 15.0% (9/60) of patients; and acute gouty arthritis occurred in only 1 joint region in 16 (26.7%) of patients. Except 8 patients administered allopurinol, the other 52 patients were not administered any pharmacological urate-lowering treatment during evaluation.
Table 1.
The clinical features of 60 patients with gout.
3.2. Synovial fluid analysis
SFA was successfully performed in 33 (55.0%) patients. The presence of MSU crystals was confirmed using polarization microscopy in 29 (87.9%) patients (Fig. 2C).
3.3. DECT
Inter-reader agreement for the assessment of global urate deposition in the knees, ankles, midfoot, and MTP1 joints regions had an ICC of 0.99 (0.97–0.99).
Uric acid deposition was found in 34 (56.7%) patients by using DECT. Uric acid crystal deposition was found in the MTP1, knee, and ankle joints in 29 (48.3%), 28 (45.9%), and 26 (43.3%) patients, respectively. Uric acid deposition in 3, 2, and 1 joint region was found in 19 (55.9%), 5 (14.7%), and 10 (29.4%) patients, respectively.
3.4. US
The interobserver reliability of the US evaluation between the operators was tested, and the ICC was analyzed in all 60 patients with gout. The interobserver reliability for DCS and tophi was 0.986 (95% confidence interval [CI], 0.981–0.990) and 0.988 (95% CI, 0.983–0.991), respectively, indicating excellent reliability.
The US scan found characteristic changes in crystal deposition in 49 (81.7%) patients. The frequency of urate crystal deposition detected by US in the MTP1, knee, and ankle joints regions was 56.7%, 63.3%, and 51.7%, respectively. The most frequent US lesion was DCS, which was found in 29 (48.3%) patients, followed by tophi, which was positive in 20 (33.3%) patients. Aggregates in tendon were found in 5 (8.3%) patients.
The percentage of positive DCS on US was 33.3%, 48.3%, and 41.7% in the MTP1, knee, and ankle joint regions, respectively. Tophi were observed in 33.3%, 33.3%, and 21.7% in the MTP1, knee, and ankle joint regions, respectively, and the aggregates were found in 18.3%, 10.0%, and 13.3% in the MTP1, knee, and ankle joint regions, respectively.
3.5. Comparison of US and DECT in detecting crystal deposition
The 4 joint regions (knee, ankle, midfoot, and MTP joints) were screened by US and DECT in each patient, with 240 joint regions in total. The detection of positive crystal deposition by US and DECT is shown in Table 2.
Table 2.
Detection urate crystal deposition by ultrasound and DECT.
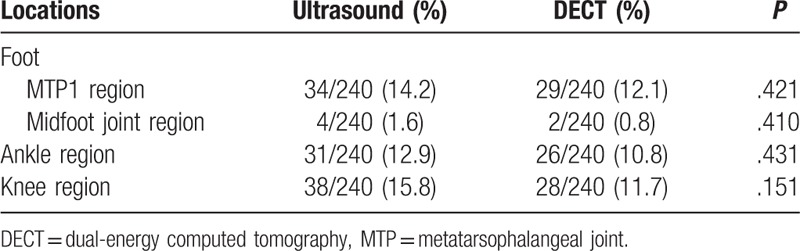
The overall positivity of crystal deposition detected by US in 49 (81.7%) patients was significantly higher than that by DECT in 34 (56.7%) patients (P < .001). However, at the joint level, although the percentage of positive crystal deposition in US was higher than that in DECT, the difference did not reach statistical significance (P = .05).
3.6. Agreement between US and DECT in detecting crystal deposition
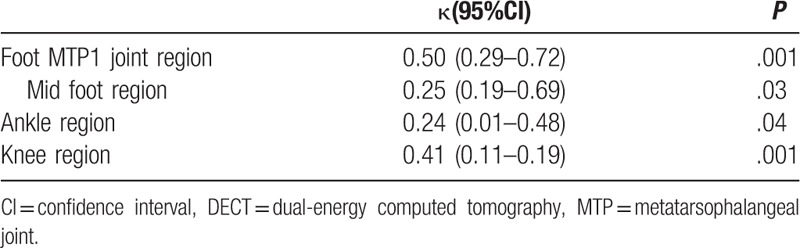
At the patient level, the consistency of detecting crystal deposition between US and DECT was poor (κ = .24, P = .03). At different joint levels, the agreement (κ value) between 2 examinations in the MTP, knee, midfoot, and ankle joint regions was 0.50, 0.41, 0.25, and 0.24, respectively (Table 3).
Table 3.
Agreement between ultrasound and DECT for detection of crystal deposition in gout patients (n = 60).
3.7. Sensitivity and specificity of US and DECT for crystal deposition detection
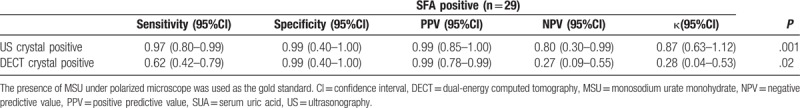
SFA was available in 33 (55.0%) patients in our study, and 29 of these patients with MSU under polarized microscope were used as the gold standard. The sensitivity and specificity of US and DECT in detecting crystal deposition are listed in Table 4. The specificity of both US and DECT was similar and quite high. However, US was noted to be more sensitive than DECT. The agreement between US and SFA was very good in detecting crystal deposition (κ = 0.87, P = .001), whereas the agreement between DECT and SFA was just fair (κ = 0.28, P = .02). If we combined the US and DECT image results (i.e., if either US or DECT showed crystal deposition in the patient), the agreement between images and SFA was the best (κ = 1.00, P = .001) for crystal deposition. Both the sensitivity and specificity were also very good.
Table 4.
The sensitivity and specificity of DECT and US for the crystal deposition detection compared to SFA.
3.8. Agreement of different US findings with DECT
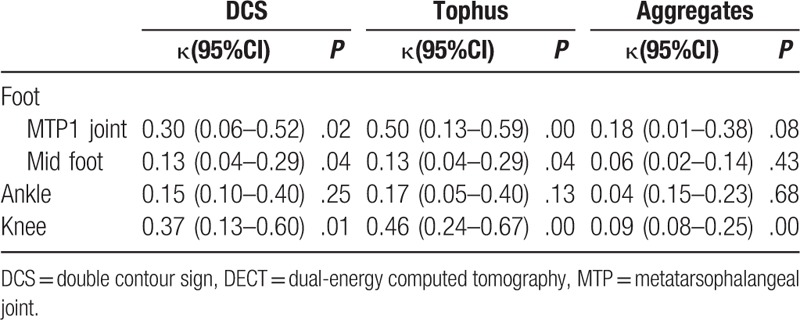
At the patient level, the correlation of tophus and DECT findings was good, with fair agreement (κ = 0.26, P = .05); both DCS and aggregates on US and DECT had poor agreement (κ = 0.18 and 0.07, for DCS and aggregates, respectively, P = .05).
At the joint region level, the best agreement between US and DECT findings was tophus in the MTP1 joint (κ = 0.50, P = .001). The consistency with respect to aggregate deposition between US and DECT was also poor (Table 5).
Table 5.
Agreement between ultrasound and DECT for detection of crystal deposition in gout patients (n = 60).
4. Discussion
For imaging evidence of urate deposition, US and DECT are the imaging modalities with sufficient published data and investigator experience to support their utility in accurate identification of urate deposition. However, previous studies have shown various results concerning the diagnostic accuracy of each imaging modality.[7] This is a cross-sectional study aimed to demonstrate which imaging test was better in detecting MSU deposition in patients with gout.
Synovial fluid analysis to identify MSU crystals in is the gold standard for diagnosing gout. However, even in specialized centers, aspiration is not always available or successful. Microscopy may miss gout crystals in 25% of successfully aspirated joints.[14] Sometimes, tophi are in the soft tissue or next to the femoral condyles, and their presence may not be related to the aspirated effusion. Hence, imaging is important to confirm the diagnosis, particularly when the diagnosis of the patients was not supported by microscopy. In our study, in the SF-positive group, US had higher sensitivity (97%) than DECT but had the same specificity (99%) as DECT. Moreover, the agreement of combined US/DECT and SFA was very good for positive crystal deposition. Considering the advantages of US, such as being more convenient and affordable with lesser radiation compared with DECT, US could be the first choice for the diagnosis method of gout in daily practice.
Gout could involve several joints and soft tissues, occurring most frequently in the lower extremities. Previous studies only assessed the unilateral or symptomatic joints.[4,15] However, urate crystal deposition has been reported to be seen in nonacute gout in joint areas.[16] In our study, we prospectively selected the typical regions in the bilateral lower extremities, including the knees, ankles, and feet, for evaluation. It can eliminate the effect of uncertainty of gout history. Our study showed that US can detect more crystal depositions than DECT, and the consistency was moderate only in MTP1 and knee joints. In a prospective case–control study, Naredo et al recently confirmed the importance of looking for DCS in the MTP1 and femoral joints.[17] In a meta-analysis, DCS or tophus points more toward gout, particularly in the MTP1 joint.[18]
A wide range of sensitivity (19%–92%), with very high specificity (72%–100%), for US-detected intra-articular tophi and cartilage DCS in diagnosing gout has been reported in the literature.[7,17,19–22] In a meta-analysis, the sensitivity and specificity of DCS in US were 83% and 76%, respectively, whereas the tophus detected using US had the sensitivity and specificity of 65% and 80%, respectively.[7] A recent multicenter study showed that the sensitivity and specificity for the presence of DCS, tophus, or “snowstorm” appearance were 77% and 84%, respectively.[23] The experience of the sonographer and the gold standard for gout diagnosis are the key in detecting crystal deposition. The different study design and methodology (disease duration, joints assessment, blinding, and treatment) of the previous studies should also be noted, making comparison of the results difficult. In our study, the US examiner was a highly experienced rheumatologist in musculoskeletal US; hence, this may be the reason that the sensitivity of US was high (97%) in our study. Moreover, uric acid crystals can more easily deposit on the knee and MTP1 joints, which have a more cartilaginous area. These joints are also more superficial for scanning. This may be the reason for the relatively high positive crystal deposition on US scan in these joints. Similar results have been found in a previous study. The authors found that the knee and MTP1 joints were the anatomic locations most frequently involved in synovial and cartilage US abnormalities in patients with gout.[17]
In our study, DECT was less sensitive than US either at the patient or joint level. Furthermore, the sensitivity of DECT was lower than that suggested by previous results (78%–100%).[2,24,25] First, artifacts in DECT are very common, such as nail bed, submillimeter, skin, motion, beam hardening, and vascular artifacts. These should not be interpreted as DECT evidence of urate deposition.[26] Second, 20% of patients with early disease did not demonstrate evidence of MSU deposition on DECT.[25] In our study, 26.7% (16/60) of patients had a disease duration of less than 2 years. Third, DECT seems to have a high sensitivity (97.9%) in patients with acute gout within 15 days.[15] However, only 13.3% (32/240) of joint regions in our study had active arthritis. During the gout remission period, crystal deposition may not be easily detected. Similarly, in a newly published study, Pascart et al found that several tophi on the MTP1 joints were missed by DECT, which can only identify large tophi (0.3-mm resolution threshold), and reported that DECT only measured the crystal content of the tophus, whereas US measured the whole volume; however, they did not provide the same quantitative assessment of urate burden in the feet and knees.[27] All these factors may contribute to the lower sensitivity of DECT for crystal deposition. Furthermore, DECT may miss crystal deposition on the surface of the cartilage, which is the most frequent US manifestation (DCS) in our patients. Thus, in our study, US was superior to DECT in screening crystal deposition. When DECT was combined with US, the agreement between images and SFA for crystal deposition was very good; hence, DECT may not be used as a routine examination in the diagnosis of gout, but it might be useful for patients with ambivalent findings, particularly in those patients with negative joint aspiration and US scan findings.
We are aware of some limitations of our study. Only 55% (33/60) of patients had SFA. We cannot extend all the patients to test the sensitivity and specificity of DECT and US comparing to SFA. However, the study population represents a real-world population in our clinical practice. Furthermore, the limited number of patients recruited in this study prompts conducting further multicenter studies in a larger population to confirm our results.
5. Conclusion
US may be used as the first choice of imaging examination to detect MSU crystal deposition, with higher sensitivity and comparable specificity than DECT, particularly in the knee and MTP1 joints.
5.1. Key points
US is a promising method for the detection of crystal deposits in gouty arthritis.
US can be considered as the first choice of imaging techniques in diagnosing gout.
Author contributions
Yu Wang and Xuerong Deng contributed equally to the work. They are listed in the cofirst authors.
Yu Wang and Xuerong Deng accept full responsibility for the work and the conduct of the study, had access to the data and controlled the decision to publish. Yan Geng help to collect the clinical data.
Xuerong Deng performed the US scan, and Lanlan Ji was the rheumatologist who independently made the US image judgement.
Yufeng Xu and He Wang analyzed the DECT scans.
All authors contributed to manuscript revisions and approved the final manuscript.
Data curation: Yu Wang.
Formal analysis: Yu Wang.
Investigation: Yu Wang, Yufeng Xu.
Project administration: Yu Wang.
Resources: Yu Wang, Xuerong Deng.
Software: Yu Wang, Yufeng Xu.
Supervision: Yu Wang, Zhuoli Zhang.
Validation: Yu Wang.
Writing – original draft: Yu Wang, Lanlan Ji.
Writing – review & editing: Yu Wang, Zhuoli Zhang.
Methodology: Xuerong Deng, Yufeng Xu, Lanlan Ji.
Footnotes
Abbreviations: DCS = double contour sign, DECT = dual-energy computed tomography, ICC = intraclass correlation coefficient, MSU = monosodium urate monohydrate, MTP = metatarsophalangeal joint, SFA = synovial fluid aspiration, SUA = serum uric acid, US = ultrasonography.
YW and XD contributed equally to this study.
Patient consent Obtained.
Ethics approval Health and Disability Ethics Committee of Peking University First Hospital (No. 2014685).
Funding\support: This project was funded by the Research Foundation of Peking University First Hospital.
The authors have no conflicts of interest to disclose.
References
- [1].Choi HK, Burns LC, Shojania K, et al. Dual energy CT in gout: a prospective validation study. Ann Rheum Dis 2012;71:1466–71. [DOI] [PubMed] [Google Scholar]
- [2].Dalbeth N, Choi HK. Dual-energy computed tomography for gout diagnosis and management. Curr Rheumatol Rep 2013;15:301. [DOI] [PubMed] [Google Scholar]
- [3].Neogi T, Jansen TL, Dalbeth N, et al. 2015 Gout classification criteria: an American College of Rheumatology/European League Against Rheumatism collaborative initiative. Ann Rheum Dis 2015;74:1789–98. [DOI] [PMC free article] [PubMed] [Google Scholar]
- [4].Gruber M, Bodner G, Rath E, et al. Dual-energy computed tomography compared with ultrasound in the diagnosis of gout. Rheumatology (Oxford) 2014;53:173–9. [DOI] [PubMed] [Google Scholar]
- [5].Huppertz A, Hermann KG, Diekhoff T, et al. Systemic staging for urate crystal deposits with dual-energy CT and ultrasound in patients with suspected gout. Rheumatol Int 2014;34:763–71. [DOI] [PubMed] [Google Scholar]
- [6].Zhu L, Wu H, Wu X, et al. Comparison between dual-energy computed tomography and ultrasound in the diagnosis of gout of various joints. Acad Radiol 2015;22:1497–502. [DOI] [PubMed] [Google Scholar]
- [7].Ogdie A, Taylor WJ, Weatherall M, et al. Imaging modalities for the classification of gout: systematic literature review and meta-analysis. Ann Rheum Dis 2015;74:1868–74. [DOI] [PMC free article] [PubMed] [Google Scholar]
- [8].Wallace SL, Robinson H, Masi AT, et al. Preliminary criteria for the classification of the acute arthritis of primary gout. Arthritis Rheum 1977;20:895–900. [DOI] [PubMed] [Google Scholar]
- [9].Report of the United Nations Scientific Committee on the Effects of Atomic Radiation to the General Assembly, 2000. http://www.unscear.org/docs/reports/gareport.pdf. (Accessed August 4, 2008). [Google Scholar]
- [10].Backhaus M, Burmester GR, Gerber T, et al. Guidelines for musculoskeletal ultrasound in rheumatology. Ann Rheum Dis 2001;60:641–9. [DOI] [PMC free article] [PubMed] [Google Scholar]
- [11].Terslev L, Gutierrez M, Christensen R, et al. Assessing elementary lesions in gout by ultrasound: results of an OMERACT patient-based agreement and reliability exercise. J Rheumatol 2015;42:2149–54. [DOI] [PubMed] [Google Scholar]
- [12].Gutierrez M, Schmidt WA, Thiele RG, et al. International Consensus for ultrasound lesions in gout: results of Delphi process and web-reliability exercise. Rheumatology (Oxford) 2015;54:1797–805. [DOI] [PubMed] [Google Scholar]
- [13].Janssens HJ, Fransen J, van de Lisdonk EH, et al. A diagnostic rule for acute gouty arthritis in primary care without joint fluid analysis. Arch Intern Med 2010;170:1120–6. [DOI] [PubMed] [Google Scholar]
- [14].Swan A AH, Dieppe P. The value of synovial fluid assays in the diagnosis of joint disease: a literature survey. Ann Rheum Dis 2002;493–8. [DOI] [PMC free article] [PubMed] [Google Scholar]
- [15].Wu H, Xue J, Ye L, et al. The application of dual-energy computed tomography in the diagnosis of acute gouty arthritis. Clin Rheumatol 2014;33:975–9. [DOI] [PubMed] [Google Scholar]
- [16].Dalbeth N, House ME, Aati O, et al. Urate crystal deposition in asymptomatic hyperuricaemia and symptomatic gout: a dual energy CT study. Ann Rheum Dis 2015;74:908–11. [DOI] [PubMed] [Google Scholar]
- [17].Naredo E, Uson J, Jimenez-Palop M, et al. Ultrasound-detected musculoskeletal urate crystal deposition: which joints and what findings should be assessed for diagnosing gout. Ann Rheum Dis 2014;73:1522–8. [DOI] [PubMed] [Google Scholar]
- [18].Mathieu S, Pereira B, Couderc M, et al. uselulness of US in diagnose gout. Ann Rheu Dis 2013;10:e23. [DOI] [PubMed] [Google Scholar]
- [19].Wright SA, Filippucci E, McVeigh C, et al. High-resolution ultrasonography of the first metatarsal phalangeal joint in gout: a controlled study. Ann Rheum Dis 2007;66:859–64. [DOI] [PMC free article] [PubMed] [Google Scholar]
- [20].Thiele RG, Schlesinger N. Diagnosis of gout by ultrasound. Rheumatology (Oxford) 2007;46:1116–21. [DOI] [PubMed] [Google Scholar]
- [21].Filippucci E, Riveros MG, Georgescu D, et al. Hyaline cartilage involvement in patients with gout and calcium pyrophosphate deposition disease. An ultrasound study. Osteoarthritis Cartilage 2009;17:178–81. [DOI] [PubMed] [Google Scholar]
- [22].Ottaviani S, Richette P, Allard A, et al. Ultrasonography in gout: a case-control study. Clin Exp Rheumatol 2012;30:499–504. [PubMed] [Google Scholar]
- [23].Ogdie A, Taylor WJ, Neogi T, et al. Performance of ultrasound in the diagnosis of gout in a multi-center study: comparison with monosodium urate crystal analysis as the gold standard. Arthritis Rheumatol 2017;69:429–38. [DOI] [PMC free article] [PubMed] [Google Scholar]
- [24].Glazebrook KN, Guimaraes LS, Murthy NS, et al. Identification of intraarticular and periarticular uric acid crystals with dual-energy CT: initial evaluation. Radiology 2011;261:516–24. [DOI] [PubMed] [Google Scholar]
- [25].Bongartz T, Glazebrook KN, Kavros SJ, et al. Dual-energy CT for the diagnosis of gout: an accuracy and diagnostic yield study. Ann Rheum Dis 2015;74:1072–7. [DOI] [PMC free article] [PubMed] [Google Scholar]
- [26].Mallinson PI, Coupal T, Reisinger C, et al. Artifacts in dual-energy CT gout protocol: a review of 50 suspected cases with an artifact identification guide. AJR Am J Roentgenol 2014;203:W103–9. [DOI] [PubMed] [Google Scholar]
- [27].Pascart T, Grandjean A, Norberciak L, et al. Ultrasonography and dual-energy computed tomography provide different quantification of urate burden in gout: results from a cross-sectional study. Arthritis Res Ther 2017;19:171–8. [DOI] [PMC free article] [PubMed] [Google Scholar]