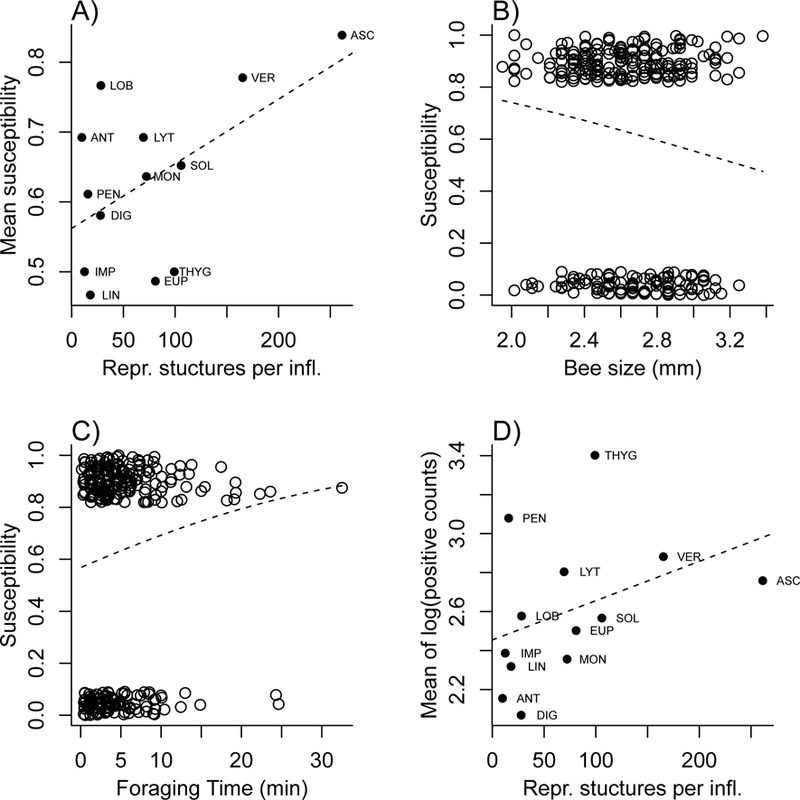
Fig. 2.

Relationships between traits and components of pathogen transmission that were statistically significant in the transmission trials using 14 plant species. A) Mean susceptibility (over all trials using a particular species) versus reproductive structures per inflorescence (estimated mean for the species). B), C) Susceptibility in each trial irrespective of flower species (0=not infected, 1=infected; values jittered to separate points) as a function of B) bee size, estimated by the length of the wing radial cell, and C) total time foraging by the bee. D) Mean intensity (mean of all log-transformed positive pathogen cell counts for each species) as a function of reproductive structures per inflorescence (estimated mean for the species). The dashed lines in each panel are regressions fitted to the plotted points (linear regression in panels A and D, logistic regression in B and C). Figure generated by R script SusceptibilityAndIntensityPlots.R; Dryad repository.
