Nucleic Acids Research, gky684, https://doi.org/10.1093/nar/gky684
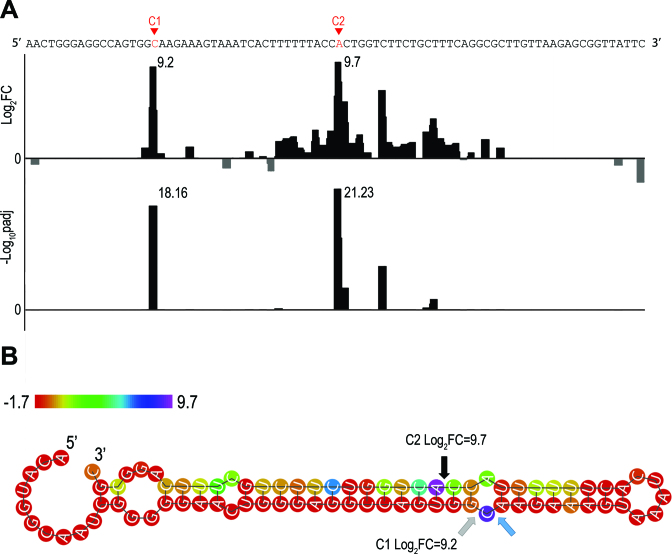
In the version of this article originally published online, the authors would like to clarify a mistake with one of the figures. In Figure 2A the presented tracks were mistakenly switched, and they did not match the titles of the y-axes. The correct Figure 2A is shown below and has now been corrected online.
Figure 2.
Example of cleavage site detection within arfA, a known RNase III target (24). (A). Results of the DESeq2 analysis comparing wt and rnc-14 read start counts along the arfA transcript. Shown are the DESeq2 log2 values of the fold change (FC) in read start counts between wt and rnc-14 (Log2FC, upper panel) and the DESeq2 adjusted pvalue for multiple hypotheses testing expressed as -log10, (-Log10padj, lower panel). (B) Secondary structure prediction of arfA transcript. Arrows designate the cleavage sites detected here and by Garza-Sanchez et al. (24): Gray—detected only in our study, blue—detected only by Garza-Sanchez et al. (24) and black—detected in both studies. The two cleavage sites detected in our study determine a structural distance of 2 positions, corresponding to dangling ends of 2 nt on both strands. Nucleotide color indicates the log2FC value. Note that C1 and C2 designate the cleavage sites (Panel B) as well as the positions downstream to the cleavage sites (Panel A).


