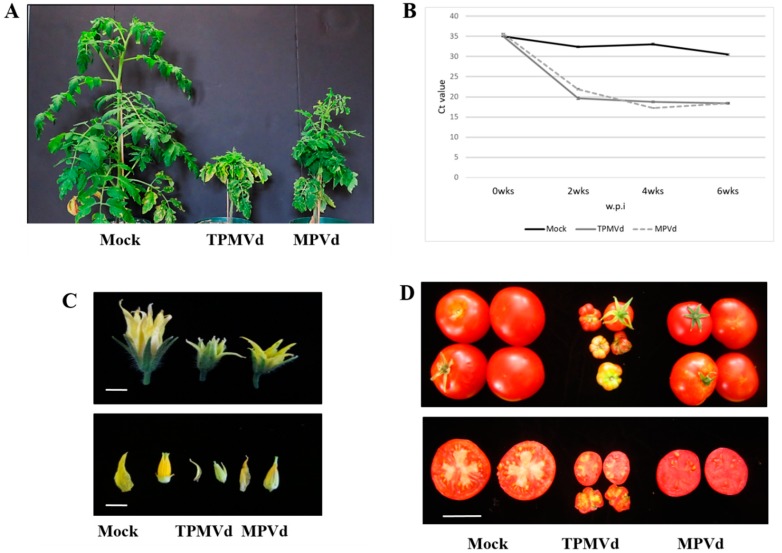
Figure 1.
Phenotypes of mock-inoculated and viroid-infected Rutgers tomato plants. (A) Tomato plants displaying symptoms of TPMVd and MPVd infection six weeks’ post-inoculation compared to mock-inoculated plants. (B) Time course comparison of TPMVd and MPVd-infected vs. mock-inoculated tomato plants. Quantitative reverse transcription-polymerase chain reaction (qRT-PCR) detection (Ct values) using pospiviroid primers during three infection stages as described in Material and Methods. Early infection, 1-2 wpi, middle infection at 4 wpi, and late infection at 6 wpi. (C) Comparative size of flowers from mock-inoculated, TPMVd-, and MPVd-inoculated tomato plants (upper) and sepals and carpels dissected from the flowers (lower). Bars = 1 cm. (D) Mature fruits of mock-inoculated plants compared to plants inoculated with TPMVd and MPVd (upper) and cross-sections of mature fruits showing reduced locule number and numbers of seeds in viroid-infected versus mock-inoculated fruit (lower). Bar = 6 cm.

