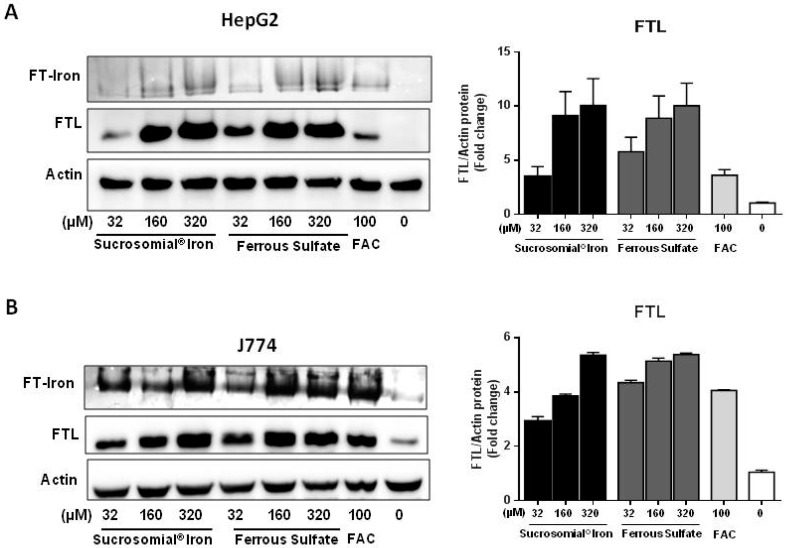
Figure 1.
Sucrosomial® Iron and Ferrous Sulfate are absorbed by HepG2 and J774 cells. HepG2 (A) and J774 (B) cells were treated with increasing concentrations of Sucrosomial® Iron, Ferrous Sulfate and with 100 μM ferric ammonium citrate (FAC) for 16 h, and then the homogenates run on denaturing PAGE for ferritin (FTL) and nondenaturing PAGE for ferritin iron (FT-Iron) evaluation. For ferritin iron content (FT-iron) a representative image of Prussian blue stain plus DAB enhancement is shown for HepG2 (A top) and for J774 (B top). The expression of l-ferritin (FTL) was analyzed in Western blotting in HepG2 (A bottom) and J774 (B bottom) and the densitometry was performed using ImageJ. The values (N = 3) were normalized to actin.

