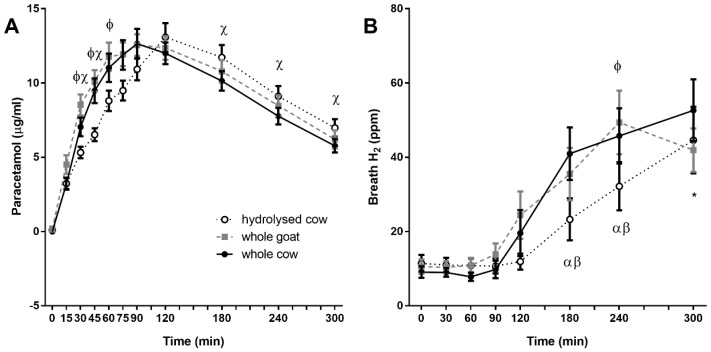
Figure 4.
Postprandial plasma paracetamol (A) and breath hydrogen (B) responses. Values represent means ± SEM in μg/mL (A) and ppm (B). There was a time × treatment interaction for postprandial plasma paracetamol concentrations (p < 0.001) and breath hydrogen (p < 0.05). Φ denotes statistical significance p < 0.05 between whole goat (WG; ■) and hydrolysed cow (HC; ○) fortified milks; χ p < 0.05 between whole cow (WC; ●) and HC fortified milk; α p < 0.05 from baseline for WC fortified milk; β p < 0.05 from baseline for WG fortified milk; * p < 0.05 from baseline all fortified milks (Sidak corrected post hoc tests).

