Abstract
Purpose
Correctly classifying progression in moderate to advanced glaucoma is difficult. Pointwise visual field test–retest variability is high for sensitivities below approximately 20 dB; hence, reliably detecting progression requires many test repeats. We developed a testing approach that does not attempt to threshold accurately in areas with high variability, but instead expends presentations increasing spatial fidelity.
Methods
Our visual field procedure Australian Reduced Range Extended Spatial Test (ARREST; a variant of the Bayesian procedure Zippy Estimation by Sequential Testing [ZEST]) applies the following approach: once a location has an estimated sensitivity of <17 dB (a “defect”), it is checked that it is not an absolute defect (<0 dB, “blind”). Saved presentations are used to test extra locations that are located near the defect. Visual field deterioration events are either: (1) decreasing in the range of 40 to 17 dB, (2) decreasing from >17 dB to “defect”, or (3) “defect” to blind. To test this approach we used an empirical database of progressing moderate-advanced 24-2 visual fields (121 eyes) that we “reverse engineered” to create visual field series that progressed from normal to the end observed field. ARREST and ZEST were run on these fields with test accuracy, presentation time, and ability to detect progression compared.
Results
With specificity for detecting progression matched at 95%, ZEST and ARREST showed similar sensitivity for detecting progression. However, ARREST used approximately 25% to 40% fewer test presentations to achieve this result in advanced visual field damage. ARREST spatially defined the visual field deficit with greater precision than ZEST due to the addition of non–24-2 locations.
Conclusions
Spending time trying to accurately measure visual field locations that have high variability is not productive. Our simulations indicate that giving up attempting to quantify size III white-on-white sensitivities below 17 dB and using the presentations saved to test extra locations should better describe progression in moderate-to-advanced glaucoma in shorter time.
Translational Relevance
ARREST is a new visual field test algorithm that provides better spatial definition of visual field defects in faster test time than current procedures. This outcome is achieved by substituting inaccurate quantification of sensitivities <17 dB with new spatial locations.
Keywords: perimetry, algorithm, visual field progression, spatial visual field loss
Introduction
Detection of progressive vision loss by analyzing visual field data collected using Goldmann Size III white-on-white targets (typically referred to as Standard Automated Perimetry [SAP]) is the main tool used by clinicians and researchers to monitor visual function of people with glaucoma. It also is a main outcome measure of clinical trials for potential glaucoma treatments (recent review1). The lack of sensitivity of a single SAP test for detection of a decrease in vision, however, requires that either the tests be repeated multiple times to reliably detect a change, or the supplementation of visual field data with other data, such as estimates of changes to anatomic structures derived from optical coherence tomography or other clinical observations.
Currently, the approach to detection of visual field deterioration is to use the same SAP test procedure, including a fixed spatial matrix of locations to be tested, at every patient visit. This produces a measure of visual sensitivity at many locations in the visual field, and then one looks for decreases in these numbers over time. We refer to this method as the one-test-fits-all testing strategy, and it has a Measurement phase, where matrices of visual sensitivities are collected, and an Analysis phase, where the matrices are analyzed for change over time. This approach has been the dominant paradigm of testing since the introduction of automated perimetry; thus, over the last few decades, considerable effort has been spent trying to improve the Measurement2–9 and Analysis10–13 phases. We will not consider the Analysis phase, assuming that improving the Measurement phase will benefit any new or existing analysis technique by supplying more precise and accurate data.
Evidence is emerging that suggests it is not possible to make any further major improvements in the ability of the one-test-fits-all test strategy to detect glaucomatous progression. In a previous study, we showed that short SAP procedures at a single location are inherently variable and that the magnitude of improvement required to reduce the time taken to detect progression, to a clinically meaningful extent, cannot be realized without a change in test stimulus or significant change to approach.14 Our study found that only by changing stimuli away from standard Size III white-on-white targets will the numbers measuring visual sensitivity exhibit reduced variability and, hence, be more useful to later analysis. This is supported by empirical evidence gathered by several investigators using perimetry data collected with stimuli that are larger than Size III.15,16 For example, Wall et al.15 show that using Size V white-on-white targets reduces variability for locations with 10–20 dB sensitivity loss. Similarly, data collected with the Humphrey Matrix perimeter (Carl Zeiss Meditec, Dublin, CA), which uses 4° patches of flickering sinusoidal gratings, shows lower variability than Size III targets for sensitivities below approximately 20 dB.17 These larger targets potentially allow more precise tracking of changes to deficit depth at single locations, but do not permit precise tracking of spatial change in visual field sensitivity, for example, the area of spread of small scotoma in the macular region. We explored a different tradeoff: we retained Size III white-on-white SAP targets, but abandoned testing at levels where visual sensitivity is known to be highly variable to add spatial information to the test.
Recently, Gardiner et al.18 showed evidence that reliable visual thresholds at a single location often cannot be measured with short SAP procedures when vision falls to approximately <20 dB.18 This seems to agree with the long-acknowledged fact that the test–retest variability of a SAP measurement dramatically increases when vision decreases below these levels.19,20 These three studies, therefore, suggest that it is unlikely that precision improvements can be made to the Measurement phase of the one-test-fits-all strategy, particularly when visual sensitivity is approximately <20 dB.
All of this evidence suggests that, if we are to continue using short SAP procedures, we should be seeking methods of detecting decreases in vision using a strategy other than the one-test-fits-all approach, particularly for moderate to advanced glaucoma, where SAP is known to be very variable. In this paper, we introduce a strategy that adds test locations at follow-up visits of a patient to detect spatial spreading of scotoma, rather than relying on a fixed matrix of visual field test locations. To achieve this, and yet keep clinical testing time to a minimum, we censor data <17 dB into two bins (blind, and damaged but not yet blind). We do not fully threshold these locations, consistent with recent evidence that censoring data in this range does not alter the ability to detect progression in existing visual field datasets, determined using either global indices or on a pointwise basis.21,22 We demonstrate that this new approach allows more complete visualization of the spatial nature of progressing visual field loss in glaucoma, without sacrificing specificity, and with an improvement in test time.
Methods
In this study, we compared our new visual field testing algorithm, the Australian Reduced Range Extended Spatial Test (ARREST), to a standard one-test-fits-all strategy using the 24-2 pattern (Humphrey Field Analyzer [HFA], Carl Zeiss Meditec) using input data derived from 121 patients with visual field progression. We describe the standard comparison procedure, ARREST, and the data used in the following sections.
Comparison Procedure: 24-2 Visual Field Measurement (ZEST)23
We used a ZEST procedure with a fixed bimodal prior over the domain −5 to 40 dB (see Appendix) for all locations as described in several of our previous papers3,7 and as implemented in the Open Perimetry Interface (OPI).24 The procedure typically requires a median of four presentations to obtain a measurement on a location with a visual sensitivity >25 dB, with a minimum of three presentations. The Appendix gives precise details to allow reproduction of the procedure.
ARREST Procedure
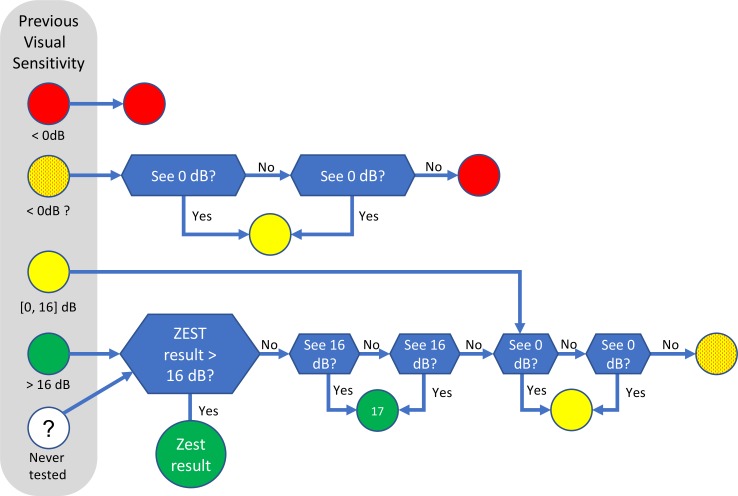
The major difference between ARREST and existing perimetric procedures is that it does not attempt to measure an accurate visual sensitivity <17 dB (hence, “reduced range” [RR], in the name). Instead, new locations are tested as described below. For the first time a patient is tested, ARREST uses a baseline ZEST procedure, which is the same as the ZEST already described above. When the measured visual sensitivity for a location falls below 17 dB, the location is flagged as “yellow,” and ZEST is no longer used on that location in future tests. The only assessment of the location in future tests is whether it is blind (“red,” unable to see the 0 dB stimulus) or not, which is achieved by showing 0 dB stimuli at that location. Figure 1 shows the actions that are taken for a location depending on the previous visual sensitivity measured at that location. Note that the cutoff value of 16 dB is somewhat arbitrary, and perhaps even conservative as there is some evidence that using any values up to 19 dB might be appropriate.18,21,22
Figure 1.
Actions taken for an individual location based on its previous measured visual sensitivity in the ARREST procedure. Green indicates that the measured visual sensitivity is not ≤16 dB; yellow, in the range 0 to 16 dB; yellow-with-red-dots, in the range 0 to 16 dB but 0 dB has not been seen at least once in the previous test; red, unable to see 0 dB. The white circle indicates that there is no previous visual sensitivity measured for this location. Blue decision boxes indicate that presentations are made and responses gathered.
Given that ARREST does not use more than two presentations to test a location that is “yellow” (0–16 dB), a visual field with damaged locations will be quicker to test than with existing methods that try to determine a visual sensitivity for these locations. It is well established that thresholds returned for such damaged locations are highly variable18–20 and that current test procedures often require more than 10 presentations before reaching their termination criteria in such areas.6,25 ARREST chooses to use these saved presentations to test locations adjacent to the yellow location. This is the fundamental intuition underlying ARREST: we have forgone trying to detect small changes in the yellow location, as any measure obtained is so variable that this often is not possible, in return for testing and monitoring neighboring locations that are still >16 dB. The presentations we save by reducing fidelity in the visual sensitivity measure in the yellow range are spent to improve spatial resolution of the field measurement.
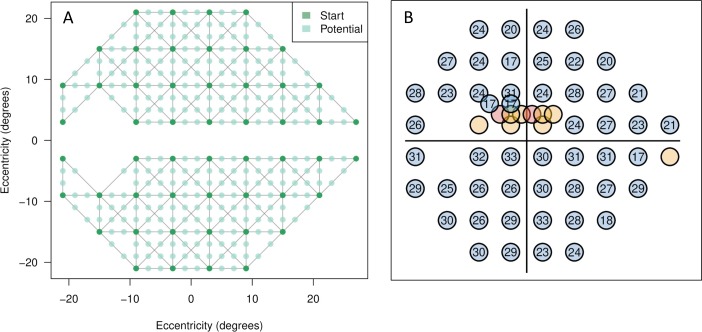
At the beginning of an ARREST test, an estimate of the number of presentations required to complete the test is made based on the previous test, assuming (conservatively) 10 presentations for a green location, 2 for a yellow location, 1 for a yellow-red location, and zero for a red location. While this total number of expected presentations is less than some number (we used 250 in this study), new locations are added to the set of locations to test, assuming 10 presentations for each. Locations that are added are spatially connected to a yellow location by an input graph. In this study, we defined the graph simply using nearest neighbors on a rectangular grid with 2° spacing (Fig. 2A). To choose a new location near a yellow location, we selected the edge leading out of the yellow location that is connected to the location with the highest measured visual sensitivity, and selected randomly from the unmeasured locations along that edge. For example, in Figure 2, one “Start” location might be yellow, and so we looked for the highest neighboring “Start” location that is green, and chose one of the “Potential” locations that are in between the two lying on the gray line (or edge). Using the graph in Figure 2, this led to selection of locations in a similar way to the heuristic used in the GOANNA procedure of Chong et al.,3,26 where the midpoint of the highest gradient among pairs of tested locations is chosen, but, unlike GOANNA, in ARREST once a location is added, it remains in the field for all future tests. Once the pool of locations is chosen, they are tested using the logic of Figure 1.
Figure 2.
(A) The Start locations (dark green) and Potential new locations (light green) used in the ARREST procedure. Gray lines (“edges”) between dark green locations indicate neighbor relations. (B) An example of a resultant visual field that may arise after the addition of extra test locations. A more complete description of this specific case example is shown in Figure 9.
Data
To compare the accuracy, sensitivity, and specificity of the comparison method and ARREST, we needed sequences of ground truth visual fields. Taking measured fields as ground truth (for example, a database of HFA 24-2 fields) can be problematic as variability in the measured values means that they do not accurately represent the patient's true visual sensitivity values. In these empirically measured databases, there is no way to tell if change is due to disease or measurement error. On the other hand, constructing an artificial series of visual fields ensures that the ground truth of progression or stability is known, but it may not accurately represent patterns or rates of field loss that would be observed in practice.
We took a hybrid approach, constructing an artificial field series based on a database of HFA 24-2 visual fields collected on 121 eyes from 78 patients (open-angle glaucoma) who performed perimetry every 6 months over a 5-year period at the Lions Eye Institute, Australia. The included data were a subset of the 155 eyes from 78 patients reported by An et al.,27 who also reported the full clinical inclusion criteria. Specifically, we included those eyes where at least one location in the visual field showed progression using pointwise linear regression over the 5-year test duration (slope < −1 dB/year, P < 0.01). For each patient, linear regression was performed on each location in the HFA fields over all visits to obtain an indicative dB-per-visit amount of change for that location. If this dB-per-visit was larger than zero (an improvement in visual sensitivity at that location), it was set to zero. Then, the final field was taken as measured, and previous fields back-calculated by adding the dB-per-visit amount to each location until the Total Deviation (TD; as reported by the HFA) of the location was zero. This resulted in a sequence of progressing visual fields where some locations were progressing at faster rates than others (and some were not progressing), in a spatial pattern consistent with observed HFA 24-2 fields as at the final visit. This approach removed measurement variability from the sequence of fields, and preserved realistic spatial patterns of progression as observed in the real data set. The final HFA 24-2 visual fields in the dataset had an average mean deviation (MD) of −6.79 dB (range, −21.84 to −0.80 dB) and pattern standard deviation of 6.99 dB (range, 1.31–13.51 dB).
We used this approach to create a synthetic data set, labeled PROG, with 121 eyes, and a median number of visual field results per participant of 23 (mean, 24.7, standard deviation [SD] 12.0). The mean visual sensitivity loss between the final visual field and the first (by definition normal) visual field over all eyes was −7.2 dB (SD 5.4 dB). To have values from spatial locations not on the 24-2 grid, we interpolated each field using Natural Neighbor interpolation28 (see Appendix for an example). This synthetic data set was used as the “ground truth” as input to our computer simulation to evaluate the performance of ARREST.
We also created two series of stable visual fields to allow computation of specificity of the procedures. The first, STABLE-0, was the first field in all 121 eyes of PROG repeated 5 times. The second, STABLE-6, was the first field that had a mean TD of less than −6 dB in each sequence repeated 5 times. Only 56 eyes had a field that had mean TD less than −6 dB, and so STABLE-6 has 56 sequences of fields.
The baseline procedure and ARREST were simulated on PROG, STABLE-0, and STABLE-6 using the “SimHenson” mode of the OPI24 assuming a false-response rate of 3% (false-positives and false-negatives). In this simulation model, each response was drawn from a Frequency-of-Seeing curve that is a cumulative Gaussian with mean equal to true visual sensitivity t, and standard deviation min[6, exp(3.27 − 0.081 × t)] with 3% asymptotes. Measurement of each field in the datasets was repeated 100 times to establish confidence intervals on our results.
Analysis
We reported two analyses of the performance of ARREST relative to the comparison ZEST procedure: firstly the performance of both relative to the ground truth, and secondly the sensitivity and specificity of the two methods in calling a decline in visual sensitivity (progression).
Accuracy and Speed
ARREST returns three possible types of visual sensitivity: red, yellow, and green. For the red and green locations it is possible to compute accuracy and precision relative to the ground truth visual sensitivities, but for yellow locations no dB value is determined, and so this is not possible. Hence, we report the accuracy and precision only for the red and green locations. The behavior of the baseline ZEST has been reported previously for true visual sensitivities in the range of 1 to 17 dB,3,7 so we did not repeat it here. We also report the total number of presentations used to measure a visual field.
Progression
In this study, we have taken an event-based approach to calling progression as trend analysis is complicated by ARREST's yellow locations that do not have a measured visual sensitivity. There are many event-based criteria for calling visual field progression in the literature (see the review of Vesti et al.12) but all have four parameters in common: (1) some definition of a baseline value from which progression must occur, (2) the number of visual field points that must exhibit a decrease in the visual sensitivity from the baseline, (3) the amount of dB decrease that is important, and (4) the number of visits in a row at which the decrease must be confirmed. Altering any of the four parameters alters the sensitivity–specificity tradeoff obtained. For example, increasing the number of confirmation visits required will increase specificity of the progression-calling method, but decrease sensitivity.
Simply applying common progression-calling methods that are used currently on 24-2 patterns to ARREST will not take into account ARREST's truncated view of the dB scale, nor will it allow for transition from green to yellow, nor yellow to red as progression. Thus, we tailored a criterion by exploring all sensible values of the four parameters and chose the method that provided the highest mean sensitivity over all 100 repeats of all eyes for the two specificity values of 89%, and 95%. To be fair to the comparison ZEST method, we also chose the progression criteria for it in the same way. We reported progression from normal, computing specificity on STABLE-0 and sensitivity on the sequence of fields starting at the first in PROG, and progression from damaged, using STABLE-6 for specificity and the sequence of fields starting at the first visual field in a series of PROG that has mean TD of less than −6 dB.
Results
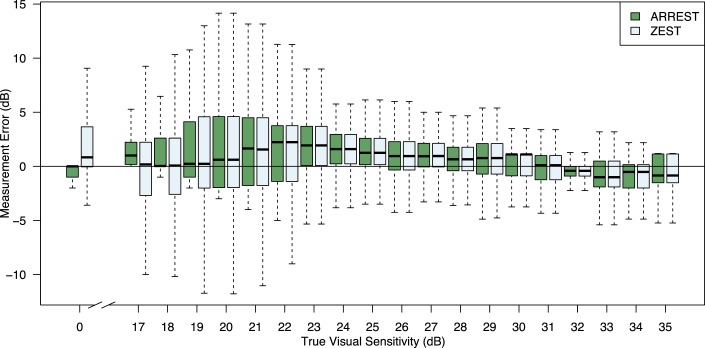
Figure 3 shows the error (measured less true) for the range of true visual sensitivities that are measured by ARREST. As expected, the error profiles were the same for high true visual sensitivities, because the test procedures were identical in this range. When true sensitivity was 17 dB, the ARREST box did not drop below 0 as any measured visual sensitivities below 17 are set to “yellow.” For true visual sensitivities in the range (16 dB, 17 dB], 9% were labeled yellow; 6% in (17 dB, 18 dB]; 2% in (18 dB, 19 dB]; and less than 1% for (19 dB, 20 dB].
Figure 3.
Difference between measured visual sensitivity and input “true” visual sensitivity rounded to the nearest integer for ARREST and ZEST, collated over all 121 eyes in PROG, all visits, 100 repeat measurements. Boxes indicate 25th and 75th percentiles, the dark line the median, and whiskers extreme values. ARREST does not measure visual sensitivities in the range 1 to 16 dB and so we cannot report differences for those values.
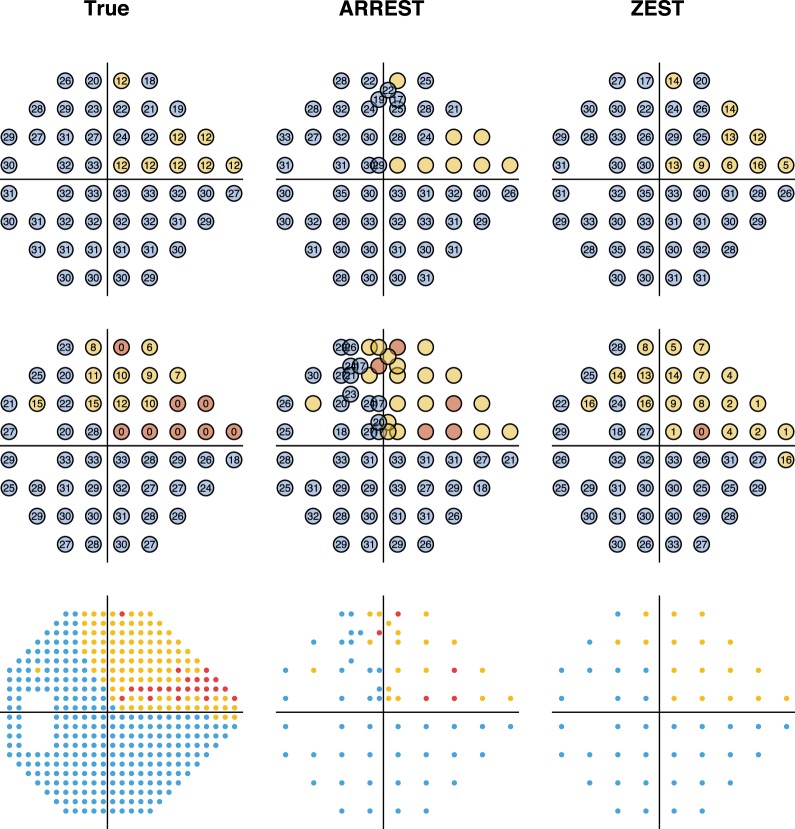
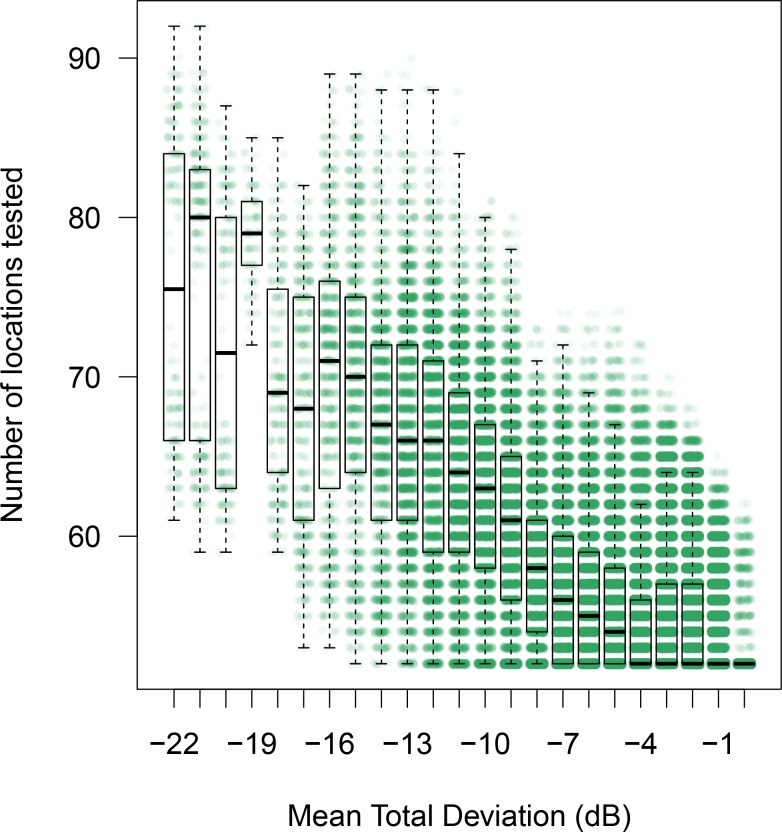
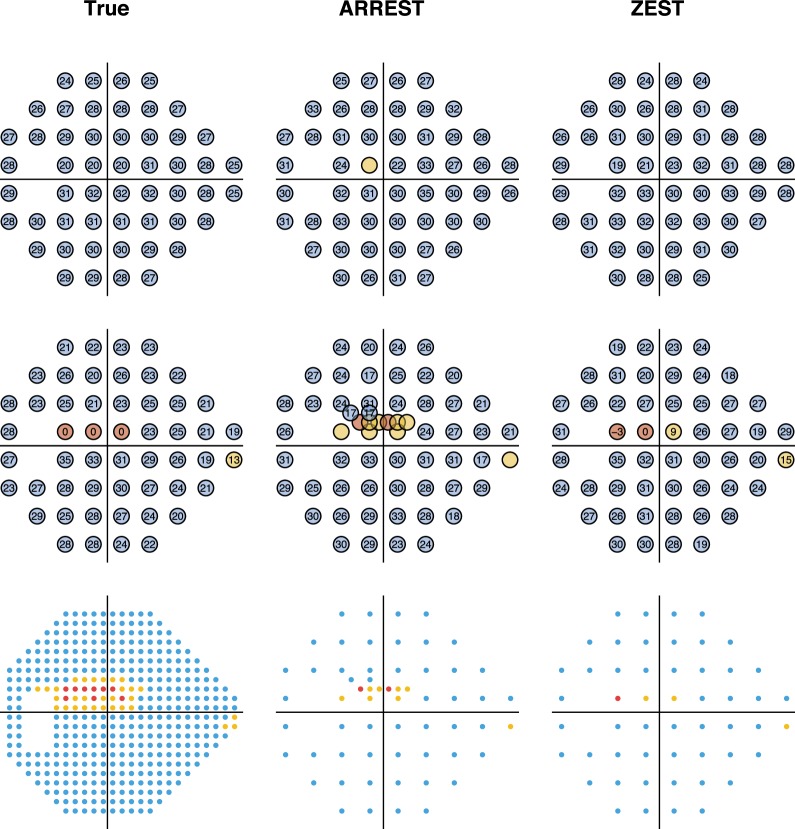
Figure 4 shows the number of presentations used by ZEST and ARREST, stratified by visual field defect severity (mean TD). As is typical of clinical visual field test procedures, ZEST requires more presentations as the number of damaged locations in a field increases. ARREST, on the other hand, has presentations capped, and uses presentations saved on “yellow” locations to test new locations. At each mean TD level, the difference between means was significant (paired t-test, P < 0.00001). Figure 5 shows an example of two fields as measured by ARREST and ZEST. It can be seen that additional visual field locations were added to the visual field report, enabling a different visual characterization of the spatial expansion of the visual field defect between the two procedures. Figure 6 shows the number of spatial locations tested per field.
Figure 4.
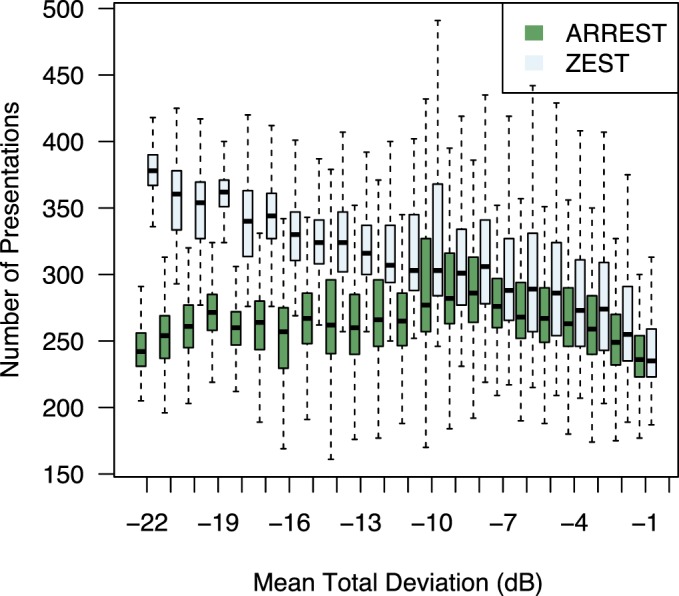
Number of presentations per visual field test stratified by mean TD of the input visual field rounded to the nearest integer. Collated over all 121 eyes in PROG, all visits, 100 repeat measurements. Boxes and whiskers as in Figure 3.
Figure 5.
Example measured visual fields of a single series in the PROG dataset. The first column contains the true visual sensitivities, the second as measured by ARREST, and the third as measured by ZEST. The top row is for a visit where mean TD of the true field is −4 dB, the second row has mean TD −11 dB. The third row shows the tested locations to scale, with each tested location covering a circle of diameter 0.43° as for a Goldmann Size III target.
Figure 6.
Number of locations tested by ARREST in a visual field stratified by mean TD. Boxes as in Figure 3. There is one green dot for each visual field measured for the 121 patients, 100 repeats, all visits in PROG.
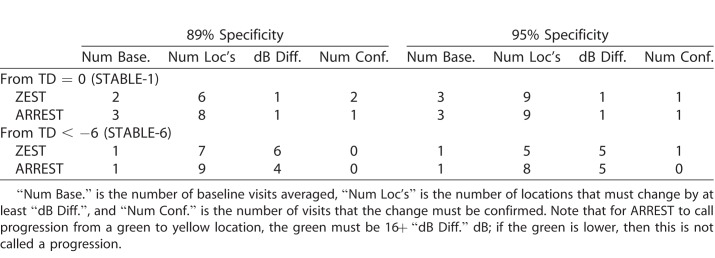
The criteria used to call progression with matched specificity is described in Table 1. For example, to achieve a specificity of 95% on the STABLE-1 dataset, and maximize the mean sensitivity over the progressing dataset PROG, both ZEST and ARREST required a baseline as the mean of the first three visits, and nine locations to be depressed from this baseline by at least 1 dB confirmed in two consecutive visits to determine a progression event. When new locations were added to the visual field in subsequent tests in ARREST, they were not considered for progression until sufficient confirmation visits were conducted where the location was measured. Note that when averaging baseline values for ARREST, the average of “green” and “yellow” was “yellow.” Moving from a baseline of “green” to “yellow” was called progression if the green value was at least 16 dB plus the dB difference described in Table 1, and moving from a baseline of “yellow” to “red” always was classified as a progression event.
Table 1.
Criteria used to Determine a Progression Event
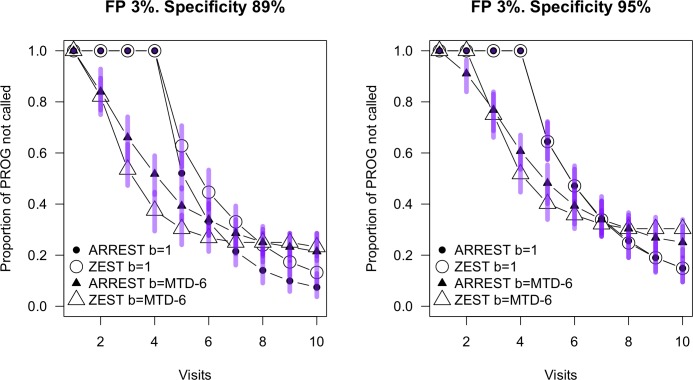
Figure 7 shows survival curves for the two procedures using the progression criteria shown in Table 1 for 89% and 95% specificity and for sequences of fields in PROG either starting at normal (b = 1) or when mean TD was less than −6 (b = MTD-6). While an analysis of variance (ANOVA) has the algorithms differing for the 89% case for both starting at TD = 0 dB (P = 0.001) and TD = −6 (P < 0.0001), there was no statistical difference between the algorithms for the 95% specificity case. For the 89% specificity case, ARREST identified more progressors when the visual field started from normal sensitivity. When the fields started at mean TD −6 dB, ZEST identified more progressors for visits three through six, because in this case at the first visit ARREST will code some of the locations as “yellow” and these then will not be flagged as definitely progressing until they turn “red.” This analysis does not consider the additional qualitative spatial information available to the clinician from ARREST. Note, the criteria chosen to classify progression were those that enabled the most closely matched specificity; however, a range of other criteria (numbers of locations, numbers of confirmations, dB change) yielded fairly similar specificity. A conservative conclusion based on the 95% specificity case is that the algorithms perform similarly in the detection of progressing cases. This is consistent with the work of Gardiner,22 showing that censoring data below approximately 19 dB does not impair the ability to detect visual field progression determined either using global indices or on a pointwise basis.21
Figure 7.
Survival curves for ARREST and ZEST on the PROG dataset. Progression criteria are as described in Table 1. Circles are for progression from normal (TD = 0, or “b = 1”), and triangles are for the progression from a baseline of mean TD less than −6 (“b=MTD-6”). Specificity was determined on the STABLE-1 and STABLE-6 datasets respectively. Bars show the 95% range over the 100 retests of the same population at each visit.
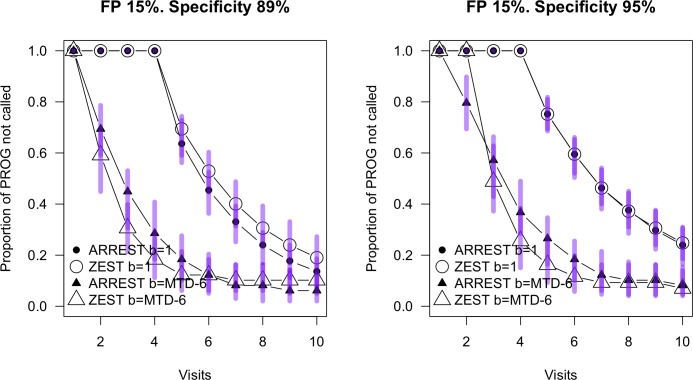
In addition, we include Figure 8 to visualize the situation where the observer makes 15% false-positives and 3% false-negatives. The same criteria as in Table 1 were used to classify progression. This resulted in specificity no longer being matched to that in Figure 7, but was consistent with a clinical scenario where criteria for progression were kept constant. In this case, the relationship between the two procedures was very similar to that shown in Figure 7. There are more locations classified as “progressing” in the visual field series commencing at TD = −6 dB for both procedures. This arises from a combination of the reduced specificity and false-positives at the first visit resulting in higher baseline sensitivity.
Figure 8.
Survival curves for ARREST and ZEST on the PROG dataset with simulations injecting a 15% false-positive rate. Progression criteria are as described in Table 1, and all other features of the Figure are the same as in Figure 7.
Discussion
We introduced a new approach to visual field testing, ARREST, that does not test locations once their visual sensitivities have fallen to below 17 dB, and use the savings in presentations to introduce new locations to test into the field. In the parameterization we used, the procedure was faster than the baseline procedure when visual field loss was moderate or advanced (mean saving of 78 presentations [SD 42] for fields with mean TD below −6 dB), but had approximately the same sensitivity and specificity for calling glaucomatous progression. Further, ARREST provided more spatial information about the visual field once at least one location was <17 dB (for example, see Fig. 5), which we expect will have clinical use that was not measured in this study.
We concentrated on a quantitative comparison of procedures to initially present differences between ARREST and standard “on-grid” procedures using accepted approaches for quantifying progression. However, we envisage that a key clinical difference is the ability to visualize growth of visual field defects, which may be of particular merit when encroaching upon fixation. The 24-2 pattern has very few locations that represent retinal locations in the macular region (and, indeed, only tests <0.5% of visual field space by area). As Figure 9 shows, ARREST enables a better spatial characterization of visual field defects encroaching on fixation, which, in addition to illustrating progression, should be of benefit in identifying visual disorder that impacts on daily behavior. It is possible that new metrics for the description of visual field expansion could be developed, for example, the percentage of visual field space that is tested and found damaged, and that these may enable better depiction of the spatial nature of visual field loss. We leave this to future work, however, to predict that such enhanced visualization of spatial information in visual fields is a key merit of the ARREST approach.
Figure 9.
Example measured visual fields of a single series in the PROG dataset where the visual field defect is close to fixation. The first column contains the true visual sensitivities, the second as measured by ARREST, and the third as measured by ZEST. The top row is for a visit where mean TD of the true field is −1 dB, the second row has mean TD −5 dB. The third row shows the tested locations to scale, with each tested location covering a circle of diameter 0.43° as for a Goldmann Size III target.
We made little attempt to optimize ARREST in this study. For example, the choice of 16 dB as the first level to enter the “yellow” zone was based on suggested boundaries where test–retest variability of perimetry accelerates; however, perhaps other values would lead to faster tests without loss of sensitivity at fixed specificities. Similarly, we just used the same prior probability distribution for testing “green” locations for every test, where perhaps this could be optimized based on previous test values or based on structural information.9,29 Further, the graph in Figure 2 could be arranged along nerve fiber bundles rather than on a rectangular grid, which may be more suitable for glaucomatous progression, but possibly problematic for visual field damage arising from other disorders. Likewise, we used a fail-one-of-two check to deny transition from “green” to “yellow” and “yellow/red” to “red,” which may not be optimal. A principled exploration of these issues requires empirical data collected at more locations than the standard 24-2 test grid. We resisted the temptation to over-fit the artificial dataset we used in this study by optimizing these parameters.
As ARREST does not use a standard dB scale once the sensitivity is estimated to fall below 17 dB, and also introduces new locations during a sequence of visual field tests (thereby increasing the total number of test locations), it may not be appropriate to use existing progression criteria that have been derived from HFA 24-2 tests. As such, when choosing new criteria, we have been careful to alter the four key parameters equally for the ZEST and ARREST to allow an even comparison. Importantly, we chose criteria to equate specificity while maximizing mean sensitivity for both procedures, which is possible because we know the true input visual sensitivities with certainty in this simulation study. There is a risk in this approach, however, that we over fit the data, and that the criteria used here are not more widely applicable. While this does not invalidate the results of this comparison (in fact, it strengthens them), future studies should consider carefully the criterion chosen for determining progression when using ARREST (or ZEST).
A common measure of progression that is used in the clinic is regression on MD, or VFI. While convenient, this measure removes nearly all spatial information that is captured in a visual field test. As ARREST is designed to enhance spatial information, we have not investigated this form of progression analysis, and do not anticipate its use in conjunction with ARREST.
Conclusion
ARREST and ZEST show similar ability to classify visual field series as progressing or not (with matched specificity), however the test time for ARREST is markedly reduced for damaged visual fields. ARREST also affords a better spatial qualitative spatial description of visual field damage. Further work is required to optimize this approach, and to develop new indices for evaluating progression based on spatial visual field expansion. Nevertheless, our approach provides strong indication that moving visual field testing away from the “one size fits all approach” is likely to provide better descriptors of visual field damage in advanced disease.
Acknowledgments
Supported by the Australian Research Council Linkage Project 150100815 (AT, AMM).
Disclosure: A. Turpin, Haag-Streit AG (R), Heidelberg Engineering GmBH (R), and CenterVue SpA (R, C); W.H. Morgan, None; A.M. McKendrick, Haag-Streit AG (R), Heidelberg Engineering GmBH (R), and CenterVue SpA (R, C)
Appendix
ZEST Procedure
Note that the domain of the ZEST procedure includes negative dB values (Table A1), which are not possible to project on any perimeter (by definition 0 dB is the brightest possible luminance). The inclusion of negative dB values removes a floor effect at 0 dB in the algorithm, shifting it to −5 dB. If for some reason the algorithm requests a presentation of <0 dB, it is set to 0 dB.
Table A1.
ZEST Parameters Used Throughout This Study as R Expressions
The PROG Data Set
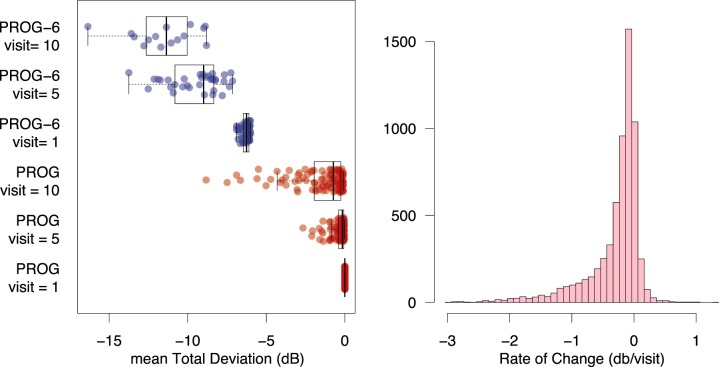
The 121 eyes in the PROG data set had an MD of 0 at the first visit (by definition), and a distribution as in Figure A1 (left) at the final visit. The distribution of the rate of progression in dB/visit for all locations is plotted in Figure A1 (right).
Figure A1.
Left: Mean TD for each patient in the datasets PROG (red) and PROG-6 (blue) at visits 1, 5, and 10. Right: A frequency distribution for the rate of change of all 24-2 locations in the PROG data set (52 × 121 patients = 6292 locations).
Natural Neighbor Interpolation
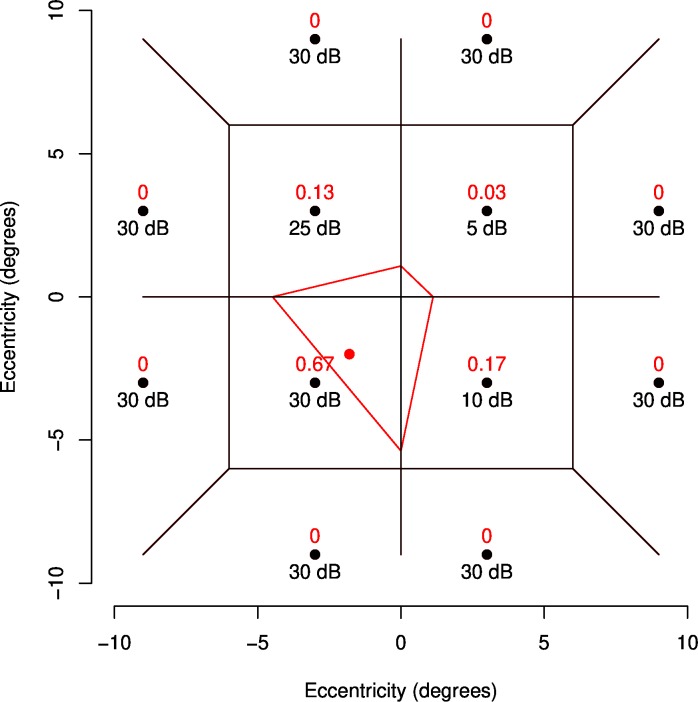
To determine the value of a new location, Natural Neighbor interpolation weights each existing location by the proportion of the area of the tile containing the new point that overlaps the old related to each location in a Voronoi tessellation. A Voronoi tessellation divides a space so that points in each tile are closest to the point that the tile contains. Figure A2 shows an example. The black lines show the Voronoi tessellation before the red point is added (the point whose value will be derived). When the red point is added, the red tile is created, and the surrounding tiles have their area decreased. In this case, 67% if the new tile covers the old tile that contained (−3, −3), 13% covers the old (−3,3) tile, 3% the (3,3) tile, and 17% the (3,−3) tile. These proportions of area are used as weights for the interpolation, so the new value will be 0.67 × 30 + 0.13 × 25 + 0.03 × 5 + 0.17 × 10 = 25.2 dB.
Figure A2.
Red text shows the weights used for deriving a dB value for the red location using Natural Neighbor Interpolation given the black locations exist with the dB values shown. Black lines show the Voronoi tessellation of the black points before the red point is added. The red boundary shows the tile that will be added for the Voronoi tessellation of the black and red points.
References
- 1.De Moraes CG, Liebman JM, Levin LA. Detection and measurement of clinically meaningful visual field progression in clinical trials for glaucoma. Prog Retin Eye Res. 2017;56:107–147. doi: 10.1016/j.preteyeres.2016.10.001. [DOI] [PMC free article] [PubMed] [Google Scholar]
- 2.Bengtsson B, Heijl A. Evaluation of a new perimetric strategy, SITA, in patients with manifest and suspect glaucoma. Acta Ophthalmol Scand. 1998;76:368–375. doi: 10.1034/j.1600-0420.1998.760303.x. [DOI] [PubMed] [Google Scholar]
- 3.Chong LX, McKendrick AM, Ganeshrao SB, Turpin A. Customised, automated stimulus location choice for assessment of visual field defects. Invest Ophthalmol Vis Sci. 2014;55:3265–3274. doi: 10.1167/iovs.13-13761. [DOI] [PubMed] [Google Scholar]
- 4.Ganeshrao SB, McKendrick AM, Denniss J, Turpin A. A perimetric test procedure that uses structural information. Optom Vis Sci. 2015;92:70–82. doi: 10.1097/OPX.0000000000000447. [DOI] [PubMed] [Google Scholar]
- 5.Gardiner SK. Effect of a variability-adjusted algorithm on the efficiency of perimetric testing. Invest Ophthalmol Vis Sci. 2014;55:2983–2992. doi: 10.1167/iovs.14-14120. [DOI] [PMC free article] [PubMed] [Google Scholar]
- 6.McKendrick AM, Turpin A. Combining perimetric supra-threshold and threshold procedures to reduce measurement variability in areas of visual field loss. Optom Vis Sci. 2005;82:43–51. [PubMed] [Google Scholar]
- 7.Rubinstein NJ, McKendrick AM, Turpin A. Incorporating spatial models in visual field test procedures. Transl Vis Sci Tech. 2016;5:7. doi: 10.1167/tvst.5.2.7. [DOI] [PMC free article] [PubMed] [Google Scholar]
- 8.Schiefer U, Pascual JP, Edmonds B. Comparison of the new perimetric GATE strategy with conventional full-threshold and SITA standard strategies. Invest Ophthalmol Vis Sci. 2009;50:488–494. doi: 10.1167/iovs.08-2229. [DOI] [PMC free article] [PubMed] [Google Scholar]
- 9.Turpin A, Jankovic D, McKendrick AM. Retesting visual fields: utilising prior information to decrease test-retest variability in glaucoma. Invest Ophthalmol Vis Sci. 2007;48:1627–1634. doi: 10.1167/iovs.06-1074. [DOI] [PubMed] [Google Scholar]
- 10.Bryan SR, Eilers PH, Lesaffre EM, Lemij HG, Vermeer KA. Global visit effects in point-wise longitudinal modeling of glaucomatous visual fields. Invest Ophthalmol Vis Sci. 2015;56:4283–4289. doi: 10.1167/iovs.15-16691. [DOI] [PubMed] [Google Scholar]
- 11.Gardiner SK, Crabb DP, Fitzke FW, Hitchings RA. Reducing noise in suspected glaucomatous visual fields by using a new spatial filter. Vision Res. 2004;44:839–848. doi: 10.1016/S0042-6989(03)00474-7. [DOI] [PubMed] [Google Scholar]
- 12.Vesti E, Johnson CA, Chauhan BC. Comparison of different methods for detecting glaucomatous visual field progression. Invest Ophthalmol Vis Sci. 2003;44:3873–3879. doi: 10.1167/iovs.02-1171. [DOI] [PubMed] [Google Scholar]
- 13.Zhu H, Russell RA, Saunders LJ, Ceccon S, Garway-Heath DF, Crabb DP. Detecting changes in retinal function: analysis with non-stationary Weibull error regression and spatial enhancement (ANSWERS) PLoS One. 2014;9:e85654. doi: 10.1371/journal.pone.0085654. [DOI] [PMC free article] [PubMed] [Google Scholar]
- 14.Turpin A, McKendrick AM. What reduction in standard automated perimetry variability would improve the detection of visual field progression? Invest Ophthalmol Vis Sci. 2011;52:3237–3245. doi: 10.1167/iovs.10-6255. [DOI] [PubMed] [Google Scholar]
- 15.Wall M, Kutzko KE, Chauhan BC. Variability in patients with glaucomatous visual field damage is reduced using Size V stimuli. Invest Ophthalmol Vis Sci. 1997;38:426–435. [PubMed] [Google Scholar]
- 16.Wall M, Woodward KR, Doyle CK, Artes PH. Repeatability of automated perimetry: a comparison between standard automated perimetry with stimulus size III and V, matrix, and motion perimetry. Invest Ophthalmol Vis Sci. 2009;50:974–979. doi: 10.1167/iovs.08-1789. [DOI] [PubMed] [Google Scholar]
- 17.Artes PH, Hutchinson DM, Nicolela MT, LeBlanc RP, Chauhan BC. Threshold and variability properties of matrix frequency-doubling technology and standard automated perimetry in glaucoma. Invest Ophthalmol Vis Sci. 2005;46:2451–2457. doi: 10.1167/iovs.05-0135. [DOI] [PubMed] [Google Scholar]
- 18.Gardiner SK, Swanson WH, Goren D, Mansberger SL, Demirel S. Assessment of the reliability of standard automated perimetry in regions of glaucomatous damage. Ophthalmology. 2014;121:1359–1369. doi: 10.1016/j.ophtha.2014.01.020. [DOI] [PMC free article] [PubMed] [Google Scholar]
- 19.Artes PH, Iwase A, Ohno Y, Kitazawa Y, Chauhan BC. Properties of perimetric threshold estimates from full threshold, SITA standard, and SITA fast strategies. Invest Ophthalmol Vis Sci. 2002;43:2654–2659. [PubMed] [Google Scholar]
- 20.Henson DB, Chaudry S, Artes PH, Faragher EB, Ansons A. Response variability in the visual field: comparison of optic neuritis, glaucoma, ocular hypertension and normal eyes. Invest Ophthalmol Vis Sci. 2000;41:417–421. [PubMed] [Google Scholar]
- 21.Gardiner SK, Swanson WH, Demirel S. The effect of limiting the range of perimetric sensitivities on pointwise assessment of visual field progression in glaucoma. Invest Ophthalmol Vis Sci. 2016;57:288–294. doi: 10.1167/iovs.15-18000. [DOI] [PMC free article] [PubMed] [Google Scholar]
- 22.Pathak M, Demirel S, Gardiner SK. Reducing variability of perimetric global indices from eyes with progressive glaucoma by censoring unreliable sensitivity data. Transl Vis Sci Technology. 2017;6:11. doi: 10.1167/tvst.6.4.11. [DOI] [PMC free article] [PubMed] [Google Scholar]
- 23.King-Smith P, Grigsby S, Vingrys A, Benes S, Supowit A. Efficient and unbiased modifications of the QUEST threshold method: theory, simulations, experimental evaluation, and practical implementation. Vision Res. 1994;34:885–912. doi: 10.1016/0042-6989(94)90039-6. [DOI] [PubMed] [Google Scholar]
- 24.Turpin A, Artes PH, McKendrick AM. The open perimetry interface: an enabling tool for clinical visual psychophysics. J Vis. 2012;12(11):1–5. doi: 10.1167/12.11.22. [DOI] [PubMed] [Google Scholar]
- 25.Turpin A, McKendrick AM, Johnson CA, Vingrys AJ. Properties of perimetric threshold estimates from Full Threshold, ZEST, and SITA-like strategies, as determined by computer simulation. Invest Ophthalmol Vis Sci. 2003;44:4787–4795. doi: 10.1167/iovs.03-0023. [DOI] [PubMed] [Google Scholar]
- 26.Chong LX, Turpin A, McKendrick AM. Targeted spatial sampling using GOANNA improves detection of visual field progression. Ophthal Physiol Optics. 2015;35:155–169. doi: 10.1111/opo.12184. [DOI] [PubMed] [Google Scholar]
- 27.An D, House P, Barry C, Turpin A, McKendrick AM, Chauhan BC, et al. The association between retinal vein pulsation pressure and optic disc haemorrhages in glaucoma. PLoS One. 2017;12:e0182316. doi: 10.1371/journal.pone.0182316. [DOI] [PMC free article] [PubMed] [Google Scholar]
- 28.Sibson R. A brief description of natural neighbour interpolation. In: Barnett V, editor. Interpolating Multivariate Data. Chichester: John Wiley;; 1981. pp. 21–36. editor. [Google Scholar]
- 29.Denniss J, McKendrick AM, Turpin A. Towards patient-tailored perimetry: automated perimetry can be improved by seeding procedures with patient-specific structural information. Transl Vis Sci Technol. 2013;2:1–13. doi: 10.1167/tvst.2.4.3. [DOI] [PMC free article] [PubMed] [Google Scholar]


