

Abstract
Background:
Estrogen, as an important hormone in human physiological process, is closely related to bone metabolism. The aim of this study was to investigate the mechanism of estrogen on osteoblasts metabolism in MC3T3-E1 cells.
Methods:
We treated the MC3T3-E1 cells with different concentrations of β-estradiol (0.01, 0.1, 1, and 10 nmol/L), observed the morphological changes of the cells, and detected the cell's proliferation and apoptosis of MC3T3-E1 cells. Two transcriptome libraries were constructed and sequenced. Quantitative real-time polymerase chain reaction (qRT-PCR) was performed to confirm the differentially expressed genes (DEGs), and then treated the MC3T3-E1 cells with estrogen receptor (ER) inhibitors α and β, respectively, and then examined the expression of Tgfbr1 and Bmpr1a genes. The promoter of Tgfbr1 and Bmpr1a gene was analyzed, and the ER response elements were identified. Finally, ChIP was used to verify the binding of ER to Tgfbr1 and Bmpr1a promoter.
Results:
In the high-concentration β-estradiol treatment group (1 nmol/L and 10 nmol/L), there was no significant difference in the morphology of the cells under the microscope, 1 nmol/L and 10 nmol/L treated group appeared statistically significant difference in cell apoptosis and proliferation (P < 0.05 and P < 0.01, respectively). We found 460 DEGs compared with the control group. Among the DEGs, there were 66 upregulated genes and 394 downregulated genes. Gene ontology classification and Kyoto Encyclopedia of Genes and Genomes pathway analysis revealed that many bone metabolism-related biological processes and cell signaling pathways were disordered. The qRT-PCR verification showed that the expressions of Tgfbr1- and Bmpr1a-related genes in bone metabolism pathway in the 10 nmol/L treatment group were significantly decreased (P < 0.05). ER β was involved in the inhibitory effect of Tgfbr1 and Bmpr1a genes. The bioinformatics of the promoter found that there were three ER response elements in the promoter of Tgfbr1, and there were two ER response elements in Bmpr1a promoter regions. ChIP experiments showed that estrogen could enhance the binding of ERs to Tgfbr1 and Bmpr1a genes.
Conclusions:
Estrogen can promote the apoptosis and proliferation of osteoblasts simultaneously, and the mechanism may be the joint action of transforming growth factor-beta, Wnt, mitogen-activated protein kinase, and nuclear factor-kappaB bone metabolism-related signaling pathway. Estrogen inhibits the expression of Tgfbr1 and Bmpr1a genes through ER β and affects the metabolism of MC3T3-E1 osteoblasts.
Keywords: Bmpr1a, Estrogen Receptor Beta, Estrogen, MC3T3-E1 Cells, Tgfbr1
摘要
背景:
雌激素作为人体生理过程中重要的激素,与骨代谢密切相关。本研究利用MC3T3-E1作为细胞模型,进一步研究雌激素对骨代谢的影响。
方法:
分别用0.01、0.1、1和10 nmol/L浓度的β-雌二醇处理成骨细胞MC3T3-E1,并设对照组;然后利用CCK-8试剂盒、TUNEL试剂盒检测不同浓度下MC3T3-E1细胞的增值和凋亡状况;选用10 nmol/L β-雌二醇的处理组,与对照组构建两个转录组库,进行RNA深度测序分析;利用qRT-PCR验证差异表达的基因,使用雌激素受体抑制剂分别处理MC3T3-E1细胞,检测Tgfbr1和Bmpr1a两个基因的表达。启动子分析软件分析Tgfbr1和Bmpr1a基因,ChIP实验验证雌激素受体β对Tgfbr1和Bmpr1a启动子的绑定作用。
结果:
在低浓度(0.01 nmol/L和0.1 nmol/L)的处理组中,在细胞的形态、细胞的增殖和细胞的凋亡等细胞行为方面相对于DMSO对照组都没有产生明显的差异(P>0.05);在1 nmol/L和10 nmol/L高浓度β-雌二醇处理组中,细胞的凋亡和细胞的增殖活性增强,1 nmol/L处理组有明显差异(P<0.05),并且在10 nmol/L处理组出现了极其显著的差异(P<0.01)。深度测序发现10 nmol/L处理组中有460个差异表达基因,在这些差异表达基因中,上调的基因有66个,下调的基因有394个。利用这些差异表达基因,本研究进行GO分类和pathway分析,发现许多骨代谢相关的生物过程和细胞信号通路。在这些被富集的骨代谢相关的信号通路中,包括经典的TGF-β信号通路,Wnt信号通路,MAPK信号通路。差异表达基因qRT-PCR验证显示,10 nmol/L 处理组中骨代谢通路相关基因Tgfbr1和Bmpr1a表达明显下降(P<0.05)。雌激素受体β参与了雌激素对Tgfbr1和Bmpr1a基因的抑制性作用,生物信息学分析发现,在Tgfbr1的启动子区域存在3个雌激素受体应答原件,在Bmpr1a的启动子区域有2个雌激素受体应答原件。ChIP实验证明, 雌激素能够增强雌激素受体β对Tgfbr1和Bmpr1a基因的绑定性作用。
结论:
雌激素能同时促进成骨细胞凋亡、增殖, 其机制可能是TGF-β、Wnt、MAPK及NF-kappaB骨代谢相关信号通路共同作用结果;雌激素通过雌激素受体β抑制Tgfbr1和Bmpr1a基因的表达, 影响MC3T3-E1成骨细胞代谢。
INTRODUCTION
Estrogen, a steroid hormone in the human body, plays an important role in many physiological processes,[1] such as the maintenance of secondary sexual characteristics, the development of neurons, and bone homeostasis.[2] Estrogen is critical to maintain bone and bone density.[3] Estrogen deficiency often leads to the emergence of osteoporosis. In postmenopausal women, estrogen secretion is markedly reduced, as is bone mineral density, whereas the incidence of bone fractures is increased. This form of osteoporosis is called postmenopausal osteoporosis (PO).[4] An imbalance of osteoblasts and osteoclasts in the bone causes osteoporosis.[5] PO has become one of the most important diseases that affect elder women, as it entails huge financial burdens for individuals and society, and reduces the quality of life.
In 1988, Komm et al.[6] found that estrogen receptors (ERs) are expressed in osteoblasts, suggesting that estrogen may have a regulatory role for osteoblasts. After the discovery of ERs on osteogenic precursors and bone cells, an increasing number of studies has shown that estrogen has a direct effect on osteogenesis, as well as an indirect effect that does not depend on ERs. Kousteni et al.[7] have found that estrogen can inhibit osteoblast apoptosis and prolong osteoblast life, thereby increasing the osteogenic capacity of each osteoblast. The effect of estrogen is achieved by rapid activation of ER-mediated regulatory kinases.[8] The lack of estrogen causes a marked increase in nuclear factor-kappaB (NF-κB) activity in osteoblasts.[9] Estrogen deficiency leads to an imbalance in bone metabolism between bone formation and resorption, eventually leading to osteoporosis. As the mechanism is not yet clear, further studies on estrogen regulation of bone metabolism and its signaling pathways are required to achieve a better understanding.
MC3T3-E1 cells are a clonal preosteoblastic cell line derived from newborn mouse calvarias, which is utilized in many osteoblast studies.[10]
METHODS
Cell culture
The clonal murine preosteoblastic cell line MC3T3-E1 was used in this study. The cells were thawed from frozen stocks and cultured in 100-mm culture dishes in α-minimum essential medium supplemented with 10% (v/v) fetal bovine serum (Thermo Fisher Scientific, Waltham, MA, USA), 1% (w/v) antibiotics/antimycotics (the stock solution contained 100 U/ml penicillin G sodium, 100 μg/ml streptomycin sulfate, and 0.25 μg/ml amphotericin B, in saline), 1.0 mmol/L sodium pyruvate, 0.1 mmol/L nonessential amino acids, and 1.5 g/L sodium bicarbonate (Thermo Fisher Scientific) at 37°C in a humidified atmosphere containing 5% (v/v) CO2. After establishing cultures from frozen cells, we subcultured the cells several times. Confluent cells were detached using 0.25% trypsin in Mg2+- and Ca2+-free phosphate-buffered saline (PBS, Thermo Fisher Scientific) before use. For the treatment of MC3T3-E1 with E2, the cells were seeded in each well of a 24- or 6-well plate with 0.5 or 2.0 ml of culture medium. The cells were incubated in the presence of E2 at different concentrations (0.01, 0.1, 1, and 10 nmol/L), and each concentration of E2 was maintained for three days. A group that received dimethyl sulfoxide (DMSO) served as the control.
Cell proliferation assay
Cell proliferation was analyzed using the Cell Counting kit 8 (Dojindo, Tokyo, Japan). MC3T3-E1 cells were detached and seeded into 96-well plates at a density of 3 × 10³ cells/well. After 24 h, cells were treated with E2 at various concentrations (0, 0.01, 0.1, 1, and 10 nmol/L) and they were then incubated for another 24 h. Cell proliferation was analyzed according to the manufacturer's instructions. The optical density of each group was measured at 450 nm using a BioTek Microplate reader.
Cell apoptosis assay
Cell apoptosis of MC3T3-E1 cells was analyzed with the TUNEL Apoptosis Detection Kit (Beyotime, ShangHai, China). Briefly, the cells were collected two days after treatment with E2, washed with PBS, and suspended in 500 μl binding buffer. Then, the cells were stained for the detection of apoptosis, according to the manufacturer's instructions. The ratio of apoptotic cells was analyzed under an optical microscope by counting terminal deoxynucleotidyl transferase dUTP nick end labeling (TUNEL, Beyotime) positive cells in six randomly selected areas.
Total mRNA extraction
Total cell mRNA was extracted using TRIzol® (Thermo Fisher Scientific), according to manufacturer instruction (Invitrogen, USA). Smart Spec Plus (Bio-Rad, Hercules, CA, USA) was used to measure the absorption at 260/280 nm to assess the quality and quantity of the collected RNA. Finally, the integrity of the extracted RNA was further assessed using 1.5% agarose gel electrophoresis. Subsequently, the RNA was transcribed to first strand cDNA using the First Strand cDNA Synthesis Kit (TAKARA, SHIGA-KEN, Japan) for gene expression analysis.
RNA sequencing library construction and sequencing
We used 20 μg of total RNA from the control group and the 10 nmol/L E2-treated group for the RNA sequencing (RNA-seq) library preparation. The collected mRNA was purified and concentrated using oligo (dT)-conjugated magnetic beads (Invitrogen) before library preparation. The purified mRNA was randomly cut into fragments with the fragmentation buffer. We used the mRNA as a template, with 6-base random primers (Random hexamers, Thermo Fisher Scientific), to synthesize the first strand of cDNA. We then added dNTPs, RNase H, and DNA polymerase I to the buffer, to synthesize the second strand of cDNA. Finally, we used AMPure® XP beads (Beckman, CA, USA) to purify the synthesized cDNA. The purification of double-stranded cDNA was performed with end repair and A-tailing. The AMPure® XP (Beckman) beads were used to select the size of the fragments. Finally, the cDNA library was obtained by PCR. Using “sequencing by synthesis” technology, we sequenced the cDNA libraries with the HiSeq2500 (Illumina, San Diego, CA 92122, USA) high-throughput sequencing platform and obtained high-quality reads. The reads and bases sequenced by the platform were usually considered raw data, and most of them got a Q30 score for base quality.
Analysis of differentially expressed genes
Gene expression has time- and space-specific characteristics, and both external stimulation and the internal environment can affect gene expression. Under two different conditions (such as the control and treatment, wild-type and mutant, different times, different organizations, etc.), genes that have significantly different expression are considered differentially expressed genes (DEGs). Similarly, transcripts with significantly different expression are called differentially expressed transcripts. In bioinformatics, the process of finding differentially expressed transcripts or DEGs is known as differential expression analysis.
Annotation and analysis of differentially expressed genes
The gene ontology (GO) database was built in 2000 and is a standard, structured biological annotation system aimed at establishing a system of standard vocabulary and knowledge of genes and their products. The GO annotation system contains three main branches: biological process, molecular function, and cellular component. We used the GO database to predict the functions of the DEGs identified in this study.[11] Enrichment analysis of the differences between samples was carried out using Top GO. Top GO directly displays the GO node and the hierarchical relationship of the DEGs. The clusters of orthologous groups (COG) of proteins database is constructed on the basis of the phylogeny of bacteria, algae, and eukaryotes to classify the orthologs of gene products. To annotate the pathways of the DEGs, it is necessary to analyze the functions of the genes. The Kyoto Encyclopedia of Genes and Genomes (KEGG) database is a major metabolic pathways database.[12] The analysis of the overpresentation of the DEGs in a pathway is important to determine the functions of the genes. In our study, COG and KEGG were used to analyze the DEGs.
Quantitative real-time polymerase chain reaction validation
Total cell mRNA was extracted using TRIzol®, according to manufacturer instruction (Invitrogen). We subjected 10 μg of total RNA to DNaseI treatment with 1 U DNaseI (NEB, MA, USA). The reaction was carried out at 37°C for 10 min followed by heat inactivation at 65°C for 10 min. We then used 2.5 μg of DNase-treated RNA for cDNA synthesis with reverse transcriptase (Bio-Rad), in accordance with the manufacturer's protocol. The expression of the Gapdh gene, which the transcriptome database indicated was stable, was used as the control for quantitative real-time polymerase chain reaction (qRT-PCR) experiments. Primers were designed for selected transcripts from the transcriptome database, and real-time PCR was performed with SYBR® Green I master mix (TAKARA) on a CFX Connect™ Real-Time PCR Detection System (Bio-Rad). The relative expression of the transcripts was calculated using the 2ΔΔ CT method.
Estrogen receptor α and estrogen receptor β antagonist treatment of MC3T3-E1 cells
For the ERα and ERβ antagonist experiments, the ERα antagonist 1,3-bis (4 hydroxyphenyl)-4-methyl-5-[4- (2-piperidinylethoxy)phenol]-1H-pyrazole dihydrochloride (MPP) and the ERβ antagonist 4-(2-phenyl-5,7-bis[trifluoromethyl] pyrazolo [1,5-a]pyrimidin-3-yl) (PTHPP) were added to the MC3T3-E1 cultures. After 72 h of treatment with the antagonists, the cells were harvested to quantify the target gene expression.
ChIP assays
ChIP assays were performed according to the manufacturer's protocol (ChIP Assay Kit, Millipore, MA, USA). Briefly, MC3T3-E1 cells were collected after culture with or without E2, cross-linked in 2% formaldehyde at 28°C for 30 min, then treated with a 1 / 10 volume of 1.25 mol/L glycine to stop cross-linking, followed by PBS washes (three washes for 10 min each). We used purified rabbit or mouse IgG (Invitrogen) as a negative control and an antibody against ERβ to pull down the DNA. We performed ChIP PCR using primers flanking the estrogen response element (ERE) sites, as well as primers not flanking the ERE sites in the promoter regions of Tgfbr1 and Bmpr1a as controls.
Statistical analysis
The statistical analyses were performed with JMP13.0 (SAS Institute Inc. Cary, NC, USA), and a P < 0.05 was considered statistically significant. Data were presented as mean ± standard deviation (SD). Statistical differences between two groups were determined with Student's t-test. Statistical differences among groups were analyzed with a one-way analysis of variance (ANOVA) followed by Student's test. All experiments were repeated at least three times, and representative experiments were shown.
RESULTS
E2 increased MC3T3-E1 cell proliferation and apoptosis
To check whether the estrogen effects the MC3T3-E1 cell's proliferation and apoptosis, different concentrations of estrogen (0, 0.01, 0.1, 1, and 10 nmol/L) were used to treat the MC3T3-E1 cells. CCK-8 and TUNEL experiments were performed. The results show MC3T3-E1 cell proliferation and apoptosis was not changed in the low concentration-treated groups (0.01 and 0.1 nmol/L estrogen-treated groups) compared with DMSO control groups. However, in the high-concentration estrogen groups (1 and 10 nmol/L estrogen-treated groups) the MC3T3-E1 cell apoptosis significantly increased compared with the DMSO control groups [Figure 1]. The 10 nmol/L concentration is higher than the physiological concentration, for obtain the robust data, so we sampled the 10 nmol/L treated group to perform RNA-seq and explore the mechanisms of the estrogen effects on MC3T3-E1 cells.
Figure 1.

Effects of estrogen on MC3T3-E1 proliferation (a) and apoptosis (b). MC3T3-E1cells were treated with different concentrations of E2, then subjected to analysis with a CCK-8 assay (a) and the TUNEL Apoptosis Detection Kit (b). Student's t-test. *P < 0.05; †P < 0.01.
RNA sequencing and identification of differentially expressed genes
To assess the effects of E2 on gene transcription, we used the Cuffdiff analysis module Cufflinks to analyze the differential gene expression in the samples.[13] The screening criteria for significant differences in the expression of genes are |log2Ratio| ≥1 and q ≤ 0.05. Using these criteria, we identified 460 DEGs. Among those DEGs, 66 genes were upregulated and 394 genes were downregulated in the cells treated with 10 nmol/L E2-treated group [Figure 2].
Figure 2.
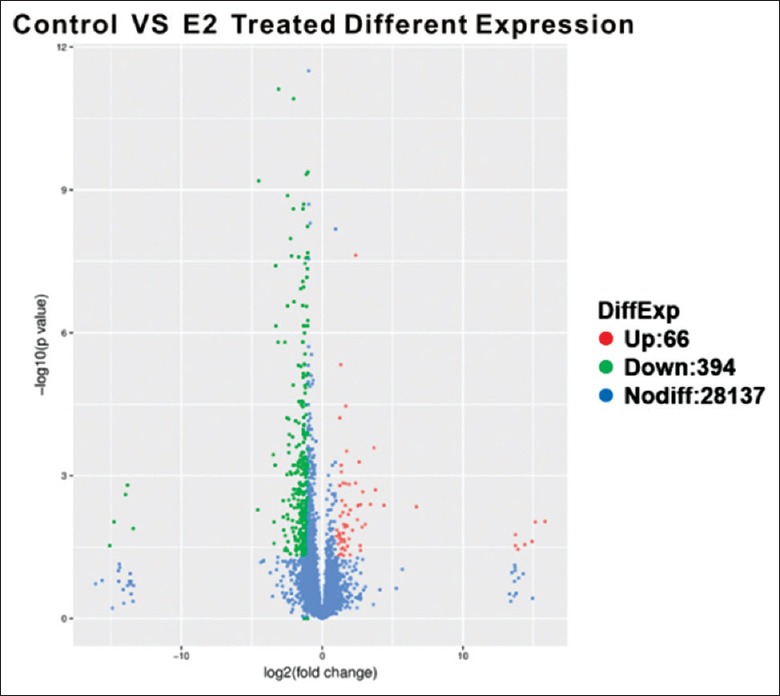
The RNA-seq identified DEGs. The screening criteria to identify significant differences in the expression of genes are |log2Ratio| ≥1 and q ≤ 0.05. RNA-seq: RNA sequencing; DEGs: Differentially expressed genes.
Gene ontology analysis and Kyoto encyclopedia of genes and genomes pathway functional analysis of enriched differentially expressed genes
GO is an internationally standardized gene functional classification system that provides a set of dynamically updated vocabularies to comprehensively describe the properties of genes and gene products in organisms. The most enriched GO results for the three ontologies are shown in Table 1. We found that genes that affect biological regulation, metabolic processes, development, anatomical structure development, responses to stimulation, systems development, cell differentiation, cell communication, regulation of gene expression, and signal transduction were enriched in the DEGs [Table 2].
Table 1.
GO enriched by differentially expression genes
| GO ID | GO-term | Hits | t | P |
|---|---|---|---|---|
| GO:0065007 | Biological regulation | 216 | 2.787 | 0.00455 |
| GO:0008152 | Metabolic process | 180 | 3.098 | 0.00234 |
| GO:0032502 | Developmental process | 118 | 3.135 | 0.00265 |
| GO:0048856 | Anatomical structure development | 103 | 3.191 | 0.00012 |
| GO:0048731 | System development | 83 | 3.113 | 0.00265 |
| GO:0050896 | Response to stimulus | 109 | 2.812 | 0.00326 |
| GO:0030154 | Cell differentiation | 73 | 3.206 | 0.00174 |
| GO:0007154 | Cell communication | 73 | 2.744 | 0.00354 |
| GO:0010468 | Regulation of gene expression | 98 | 3.175 | 0.00104 |
| GO:0007165 | Signal transduction | 62 | 3.231 | 0.00278 |
GO: Gene ontology.
Table 2.
KEGG pathway enriched by differentially expression genes
| Pathway ID | Pathway | Hits genes | P | t |
|---|---|---|---|---|
| ko05200 | Pathways in cancer | Kras, Cul2, Appl1, Chuk, Hif1a, Msh2, Mecom, Birc2, Ccna2, Fgf5, Fos | 0.00176 | 4.025 |
| ko04350 | TGF-beta signaling pathway | Sp1, Inhba, Tgfbr1a, Rbl1, Rock1, Sp1, Bmp1ra | 0.00480 | 4.325 |
| ko04010 | MAPK signaling pathway | Kras, Chuk, Rasa1, Tgfbr1a, Mecom, Rasa2, Fgf5, Fos | 0.01030 | 3.169 |
| ko04510 | Focal adhesion | Pdpk1, Vav3, Arhgap5, Birc2, Rock1, Actn2 | 0.01145 | 3.148 |
| ko04310 | Wnt signaling pathway | Lrp6, Vangl2, Rock1 | 0.01264 | 4.751 |
| ko04064 | NF-κB signaling pathway | Chuk, Birc2 | 0.01721 | 5.462 |
| ko04380 | Osteoclast differentiation | Chuk, Fos, Tgfbr1a | 0.03135 | 3.198 |
| ko04810 | Cell cycle | Atr, Smc1a, Rbl1, Ccna2, Stag1 | 0.04867 | 2.765 |
KEGG: Kyoto encyclopedia of genes and genomes; TGF: Transforming growth factor; MAPK: Mitogen-activated protein kinase; NF-κB: Nuclear factor-kappaB.
Multiple genes coordinate their biological functions in vivo. Pathway-based analysis enables further understanding of the biological functions of the genes. KEGG is the main public pathway database. Because we focus on the bone metabolism process, so bone metabolisms pathway was come into our view. We found that the DEGs were enriched for genes involved in the pathways for cancer, mitogen-activated protein kinase (MAPK) signaling, transforming growth factor-beta (TGF-β) signaling, focal adhesion, Wnt signaling, NF-κB signaling, and osteoclast signaling [Table 2]. The TGF-β and Wnt signaling pathways are important in osteoblasts. Through the pathway maps, we identified alterations in the expression of Bmpr1a, Tgfbr1, Rock1, and sp1, which are involved in the TGF-β signaling pathway [Table 2]. We also noted alterations in the expression of Lrp5, Vangl2, and Rock1, which are involved in Wnt signaling [Table 2]. In the cell cycle signaling pathway, we noted alteration in the expression Ccna2 Stag2, Atr, Smc1a and Rbl1. These data show that the effects of estrogen maybe mediated via the TGF-β and Wnt signaling pathways in MC3T3-E1 cells.
Confirmation of differentially expressed genes expression by quantitative real-time polymerase chain reaction
We chose the candidate target genes from the bone metabolic signaling pathway. The candidate genes and their relative gene functions are listed in Figure 3a. Among those genes, Sp1, Tgfbr1, and Rock1 belong to the TGF-β signaling pathway; Bmpr1a belongs to the BMP signaling pathway; Fos is from the osteoclast differentiation pathway; Lrp6 is from the Wnt signaling pathway; and Adra1b belongs to the calcium signaling pathway. The qRT-PCR results indicated that Bmpr1a, Tgfbr1, Rock1, Lrp6, and Sp1 were downregulated by E2 treatment whereas Fos and Adra1b were upregulated [Figure 3b–3h]. These results confirmed the differential expression after E2 treatment of the genes identified by RNA-seq.
Figure 3.

Confirmation of the mRNA levels of the DEGs by qRT-PCR. We treated MC3T3-E1 cells with 10 nmol/L E2, then extracted total RNA for qRT-PCR. Three independent experiments were conducted. The candidate genes and their relative gene functions are listed (a). The qRT-PCR results indicated that Bmpr1a (b), Tgfbr1 (c), Rock1 (d), Lrp6, (f), and Sp1 (h) were downregulated by E2 treatment, whereas Fos (e) and Adra1b (g) were upregulated. Student's t-test was performed. *P < 0.05; †P < 0.01. DEGs: Differentially expressed genes; qRT-PCR: Quantitative real-time polymerase chain reaction.
Estrogen negatively regulated gene expression via estrogen receptor β
Estrogen is an important endocrine regulator of bone metabolism, which mediates it effects via ERs.[14] ERs are transcription factors that bind EREs to activate or repress target gene expression.[15] Two mammalian ERs have been identified, ERα and ERβ.[16] Previous studies revealed that estrogen represses SOST expression through ERβ.[17] To investigate if the differential gene expression in the E2-treated MC3T3-E1cells was mediated through ERβ, we analyzed the Bmpr1a and Tgfbr1 promoters using online bioinformatics software (http://jaspar.binf.ku.dk/). The results identified three EREs and two EREs in the Bmpr1a and Tgfbr1 gene promoters, respectively [Figure 4a]. To determine if E2 repressed the candidate genes via a particular ER, we treated MC3T3-E1cells with 10 nmol/L E2, then added the ERα antagonist MPP or the ERβ antagonist PTHPP. We then performed qRT-PCR to investigate candidate gene expression. We found that E2 treatment significantly downregulated Bmpr1a and Tgfbr1, compared to their expression in the DMSO control groups, in the MC3T3-E1 cells. MPP did not rescue the E2-mediated downregulation of Bmpr1a and Tgfbr1. However, PTHPP treatment rescued the downregulation of Bmpr1a and Tgfbr1 [Figure 4b and 4c]. Rescue of the candidate target gene expression by PTHPP, but not MPP, revealed that estrogen negatively regulates gene expression via ERβ.
Figure 4.

Estrogen negatively regulated gene expression via ERβ. The promoter analysis of Bmpr1a and Tgfbr1 (a). MC3T3-E1cells was treated with 10 nmol/L E2, and 0.1 μmol/L MPP or 0.1 μmol/L 4-(2-phenyl-5,7-bis[trifluoromethyl] pyrazolo[1,5-a]pyrimidin-3-yl), the candidate target mRNA level was quantified via qRT-PCR. The expression level of Bmpr1a under different treated (b). The expression level of Tgfbr1 under different treated (c). Student's t-test was performed. *P < 0.05; †P < 0.01. NS: No significant; qRT-PCR: Quantitative real-time-polymerase chain reaction; ER: Estrogen receptor.
E2 increased estrogen receptor β binding to the EREs of the Bmpr1a and Tgfbr1 promoters in MC3T3-E1cells
We next addressed the potential functionality of the EREs located in the Bmpr1a and Tgfbr1 promoters. We performed ChIP experiments using an ERβ antibody to determine if ERβ bound to the EREs in the Bmpr1a and Tgfbr1 promoters. We found that ERβ bound to ERE1 and ERE3, but not ERE2, in the Bmpr1a promoter [Figure 5a]. Both of the EREs located in the Tgfbr1 promoter were bound by ERβ Figure 5b]. To investigate if E2 treatment affected the binding of ERβ in the Bmpr1a and Tgfbr1 promoters, we treated the MC3T3-E1 cells with E2 for 72 h, then performed ChIP, followed by qRT-PCR. E2 treatment increased ERβ binding to ERE1 and ERE3 in the Bmpr1a promoter [Figure 5c] and ERE1 and ERE2 in the Tgfbr1 promoter [Figure 5d]. These data demonstrated that ERβ can bind to the Bmpr1a and Tgfbr1 promoters and that E2 increased ERβ binding to the EREs of the Bmpr1a and Tgfbr1 promoters in MC3T3-E1cells.
Figure 5.

E2 increased ERβ binding to the EREs located in the Bmpr1a and Tgfbr1 promoters in MC3T3-E1cells. Ch-IP experiments were performed in the MC3T3-E1cells use ERβ antibody. ERβ binding to ERE1 and ERE3 not ERE2 located in Bmpr1a promoter (a). Both of the EREs located in the Tgfbr1 promoter were bound by ERβ (b). MC3T3-E1 cells were treated with 10 nmol/L E2 for 72 h, then performed ChIP, followed by qRT-PCR. E2 treatment increased ERβ binding to ERE1 and ERE3 in the Bmpr1a promoter (c), and increased ERβ binding to ERE1 and ERE2 in the Tgfbr1 promoter (d). Student's t-test was performed. *P < 0.05; †P < 0.01; ‡P < 0.001. qRT-PCR: Quantitative real-time polymerase chain reaction; ER: Estrogen receptor; ERE: Estrogen response element.
DISCUSSION
E2, a synthetic, exogenous estrogen that is functionally similar to endogenous estrogen, is commonly used to study the function of estrogen. MC3T3-E1 cells are a newborn mouse calvarias cell line, which is commonly used in the study of osteoblasts. ERα and ERβ have also been identified in this cell line, so MC3T3-E1 can be used to study the role of estrogen in the regulation of osteoblast function.
We found that estrogen increases the rates of proliferation and apoptosis in MC3T3-E1 cells. We used CCK-8 and TUNEL assays to investigate the proliferation and apoptosis of MC3T3-E1 cells after E2 treatment. We found no significant differences in the groups treated with low concentrations of E2 after three days. However, high concentrations of E2 promoted the proliferation and apoptosis of MC3T3-E1 cells. E2-mediated increases in the proliferation of MC3T3-E1 cells have been reported in the previous studies,[18] but we also found a slight but statistically significant increase in the number of apoptotic cells in our high-concentration group, which indicated that treatment with E2 for three days was slightly toxic to MC3T3-E1 cells.
Estrogen affects many signaling pathways that are associated with bone metabolism. In both transcriptome libraries, these pathways can be identified by GO enrichment and KEGG pathway analysis of the DEGs. After E2 treatment of the MC3T3-E1 cells, cell differentiation- and cell cycle-related genes were significantly enriched among the DEGs. The involvement of these pathways can explain why E2-treated MC3T3-E1 cells undergo increased cell proliferation and apoptosis. KEGG signaling pathway analysis indicated that genes in the Wnt, MAPK, and calcium signaling pathways, and osteoclast differentiation genes were significantly enriched among the DEGs. The enrichment of genes in these bone metabolic pathways among the DEGs demonstrated osteoblast-like differentiation of the MC3T3-E1 cells.
However, in our sequencing results, in addition to these signaling pathways, we found that the TGF-β signaling pathway and cancer-related signaling pathways were also enriched, in contrast with the research of Zhen et al. The TGF-β signaling pathway plays an important role in bone differentiation, especially in osteogenesis.[19] The TGF-β superfamily of ligands includes BMPs, growth and differentiation factors, anti-müllerian hormone, activin, nodal, and the TGF-β proteins.[20] Signaling begins with the binding of a TGF-β superfamily ligand to a TGF-β type II receptor.[21] The type II receptor is a serine/threonine receptor kinase, which catalyzes the phosphorylation of the type I receptor.[20] Each class of ligand binds to a specific type II receptor. In mammals, there are seven known type I receptors and five type II receptors.[20] In our sequencing results, we found that Tgfbr1 and Bmpr1a levels were significantly reduced in MC3T3-E1 cells after E2 treatment, and qRT-PCR confirmed this result. Tgfbr1 is also called activin receptor-like kinase receptor (Alk5),[22] ALK5 protein is strongly expressed in perichondrial progenitor cells for osteoblasts and in a thin chondrocyte layer located adjacent to the perichondrium in the peripheral cartilage.[23] Conditional knockout of the TGF-β type I receptor Alk5 in skeletal progenitor cells resulted in growth plates that had an abnormally thin perichondrial cell layer, as well as reduced proliferation and differentiation of osteoblasts.[24]
The BMP receptors are a family of transmembrane serine/threonine kinases that include the type I receptors Bmpr1a and Bmpr1b, and the type II receptor Bmpr2.[20] Deletion of the receptor Bmpr1a in the osteoblast lineage cells with a Dmp1-Cre caused a dramatic increase in trabecular bone mass in postnatal mice, which was due to a marked increase in osteoblast numbers. Another study revealed that conditional deletion of Bmpr1a in differentiated osteoclasts negatively regulates osteoclast differentiation.[25] However, osteoblast-specific deletion of Bmpr1a resulted in increased bone volume with marked decreases in bone formation rate (BFR) in tibias at 8 weeks of age.[26] Thus, physiological Bmpr1a signaling in bone exerts a dual function in both restricting preosteoblast proliferation and promoting osteoblast activity. The impact of decreased Tgfbr1 and Bmpr1a expression on MC3T3-E1 cell differentiation or increasing osteoclast activity must be further explored.
Estrogen inhibits the expression of Tgfbr1 and Bmpr1a through ERβ. Previous studies have also shown that estrogen can inhibit the expression of SOST through ERβ.[17] To confirm that estrogen inhibits the expression of Tgfbr1 and Bmpr1a through ERβ, we used ERα- and ERβ-specific inhibitors and found that only the ERβ inhibitor rescued the expression of Tgfbr1 and Bmpr1a. In addition, our ChIP experiment also demonstrated that ERβ binds to the Tgfbr1 and Bmpr1a promoters. In mouse lung cancer tissue, estrogen was found to inhibit the expression of Bmpr2 through ERα.[27] Estrogen also inhibits the activity of the TGF-β signaling pathway by promoting Smad2/3 degradation.[28] In another study, estrogen replacement decreases the accumulation of TGF-β1 on vascular smooth muscle cell (VSMC).[29] In this study, we found that the ER signaling pathway and the TGF-β signaling pathway participate in crosstalk, and ERβ can inhibit Tgfbr1. Therefore, estrogen can downregulate the expression of Tgfbr1 and Bmpr1a in MC3T3-E1 cells.
In conclusion, Estrogen can affect bone metabolism through several bone metabolism-related signaling pathways. In MC3T3-E1 cells, estrogen appears to affect bone by negatively regulating Tgfbr1 and Bmpr1a expression. Our research provides a new understanding of the mechanism by which estrogen acts on osteoblasts.
Financial support and sponsorship
This work was supported by the grants from the Medical and Technology Grant of Suzhou New District (No. 2017Q012), the General Program of Science and Technology Development of Nanjing Medical University (No. 2017NJMU114), the Science Program of Suzhou Benq Medical Center (No. SZ17008).
Conflicts of interest
There are no conflicts of interest.
Footnotes
Edited by: Li-Shao Guo
REFERENCES
- 1.Xue W, Deng Y, Wang YF, Sun AJ. Effect of half-dose and standard-dose conjugated equine estrogens combined with natural progesterone or dydrogesterone on components of metabolic syndrome in healthy postmenopausal women: A Randomized controlled trial. Chin Med J. 2016;129:2773–9. doi: 10.4103/0366-6999.194646. doi: 10.4103/0366-6999.194646. [DOI] [PMC free article] [PubMed] [Google Scholar]
- 2.Burgos N, Cintron D, Latortue-Albino P, Serrano V, Rodriguez Gutierrez R, Faubion S, et al. Estrogen-based hormone therapy in women with primary ovarian insufficiency: A systematic review. Endocrine. 2017;58:413–25. doi: 10.1007/s12020-017-1435-x. doi: 10.1007/s12020-017-1435-x. [DOI] [PMC free article] [PubMed] [Google Scholar]
- 3.Cauley JA. Estrogen and bone health in men and women. Steroids. 2015;99:11–5. doi: 10.1016/j.steroids.2014.12.010. doi: 10.1016/j.steroids.2014.12.010. [DOI] [PubMed] [Google Scholar]
- 4.Kanis JA. Assessment of fracture risk and its application to screening for postmenopausal osteoporosis: Synopsis of a WHO report. WHO study group. Osteoporos Int. 1994;4:368–81. doi: 10.1007/BF01622200. doi: 10.1007/BF01622200. [DOI] [PubMed] [Google Scholar]
- 5.Capulli M, Paone R, Rucci N. Osteoblast and osteocyte: Games without frontiers. Arch Biochem Biophys. 2014;561:3–12. doi: 10.1016/j.abb.2014.05.003. doi: 10.1016/j.abb.2014.05.003. [DOI] [PubMed] [Google Scholar]
- 6.Komm BS, Terpening CM, Benz DJ, Graeme KA, Gallegos A, Korc M, et al. Estrogen binding, receptor mRNA, and biologic response in osteoblast-like osteosarcoma cells. Science. 1988;241:81–4. doi: 10.1126/science.3164526. doi: 10.1126/science.3164526. [DOI] [PubMed] [Google Scholar]
- 7.Kousteni S, Bellido T, Plotkin LI, O’Brien CA, Bodenner DL, Han L, et al. Nongenotropic, sex-nonspecific signaling through the estrogen or androgen receptors: Dissociation from transcriptional activity. Cell. 2001;104:719–30. doi: 10.1016/S0092-8674(01)00268-9. [PubMed] [Google Scholar]
- 8.Kousteni S, Han L, Chen JR, Almeida M, Plotkin LI, Bellido T, et al. Kinase-mediated regulation of common transcription factors accounts for the bone-protective effects of sex steroids. J Clin Invest. 2003;111:1651–64. doi: 10.1172/JCI17261. doi: 10.1172/JCI17261. [DOI] [PMC free article] [PubMed] [Google Scholar]
- 9.Chang J, Wang Z, Tang E, Fan Z, McCauley L, Franceschi R, et al. Inhibition of osteoblastic bone formation by nuclear factor-kappaB. Nat Med. 2009;15:682–9. doi: 10.1038/nm.1954. doi: 10.1038/nm.1954. [DOI] [PMC free article] [PubMed] [Google Scholar]
- 10.Zaidi M. Skeletal remodeling in health and disease. Nat Med. 2007;13:791–801. doi: 10.1038/nm1593. doi: 10.1038/nm1593. [DOI] [PubMed] [Google Scholar]
- 11.Schlicker A, Domingues FS, Rahnenführer J, Lengauer T. A new measure for functional similarity of gene products based on gene ontology. BMC Bioinformatics. 2006;7:302. doi: 10.1186/1471-2105-7-302. doi: 10.1186/1471-2105-7- [DOI] [PMC free article] [PubMed] [Google Scholar]
- 12.Du J, Yuan Z, Ma Z, Song J, Xie X, Chen Y, et al. KEGG-PATH: Kyoto encyclopedia of genes and genomes-based pathway analysis using a path analysis model. Mol Biosyst. 2014;10:2441–7. doi: 10.1039/c4mb00287c. doi: 10.1039/c4mb00287c. [DOI] [PubMed] [Google Scholar]
- 13.Ghosh S, Chan CK. Analysis of RNA-Seq data using TopHat and cufflinks. Methods Mol Biol. 2016;1374:339–61. doi: 10.1007/978-1-4939-3167-5_18. doi: 10.1007/978-1-4939-3167-5-18. [DOI] [PubMed] [Google Scholar]
- 14.Rooney AM, van der Meulen MC. Mouse models to evaluate the role of estrogen receptor α in skeletal maintenance and adaptation. Ann N Y Acad Sci. 2017;1410:85–92. doi: 10.1111/nyas.13523. doi: 10.1111/nyas.13523. [DOI] [PubMed] [Google Scholar]
- 15.Saczko J, Michel O, Chwiłkowska A, Sawicka E, Mączyńska J, Kulbacka J, et al. Estrogen receptors in cell membranes: Regulation and signaling. Adv Anat Embryol Cell Biol. 2017;227:93–105. doi: 10.1007/978-3-319-56895-9_6. doi: 10.1007/978-3-319-56895-9_6. [DOI] [PubMed] [Google Scholar]
- 16.Matsushima H, Mori T, Ito F, Yamamoto T, Akiyama M, Kokabu T, et al. Anti-tumor effect of estrogen-related receptor alpha knockdown on uterine endometrial cancer. Oncotarget. 2016;7:34131–48. doi: 10.18632/oncotarget.9151. doi: 10.18632/oncotarget.9151. [DOI] [PMC free article] [PubMed] [Google Scholar]
- 17.Galea GL, Meakin LB, Sugiyama T, Zebda N, Sunters A, Taipaleenmaki H, et al. Estrogen receptor α mediates proliferation of osteoblastic cells stimulated by estrogen and mechanical strain, but their acute down-regulation of the Wnt antagonist Sost is mediated by estrogen receptor β. J Biol Chem. 2013;288:9035–48. doi: 10.1074/jbc.M112.405456. doi: 10.1074/jbc.M112.405456. [DOI] [PMC free article] [PubMed] [Google Scholar]
- 18.Sun X, Yang X, Zhao Y, Li Y, Guo L. Effects of 17β-estradiol on Mitophagy in the murine MC3T3-E1 osteoblast cell line is mediated via G protein-coupled estrogen receptor and the ERK1/2 signaling pathway. Med Sci Monit. 2018;24:903–11. doi: 10.12659/MSM.908705. doi: 10.12659/MSM.908705. [DOI] [PMC free article] [PubMed] [Google Scholar]
- 19.Wu M, Chen G, Li YP. TGF-β and BMP signaling in osteoblast, skeletal development, and bone formation, homeostasis and disease. Bone Res. 2016;4:16009. doi: 10.1038/boneres.2016.9. doi: 10.1038/boneres.2016.9. [DOI] [PMC free article] [PubMed] [Google Scholar]
- 20.Young JC, Wakitani S, Loveland KL. TGF-β superfamily signaling in testis formation and early male germline development. Semin Cell Dev Biol. 2015;45:94–103. doi: 10.1016/j.semcdb.2015.10.029. doi: 10.1016/j.semcdb.2015.10.029. [DOI] [PubMed] [Google Scholar]
- 21.Liu S, Chen S, Zeng J. TGFβ signaling: A complex role in tumorigenesis (Review) Mol Med Rep. 2018;17:699–704. doi: 10.3892/mmr.2017.7970. doi: 10.3892/mmr.2017.7970. [DOI] [PubMed] [Google Scholar]
- 22.Gesteira TF, Coulson-Thomas VJ, Yuan Y, Zhang J, Nader HB, Kao WW, et al. Lumican peptides: Rational design targeting ALK5/TGFBRI. Sci Rep. 2017;7:42057. doi: 10.1038/srep42057. doi: 10.1038/srep42057. [DOI] [PMC free article] [PubMed] [Google Scholar]
- 23.Hosseini-Farahabadi S, Geetha-Loganathan P, Fu K, Nimmagadda S, Yang HJ, Richman JM, et al. Dual functions for WNT5A during cartilage development and in disease. Matrix Biol. 2013;32:252–64. doi: 10.1016/j.matbio.2013.02.005. doi: 10.1016/j.matbio.2013.02.005. [DOI] [PubMed] [Google Scholar]
- 24.Matsunobu T, Torigoe K, Ishikawa M, de Vega S, Kulkarni AB, Iwamoto Y, et al. Critical roles of the TGF-beta type I receptor ALK5 in perichondrial formation and function, cartilage integrity, and osteoblast differentiation during growth plate development. Dev Biol. 2009;332:325–38. doi: 10.1016/j.ydbio.2009.06.002. doi: 10.1016/j.ydbio.2009.06.002. [DOI] [PMC free article] [PubMed] [Google Scholar]
- 25.Lim J, Shi Y, Karner CM, Lee SY, Lee WC, He G, et al. Dual function of bmpr1a signaling in restricting preosteoblast proliferation and stimulating osteoblast activity in mouse. Development. 2016;143:339–47. doi: 10.1242/dev.126227. doi: 10.1242/dev.126227. [DOI] [PMC free article] [PubMed] [Google Scholar]
- 26.Okamoto M, Murai J, Imai Y, Ikegami D, Kamiya N, Kato S, et al. Conditional deletion of bmpr1a in differentiated osteoclasts increases osteoblastic bone formation, increasing volume of remodeling bone in mice. J Bone Miner Res. 2011;26:2511–22. doi: 10.1002/jbmr.477. doi: 10.1002/jbmr.477. [DOI] [PubMed] [Google Scholar]
- 27.Austin ED, Hamid R, Hemnes AR, Loyd JE, Blackwell T, Yu C, et al. BMPR2 expression is suppressed by signaling through the estrogen receptor. Biol Sex Differ. 2012;3:6. doi: 10.1186/2042-6410-3-6. doi: 10.1186/2042-6410-3- [DOI] [PMC free article] [PubMed] [Google Scholar]
- 28.Ito I, Hanyu A, Wayama M, Goto N, Katsuno Y, Kawasaki S, et al. Estrogen inhibits transforming growth factor beta signaling by promoting smad2/3 degradation. J Biol Chem. 2010;285:14747–55. doi: 10.1074/jbc.M109.093039. doi: 10.1074/jbc.M109.093039. [DOI] [PMC free article] [PubMed] [Google Scholar]
- 29.Selzman CH, Gaynor JS, Turner AS, Whitehill TA, Horwitz LD, Harken AH, et al. Estrogen replacement inhibits intimal hyperplasia and the accumulation and effects of transforming growth factor beta1. J Surg Res. 1998;80:380–5. doi: 10.1006/jsre.1998.5487. doi: 10.1006/jsre.1998.5487. [DOI] [PubMed] [Google Scholar]