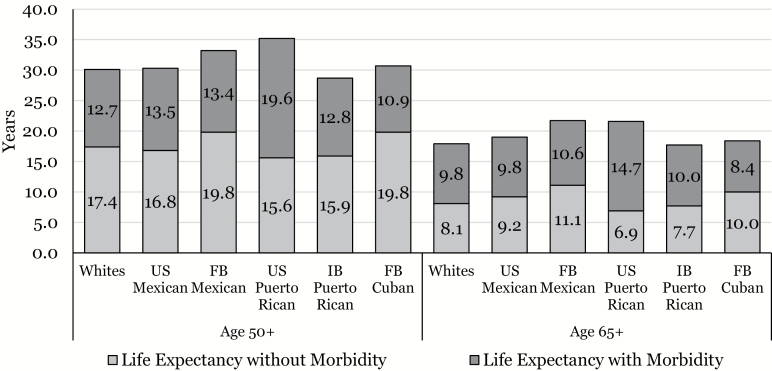
The incorrect versions of Table 3 and Figure 2 were mistakenly included in the final published article. These have now been updated in the Online and PDF versions of the article. The publisher regrets this error.
Table 3.
Morbidity Life Expectancies among Men at Ages 50 and 65 by Race/Ethnicity, Nativity, and Country of Origin, NHIS 1999–2015
| Whites | US Mexican | FB Mexican | US Puerto Rican | IB Puerto Rican | FB Cuban | ||||||||||||
|---|---|---|---|---|---|---|---|---|---|---|---|---|---|---|---|---|---|
| Years | (SE) | Years | (SE) | P | Years | (SE) | P | Years | (SE) | P | Years | (SE) | P | Years | (SE) | P | |
| Age 50+ | |||||||||||||||||
| TLE | 30.0 | 0.09 | 30.3 | 0.45 | 33.2 | 0.72 | * | 35.2 | 4.43 | * | 28.7 | 0.81 | 30.7 | 0.63 | |||
| LE without morbidity | 17.4 | 0.07 | 16.8 | 0.34 | 19.8 | 0.48 | * | 15.6 | 1.34 | * | 15.9 | 0.56 | * | 19.8 | 0.55 | * | |
| LE with morbidity | 12.7 | 0.08 | 13.5 | 0.41 | 13.4 | 0.63 | 19.6 | 4.15 | * | 12.8 | 0.68 | 10.9 | 0.58 | * | |||
| Ratio LE without morbidity | 0.58 | 0.01 | 0.55 | 0.01 | 0.60 | 0.02 | 0.45 | 0.05 | * | 0.55 | 0.02 | 0.65 | 0.02 | * | |||
| Age 65+ | |||||||||||||||||
| TLE | 17.9 | 0.07 | 19.0 | 0.46 | * | 21.7 | 0.83 | * | 21.6 | 3.33 | * | 17.7 | 0.99 | 18.4 | 0.55 | ||
| LE without morbidity | 8.1 | 0.06 | 9.2 | 0.38 | * | 11.1 | 0.52 | * | 6.9 | 1.64 | * | 7.7 | 0.54 | 10.0 | 0.45 | * | |
| LE with morbidity | 9.8 | 0.07 | 9.8 | 0.38 | 10.6 | 0.72 | 14.7 | 3.19 | * | 10.0 | 0.82 | 8.4 | 0.50 | * | |||
| Ratio LE without morbidity | 0.45 | 0.01 | 0.48 | 0.02 | * | 0.51 | 0.02 | * | 0.32 | 0.07 | * | 0.44 | 0.03 | 0.55 | 0.02 | * | |
Note: TLE = Total life expectancy. LE = Life expectancy. SE = Standard error. FB = Foreign-born. IB = Island-born.
*Significant at p < .05.
Figure 2.
Estimated years of life expectancy at ages 50 and 65 with and without morbidity among men by race/ethnicity, nativity, and country of origin, NHIS 1999–2015.


