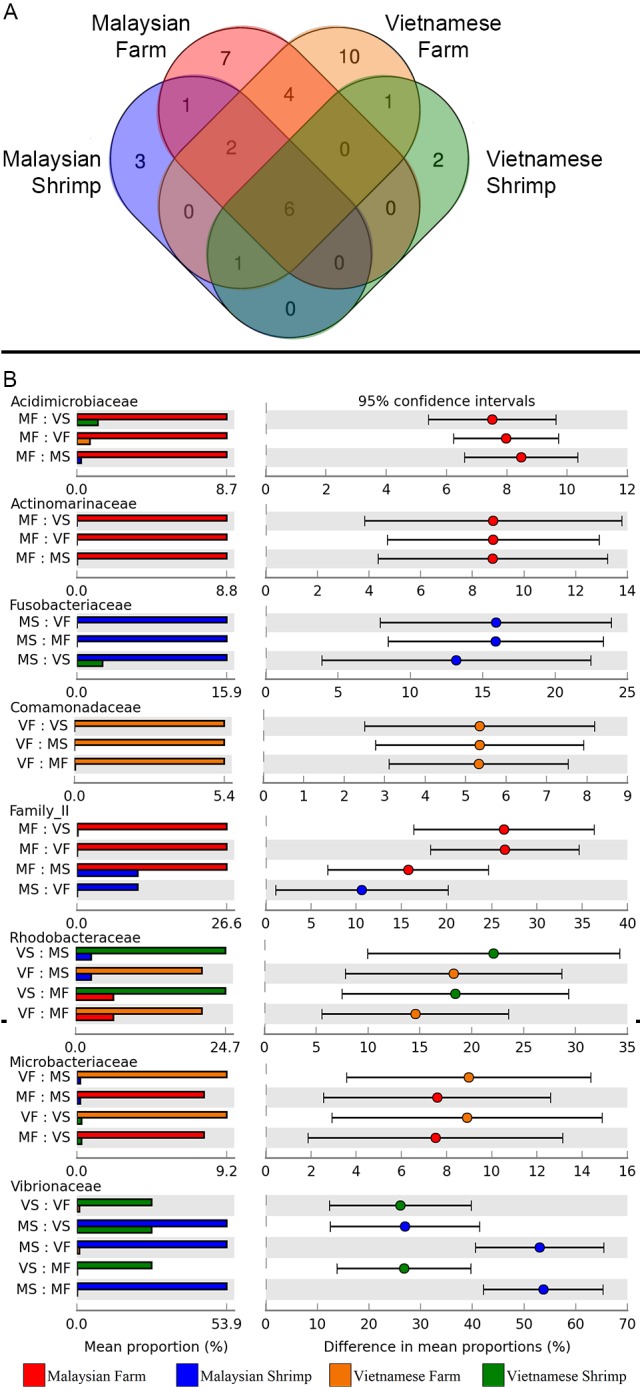
Figure 4. Microbial community dynamics at the family level.

(A) Venn diagram illustrating the number of unique and overlapping microbial families among shrimp guts and rearing water. To be considered as present, a microbial family must be detected in at least 90% of the samples from the same group. (B) Tukey post-hoc pairwise comparison in conjunction with analysis of variance (ANOVA) between “Country_Source” groups of nine significant microbial families. Mean proportion values of families that are significantly different are shown in the bar plots on the left section, while the differences in the pairwise comparison mean proportion with 95% confidence interval are shown on the right section.
