Abstract
This paper focuses on the development of a passive, lightweight skin patch sensor that can measure fluid volume changes in the heart in a non-invasive, point-of-care setting. The wearable sensor is an electromagnetic, self-resonant sensor configured into a specific pattern to formulate its three passive elements (resistance, capacitance, and inductance). In an animal model, a bladder was inserted into the left ventricle (LV) of a bovine heart, and fluid was injected using a syringe to simulate stoke volume (SV). In a human study, to assess the dynamic fluid volume changes of the heart in real time, the sensor frequency response was obtained from a participant in a 30° head-up tilt (HUT), 10° HUT, supine, and 10° head-down tilt positions over time. In the animal model, an 80-mL fluid volume change in the LV resulted in a downward frequency shift of 80.16 kHz. In the human study, there was a patterned frequency shift over time which correlated with ventricular volume changes in the heart during the cardiac cycle. Statistical analysis showed a linear correlation  and 0.87 between the frequency shifts and fluid volume changes in the LV of the bovine heart and human participant, respectively. In addition, the patch sensor detected heart rate in a continuous manner with a 0.179% relative error compared to electrocardiography. These results provide promising data regarding the ability of the patch sensor to be a potential technology for SV monitoring in a non-invasive, continuous, and non-clinical setting.
Keywords: RF resonant sensor, stroke volume, wearable sensor, point-of-care
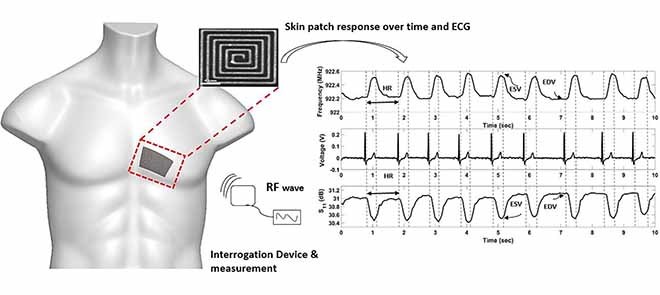
The aim of this study was to develop a non-invasive mobile skin patch sensor - applied like an adhesive bandage which could potentially measure intraventricular blood volume changes in the heart. The patch sensor has no electrical components and energized via radiofrequency waves using a square loop antenna. The waveform obtained from the skin patch showed a characteristic volumetric waveform of the cardiac cycle including an end diastolic volume peak (EDV), end systolic volume (ESV) peak, an extended period of time for the filling of blood into the left ventricle and a faster period of time for the ejection of blood into the aorta. Heart rate (HR) measurements showed a relative error of 0.179 % compared to ECG. This study shows the ability of an RF patch sensor to measure blood volume changes in the heart in a non-invasive, point-of-care setting.
I. Introduction
Stroke volume (SV) is a critical cardiac output parameter that can offer critical assessments of cardiac function [1], [2]. SV is defined as the volume of blood ejected from the left ventricle with each cardiac cycle. Utilization of SV measurements can be a valuable tool for early detection of cardio-pathologies and monitoring pharmacological stimuli in ill patients [3], [4]. Medical applications utilizing SV measurements for detection and diagnosis include an investigation of left ventricular dysfunction, assessing fluid responsiveness, and heart failure [1], [5], [6]. Recent studies have demonstrated that point-of-care technologies can have beneficial results in detecting critical ischemic events and monitoring patient health in a non-clinical setting [7], [8].
Pulmonary artery catheterization with blood flow thermodilution has been highlighted as the standard method for measuring SV [2], [6]. However, various complications are encountered with this procedure due to insertion of a pulmonary artery catheter which include increased mortality, dysrhythmias, arterial puncture, and the high clinical cost [9]–[11]. Additionally, echocardiography is another common clinical method for measuring SV based on viewing the anatomy of the left ventricle (LV) chamber and the hemodynamic flow [2]. However, this method poses several limitations which include the requirements of specialized equipment, extensive training, and non-continuous measurements [6], [12].
Furthermore, there are a wide varieties of devices that are used in the medical field that measure Cardiac Output (CO) parameters point by point, including SV. These devices include finger cuff technologies and impedance cardiography [3], [13]. Despite the efficiency of the stated devices, the requirement of a clinical setting, extensive training, and reliability of measurements are the highlighted limitation for these devises [3], [6]. Additionally, other implantable devices have been developed to provide a real time assessment of cardiac function [14], [15]. However, the main limitation for these devices is that they are invasive and require implantation for monitoring cardiac events.
The development of a non-invasive, continuous, point-of-care technology may overcome current challenges faced in providing reliable health care for patients who live in areas that lack hospitals and certified physicians [16], [17]. Utilization of a non-invasive, point of care technology for screening cardiac performance may significantly benefit both patients and healthcare facilities [7], [17]. In an emergency setting, this benefit can be seen through reduced time between arrival and discharge, for the patient, and reduction of inpatient bed turnover for the healthcare facility [7].
In the past few decades, Doppler radar radiofrequency (RF) sensors have been investigated to monitor heart rate (HR) through correlating the physiological movement to frequency changes [18], [19]. The main limitation for the Doppler radar is the complexity of the measurement method and the presence of noise in the system [19], [20]. Furthermore, other RF sensors have been developed to monitor human HR. However, these sensors lack the ability to measure blood volume in the heart [21]–[23]. Recently, RF sensors have been developed to detect human vital-signs, whereas, in this study we seek to further the capabilities of RF resonators to measure ventricular volume changes, which may be used as a cardiac parameter to assess the function of the heart.
In summary, this study presents a foundation for the development of a passive skin patch sensor, powered externally by radiofrequency (RF) waves via an antenna, to measure cardiac fluid volume changes. In our previous work, we were able to demonstrate the ability of an RF skin patch sensor to detect intracranial fluid-volume shifts, detect pulsatile blood flow in a human arm phantom, identify hemodynamic waveform features, and measure heart rate [24]–[27]. The patch sensor was designed from a single baseline component comprised of a trace of silver configured into a square planar spiral patch. The conductive material in the sensor was designed in a specific pattern which makes up three passive elements of an open circuit resonant sensor, namely, the resistance (R), capacitance (C), and inductance (L) [28], [29]. The patch sensor does not have any electrical connection and can be applied as a simple adhesive bandage or woven into a garment.
The hypothesis guiding this study was that changes in the dielectric properties in the heart of the animal model and human heart due to fluid volume changes can be registered as shifts in the resonant frequency response of the sensor. The hypothesis was evaluated by pursuing the following specific objectives 1) develop an electromagnetic skin patch sensor, 2) investigate the volumetric sensitivity of the electromagnetic skin patch, 3) quantify the sensor performance using a biological-animal model, and 4) investigate the sensor frequency response in a human participant.
II. Methods
A. Theory of Operation
The electromagnetic field of the sensor response is dependent on the material’s relative permittivity, relative permeability, and electric conductivity. When the sensor is energized via external RF waves, it produces a current flowing in the trace and a resonant frequency response with oscillating magnetic and electric fields that surround the sensor [24]. The magnetic field is generated around the trace width with an inductance value calculated according to Eq. (1) [24], [29], [30].
 |
Where,  is the total inductance,
  is the spatial current density as a function of the conductive traces,
  is the free space magnetic permeability (
 ),
),  is the total current in the circuit,
  and
and  are the relative magnetic permeability of the material near the sensor at locations
  and
and  respectively.
Furthermore, the gap width between the parallel traces provides an inherent parasitic capacitance when the sensor is impinged upon by an RF wave. The oscillating magnetic and electric fields are stored alternatively in order for the sensor resonance [24], [30], [31]. The capacitance value of the sensor can be calculated as Eq. (2) [24], [29], [30].
 |
Where,  is the capacitance, r is the length of the sensor trace,
  is the free space electrical permittivity (
 ),
),  is the relative electric permittivity, and
  is the total charge density.
B. Sensor Design
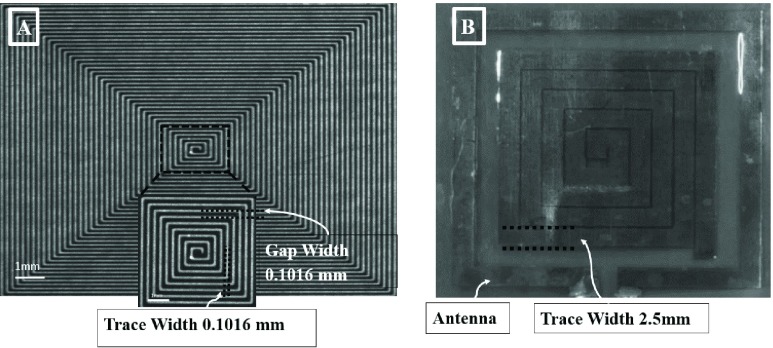
An electromagnetic skin patch sensor was built using a trace of conductive material configured into a square planar spiral comprising of inherited inductance (number of turns) with a gap width and trace width (Figure 1A & B).
FIGURE 1.
A) Microscopic snapshot of the original design for the spiral patch sensor (10.16 cm  cm
cm  mm). The skin patch sensor was built from a conductive trace of copper, with spiral turns which contributed to the inductance, gap separation between the adjacent turns which contributed to the inherent capacitance, and the trace width. A loop antenna (10.30 cm
  cm) built around the sensor to energize the sensor with an oscillating radio frequency wave. B) Snapshot of the human skin patch resonant sensor (22.0 mm
  mm
mm  mm). A loop antenna (30.5 mm
  mm) was built around the sensor to energize the sensor with an oscillating radio frequency wave.
Figure 1A shows the first sensor that was used for data collection for the volumetric sensitivity study and the biological model. The first sensor was designed as an original model to investigate the resonant frequency response to volumetric fluid change in beakers and non-active biological tissue. However, for active human studies, the skin patch sensor was designed accordingly for an optimal volumetric sensitivity detection and placement on the chest of the participant (Figure 1B). The patch sensor is a self-resonant, open circuit sensor built on a flexible polyimide substrate to make its three passive elements. The open circuit sensor is governed by Maxwell’s equations for the electric and magnetic field and the right-hand rule [29].
A loop antenna made of copper was aligned around the skin patch to radiate RF waves and collect the frequency signals and the S11 reflection coefficient. A SubMiniature Version A (SMA) connector was soldered to the antenna, and then it was connected to a Vector Network Analyzer (VNA) via a 50-ohm coaxial cable. For this study, a VNA was utilized for the purpose of inductively energizing the patch sensor with RF waves and recording the return loss S11 parameter. The return loss parameter, S11, describes the relationship between the reflected waves to the incident waves energizing the sensor. The primary factor affecting the return loss S11 parameter in this study is the substrate through which the sensor’s electromagnetic field travels. Changes in the effective permittivity of the substrate, caused by an increase in blood volume in the heart, affect the ratio between the reflected and incident waves. These changes in the ratio are the key parameters being utilized to detect changes in fluid volume [30], [32], [33]. These frequencies are used to provide information regarding the electromagnetic properties of the surrounding materials according to Eq. (3) [24].
 |
Where  is the resonant frequency,
  is the inductance, and
  is the capacitance.
C. Fluid Volume Sensitivity Measurement and Frequency Relationship
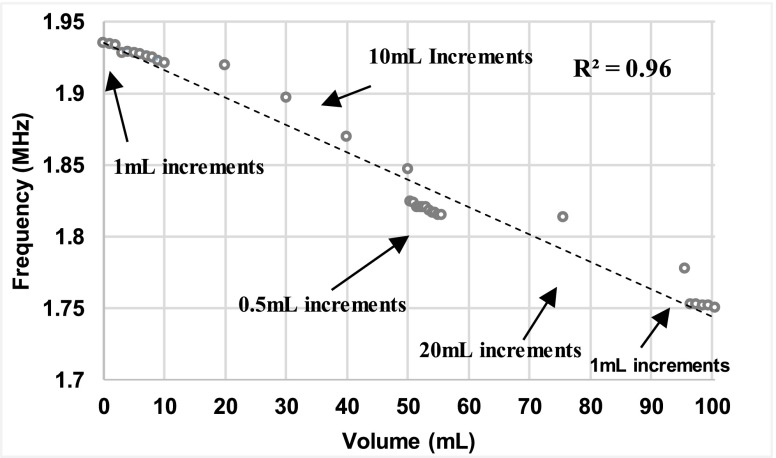
The quantification of fluid volume sensitivity of the sensor was tested using a model to analyze the relationship between the fluid volume changes and the frequency shifts of the patch sensor. The model system consisted of an empty 100 mL beaker placed next to the sensor, antenna, and VNA (SDR-Kits DG8SAQ). Water ( ) was added to an empty 100 mL beaker in increments of 0.5 mL, 1 mL, 10 mL, and 20 mL. As the volume of water in the beaker was increased from 0 mL to 100.5 mL, changes in the effective permittivity of the sensor’s electric field was induced and subsequently frequency shifts in the sensor response were detected. Measurements of S11 parameters were recorded within a frequency range of 1–3 MHz using 1000 data points after every volume increments. Four sweeps were taken at each increments for noise characterization. A statistical correlation analysis was performed to determine the correlation between fluid volume and shifts in the sensor’s peak resonant frequency response.
D. Pre-Clinical Bovine Heart Measurement
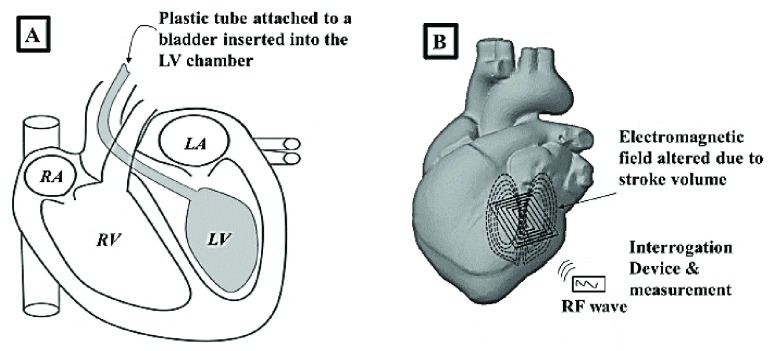
Stroke volume (SV) measurement was simulated by developing a biological model. The system consisted of the VNA (SDR-Kits DG8SAQ), the patch sensor, and a non-active bovine heart (relative permittivity myocardium tissue,  ) [34]. The Bovine heart was utilized to assess the capability of the patch sensor to measures fluid volume shifts through myocardium tissue. A plastic bladder, attached to a plastic tube, was inserted into the left ventricle of the Bovine heart through the aorta (Figure 2A).
FIGURE 2.
A) A plastic bladder attached to a plastic tube was inserted into the left ventricle of the Bovine heart to simulate stroke volume. B) The patch sensor was placed within 1 cm of the LV chamber and changes in left ventricle fluid volume were detected.
Starting with a baseline of 20 mL of water, increments of 20 mL of fluid volume were added to the bladder using a plastic syringe. Once the baseline was established in the sensors frequency response, any additional increments of water introduce a change in the effective permittivity of the myocardium tissue and water layers. This change to the effective permittivity is measured as frequency shift. The sensor was placed within 1 cm of the external layer of the LV and the shifts in the sensor’s resonant frequency were registered as fluid was pumped into the LV chamber, wall thickness  –3 cm (Figure 2B).
The VNA was calibrated to take measurements of the S11 parameter in a frequency range of 1–5 MHz using 1000 data points. Multiple sweeps were collected (from 1–5 MHz) at each increment of fluid volume for noise characterization. Statistical correlation analysis was performed to determine the relationship between the frequency shifts and fluid volume changes in the Bovine heart model.
E. Human Blood Volume Measurements
After obtaining Institutional Review Board (IRB) approval, a healthy male participant was selected to investigate the sensor frequency response in an active human tissue. The blood volume changes in the heart of the human participant were measured throughout the cardiac cycle during 30° head-up tilt (HUT), 10° HUT, supine, and 10° head-down tilt (HDT). The experimental method was chosen to investigate the ability of the sensor to detect various volumetric amounts in the heart due to different tilting positions [35]–[37]. The VNA (Rohde & Schwarz, ZNC3. Vector Network Analyzer 9 kHz – 3 GHz) was calibrated with a frequency range of 880–930 MHz for the collection of the S11 reflection coefficients. Sweep time of 43.6 ms and 501 equidistant data points were used to optimize the signal for an optimal sampling rate.
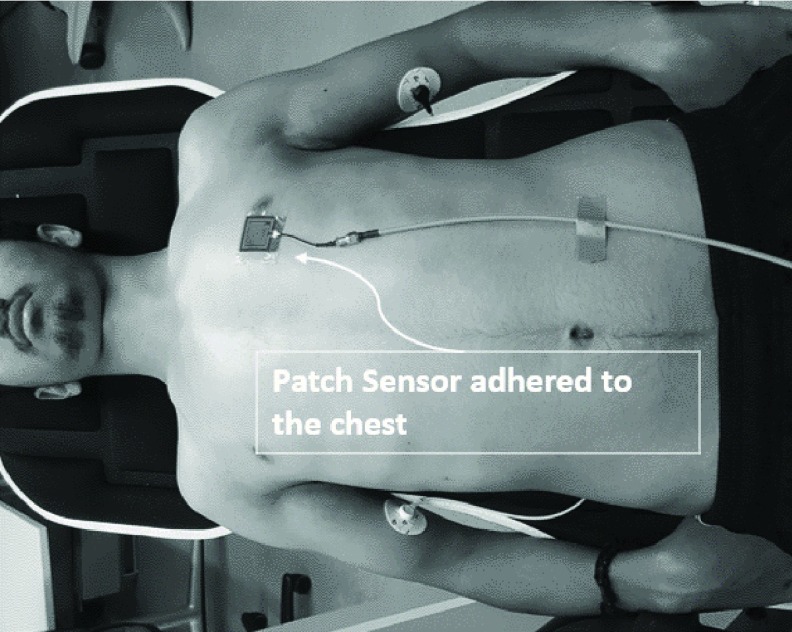
The participant was placed on an inversion table in a supine position and the patch sensor was adhered onto the patient’s chest above the 5th intercostal space lateral to the sternum (~3 cm) (Figure 3). The sensor was placed so that its electromagnetic filed is detecting changes in fluid volume in the LV.
FIGURE 3.
Human participant placed on an inversion table for data collection. The patch sensor was adhered to the top of participant chest in 5th intercostal space lateral to the sternum (~3 cm).
To establish a steady-state prior to data collection, the participant was placed in a supine position for 5 min [38]. After establishing steady-state, the participant was subjected to a 30° HUT for 5 min, inducing a shift in ventricular volume. Two sets of continuous data were collected using a continuous sweep for 10 seconds while the participant was holding his breath. The participant was asked to hold his breath in order to eliminate the changes in the effective permittivity due to air lung volume [39]. So, changes in the effective permittivity due to blood volume changes during the cardiac cycle were detected by the sensor. After collection of measurements for 30° HUT position, the participant was subjected to a 10° HUT for 5 min to induce another change in ventricular volume due to change in the hydrostatic pressure [38]. Continuous data was collected during the 10° HUT for 10 seconds while the participant again held his breath. Using the same procedure above, data was collected during supine, and 10° HDT.
Furthermore, to validate the ability of the sensor to measure heart rate, ECG was simultaneously recorded during sensor data collection. The electrical signals of the heart are a precursor to the fluid volume changes occurring. Therefore, each QRS complex is associated with ventricular contraction and subsequent volume change. Diastolic and systolic pressure were collected using a blood pressure cuff device. Additionally, for validation of the sensor’s volume detection capabilities, ultrasound echocardiogram (Model: Mindray M7, National Ultrasound, Duluth, GA) was utilized to quantify volumetric changes in the heart while the participant was subjected to various HUT and HDT postures. An apical four chamber view was obtained and the end diastolic and end systolic volumes were determined by finding the volume of LV chamber [40].
F. Signal Processing
Signal processing of data collection was performed to identify the relationship between the sensor signal response and volumetric changes in the heart. The signal was processed in two ways: 1) analyzing the sensor resonant frequency response over time utilizing a frequency tracking algorithm and 2) analyzing the time varying S11 reflection coefficient within the resonant frequency over time. In the first case, the frequency response over time was tracked by selecting a S11 reflection coefficient amplitude on the resonant peak and indexing the corresponding frequency as it shifted over time. In the second method, fluctuations in the S11 amplitude at a selected frequency were plotted over time. Additionally, after the collection of the sensor frequency response, a zero-phase digital filtering was used to smooth the signal without altering the phase of the signal.
III. Results
A. Electromagnetic Patch Sensor
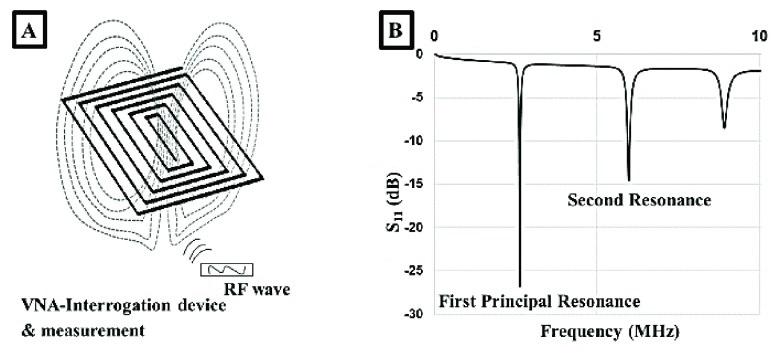
Figure 4A shows the sensor and the specific pattern which makes up the three passive elements of the resonant open circuit sensor. Additionally, an electromagnetic field is formulated around sensor once an RF wave impinged on the patch. An important feature of the sensor’s electromagnetic field is that it penetrates beyond the surface of the sensor. As a result, the skin patch can measure the changes in a substrate’s effective permittivity [24], [31]. The sensor’s performance can be optimized through the alteration of specific parameters such as trace width, gap width, and number of turns. Changes associated with a material that alter the electric permittivity and magnetic permeability within the sensor’s electromagnetic field are registered through the VNA. The VNA displays multiple harmonic peaks, first principal resonance (3 MHz), second resonance (6 MHz), and other resonant peaks that resonate at higher frequency ranges (>8 MHz) (Figure 4B).
FIGURE 4.
A) An incident RF wave impinges upon the spiral patch resulting in magnetic and electric fields formulating around the sensor. B) The sensor resonates producing a principle resonant response and subsequent resonant peaks at specific frequencies in the S11 reflection parameter.
B. Volumetric Sensitivity Measurement
A volumetric sensitivity study was conducted to investigate the sensor performance due to different fluid volume increments and to determine the relationship between the fluid volume changes and frequency shifts. Figure 5 shows the correlation between increases in fluid volume and first resonance frequency peaks (R2 = 0.96). An analysis of variance (ANOVA) followed by a Bonferroni adjusted multiple comparison test indicated that there was significant difference between the frequency shifts with each volume increment.
FIGURE 5.
Statistical correlation analyses between the fluid volume increments and frequency shifts illustrate a strong relationship (R2 = 0.96).
C. SV Animal Model Measurements
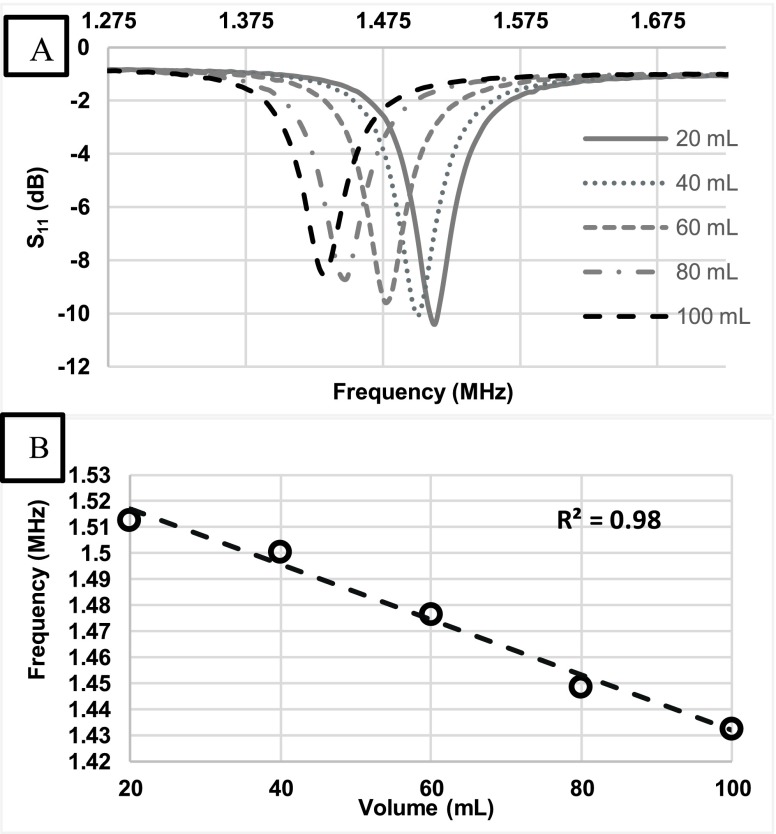
Data collection of the S11 reflection coefficient was obtained and a graph was plotted to illustrate frequency shifts due to fluid volume additions (Figure 6A). The graph shows a frequency shift of 80.16 kHz which corresponds to the total increments of water to the bladder (80 mL).
FIGURE 6.
A) Shifts in the resonant frequency were recorded as fluid volume increased in the Bovine heart by increments of 20 mL. B) A statistical correlation analysis of fluid volume shifts in the LV chamber and the principal resonant frequency response illustrate a strong relationship (R2 = 0.98).
Also, an average shift of 20.04 kHz was detected due to each increment of 20 mL of water. Changes in fluid volume in the left ventricle can be correlated in a linear relationship to the frequency shifts (Figure 6B). The correlation plot illustrated a strong relationship between the fluid volume changes and the frequency shifts (R2 = 0.98). The significance difference between frequency shifts with the fluid volume changes can be seen as the result of changes in the effective permittivity of the layered system. A downward frequency shift was obtained with increased fluid volume content in the LV.
D. Participant Blood Volume Measurement
Table 1 presents HR, diastolic, systolic blood pressure, and end diastolic, systolic blood volume measurements. HR decreased by 11 BPM from 30° HUT to 10° HDT.
Table 1. Physiological Measurements.
| Physiological Measurements | 30° HUT | 10° HUT | Supine | 10° HDT |
|---|---|---|---|---|
| Heart rate (BPM) | 57 | 63 | 50 | 46 |
| Systolic Blood Pressure (mmHg) | 109 | 118 | 117 | 116 |
| Diastole blood Pressure(mmHg) | 73 | 74 | 73 | 67 |
| End Diastolic Volume (mL) | 108.5 | 122.2 | 131.6 | 138.8 |
| End Systolic Volume (mL) | 57.6 | 65.7 | 58.8 | 61.9 |
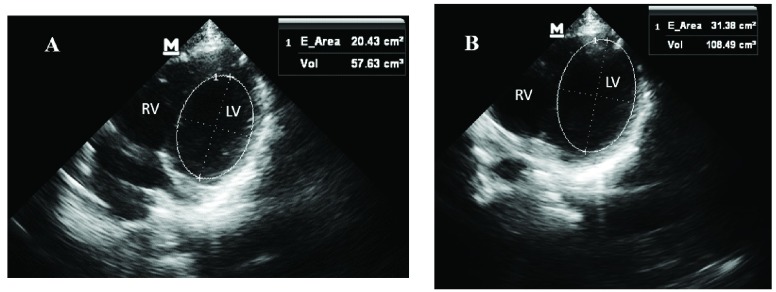
An increase in blood volume in the EDV and ESV was observed going from HUT to HDT. EDV and ESV were obtained using the ultrasounds from four apical chamber views (Figure 7).
FIGURE 7.
A) End systolic volume calculation by finding the volume of the LV chamber during peak systole. B) End diastolic volume calculation by the finding the LV chamber during peak diastole.
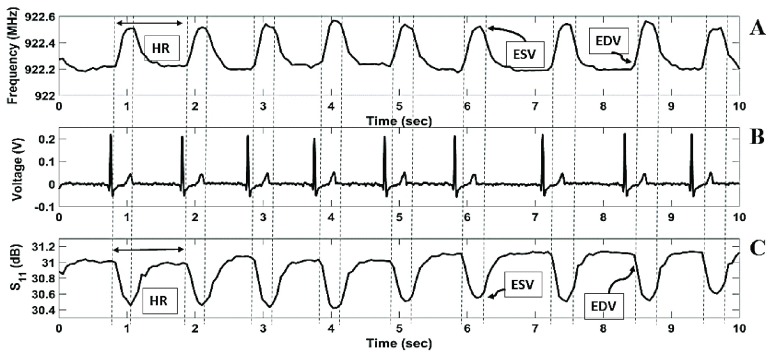
Figure 8 presents the S11 reflection coefficient pulsing over time due to the changes in the effective permittivity of the heart and blood during the cardiac cycle.
FIGURE 8.
Pulsing fluctuation of the sensor frequency response during cardiac cycle.
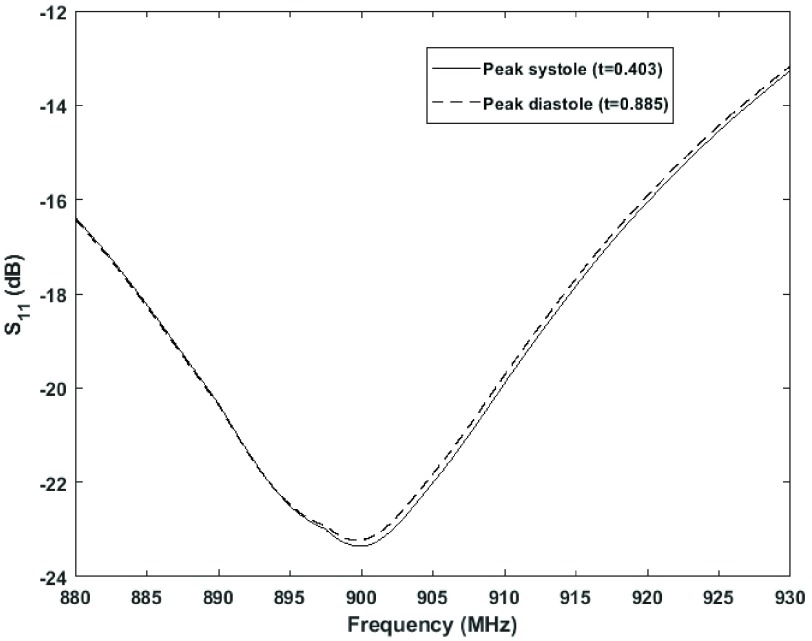
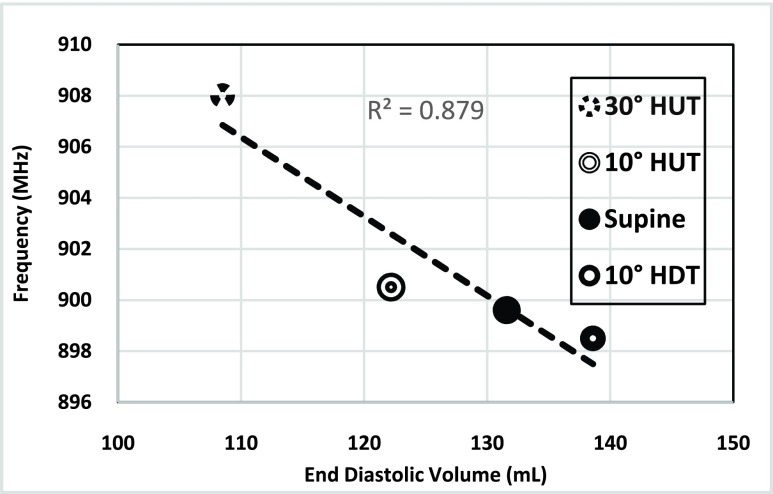
Frequency values for the end diastolic volume during 30° HUT, 10° HUT, supine and 10° HDT in the sensor’s resonant frequency response are presented in Figure 9. During 30° HUT the LV chamber had an EDV of 108.5 mL and the sensor resonated at frequency of 900.08 MHz. During 10° HDT, the LV chamber had an EDV of 138.8 mL and the sensor resonated at frequency of 800.985 MHz. So, an increase in EDV in the LV chamber corresponded to a frequency decrease in the sensor resonant frequency response.
FIGURE 9.
Shifts in the resonant frequency response due to fluid volume increase in LV chamber during 30° HUT, 10° HUT, supine, and 10° HDT.
Furthermore, changes in the S11 reflection coefficient and frequency pulsation over time showed characteristics typical of a waveform of blood volume changes in the LV. The waveform in Figure 10 showed an end diastolic volume peak (EDV), end systolic volume (ESV) peak, an extended period of time for the filling of blood into the left ventricle and a faster period of time for the ejection of blood into the body. Continuous HR measurements, acquired from the peak to peak frequency waveform, showed a relative percent error of 0.179 % compared with the ECG reference device. Additionally, with an increase in volume in the heart (EDV), a smaller frequency was observed and an increase in frequency until reaching the ESV.
FIGURE 10.
Volume changes detected as rhythmic shifts in the sensor frequency response over time. B) Simultaneous ECG recording during sensor data collection. C) Volume changes detected as rhythmic shifts in the S11 reflection coefficient over time. The waveform resembles a volumetric waveform including, end diastolic volume (EDV) mark, end systolic volume (ESV) mark and heart rate (HR).
IV. Discussion
Stroke volume measurement is a powerful tool for the assessment of cardio-pathologies. In this study, we have demonstrated the ability of an electromagnetic skin patch sensor to detect shifts in fluid volume of less than 20 mL in a beaker and fluid volume changes through cardiac muscle in a bovine heart and human participant. Detecting fluid volume shifts through cardiac muscle with a skin patch sensor is a robust first step to non-invasive point of care SV measurement. Also, the patch sensor has demonstrated its capabilities of measuring HR with a 0.179 % relative error compared to the standard method, ECG. Currently, research regarding RF resonators and the heart focus primarily on HR measurements, however, the focus of this study, in regard to quantification of SV, addresses an area that has not been extensively investigated. Additionally, the electromagnetic skin patch sensor addresses the primary limitation of invasiveness in the standard method, pulmonary artery catheterization, and complexity of ultrasounds.
A. Sensor Detection Principles
This study demonstrates the ability of the RF skin patch sensor to detect fluid volume changes in multiple environments such as in a beaker, left ventricle of a Bovine heart, and in a human participant. Changes in the sensor’s resonant frequency correspond with fluid volume fluctuations in each system. These results can be explained through the analysis of near RF field at which the patch sensor operate. In the near RF field, electric and magnetic fields are decoupled [41]. So, changes in the magnetic field are not subsequently affecting changes in the electric filed and vice versa. Additionally, at a low magnetic field, at which our sensor operates (−10 dbm), human tissues are not magnetizable [24], [42]. Changes in the magnetic field is constant with a total inductance value inherited from the sensor’s geometric design (Eq. (1)) and changes in the electric field is only detected.
Increases in the volume surrounding the area of the sensor’s electromagnetic field induce a change in the effective permittivity and result in subsequent changes in the capacitance value [24]. Eq. (3) states that increases in the capacitance value results in a decrease in the sensor frequency response. The result of our previous publication and the current study reinforce the stated concept in which increase in volume of the surrounding object induce a decrease in the sensor frequency response [24]. Maximizing the capacitance value in the sensor design resulted in better volume detection values and resonant frequency response.
B. SV Measurements to Guide the Assessments of Cardiac Function
Sensors that can be applied in an intuitive nature without extensive training (similar to an adhesive bandage) may be a valuable tool in monitoring patients with critical conditions. Due to the simplicity of the skin patch operation and the usage of non-ionizing radiation, the risks and limitations associated with current methods for measuring SV could be significantly reduced. Furthermore, it has been established in the clinical field that a parameter such as SV can guide the assessments for acute cardiovascular conditions such as myocardial infarction (MI) and the response to pharmaceutical stimuli [43]–[45]. This technology may be used as a diagnostic tool to identify abnormal heart function accompanying morbidity by assessing the fluid dynamics of the LV chamber. One potential application is by monitoring the effect of ischemic heart disease on hemodynamic flow in the LV chamber [46], [47]. Utilization of factors affecting SV such as preload, afterload, and contractility can be significant for assisting cardiac dysfunction [48]. Thus, our sensor may possess advantages for providing a simple to use, point-of-care, and cost-effective pre-clinical assessment for patients with heart health related issues.
C. Limitations and Future Work
Despite the strong correlations, this study possesses several limitations. These limitations include simplification of the biological model, utilization of a Bovine heart, and absence of other biological tissues present in the body layers (skin, adipose, muscle, and bone). However, including a human participant in this study assessed in quantifying the sensor ability in detecting volumetric changes in the human heart. The main limitation in the human study is sensor placement and penetration depth of the sensor’s field.
Sensor placement is an important factor as well. Despite our efforts to ensure that the sensor was placed above the LV, there is a chance that the sensor was detecting ventricular volume changes in both RV and LV. However, results of the paper validate the ability of the sensor to detect fluid volume changes in the human heart and serve as a preliminary validation of the sensor’s working principle. To address this limitation in future studies, an array of multi-resonant sensors may be used to reveal the relative frequency shifts between the different chambers and may help to establish blood volume changes in the different chambers of the heart.
Additionally, the penetration depth of the sensor’s electromagnetic field is an important factor. We have conducted some preliminary studies with varying thickness of muscle tissue and bone and have been able to detect usable signals in depths of up to 26 cm [26], [27], [49]. Due to the operating principles of the sensor, the penetration depth is substrate specific. Thus, the penetration depth will vary slightly between participants based upon the variance in adipose tissue, muscle, and other tissue in the chest.
Furthermore, to ensure the sensor signal response was not from changes in the skin and sternum due to blood pulsations, an examination between the sensor’s signal response on the right side of the chest (~ 3 cm to right side of the midline of sternum) and the left side was performed. The results of this investigation show that the sensor’s signal response on the right side had no pulsations compared to the response seen on the left (heart side).
Further limitations of this study include practical issues such as signal noise due to motion artifacts. To address this issue, further signal processing techniques will be explored to filter out noise due to motion. Other limitations include, the need for a vector network analyzer, which is not suitable for use in a wearable form factor. However, we are currently working on developing new bioinstrumentation which can wirelessly energize and interrogate the RF resonant skin patch, such that it could be worn in a wearable form factor. Future work will validate the sensor performance in measuring ventricular volume and compare it with other clinical standard measurement devices
V. Conclusion
In summary, this work presents a foundation for the development of a skin patch sensor that may be used as a non-invasive, point of care diagnostic to identify abnormal heart function by assessing the fluid dynamic of the LV chamber. The patch sensor is suited to measure volumetric changes which is directly related to the changes in the electric permittivity of the surrounding material. Thus, this patch sensor may be able to measure fluid volume changes in the LV chamber as frequency shifts in the sensor resonant frequency response with each cardiac cycle. Due to the simple nature, ease of operation, and point of care utilization, this patch sensor may be utilized in populations that lack hospitals, certified physician, medical field, and it would not be restricted to the clinical setting.
Acknowledgment
The authors would like to acknowledge George Szatkowski and Kenneth Dudley from NASA, Langley Research Center, for providing expertise in electromagnetics and open circuit resonators. Furthermore, this material is the result of work supported in part with the resources and the use of facilities at Wichita State University.
Funding Statement
This work was supported by the National Aeronautics and Space Administration under Grant NNX16AQ99A.
References
- [1].Hashimoto I. and Watanabe K., “Z-value of mitral annular plane systolic excursion is a useful indicator to predict left ventricular stroke volume in children: Comparing longitudinal and radial contractions,” Echocardiography, vol. 33, no. 2, pp. 290–298, 2016. [DOI] [PubMed] [Google Scholar]
- [2].Suehiro K.et al. , “The utility of intra-operative three-dimensional transoesophageal echocardiography for dynamic measurement of stroke volume,” Anaesthesia, vol. 70, no. 2, pp. 150–159, 2015. [DOI] [PubMed] [Google Scholar]
- [3].Yazdanian H., Mahnam A., Edrisi M., and Esfahani M. A., “Design and implementation of a portable impedance cardiography system for noninvasive stroke volume monitoring,” J. Med. Signals Sensors, vol. 6, no. 1, pp. 47–56, 2016. [PMC free article] [PubMed] [Google Scholar]
- [4].Shahgaldi K., Manouras A., Brodin L.-Å., and Winter R., “Direct measurement of left ventricular outflow tract area using three-dimensional echocardiography in biplane mode improves accuracy of stroke volume assessment,” Echocardiography, vol. 27, no. 9, pp. 1078–1085, 2010. [DOI] [PubMed] [Google Scholar]
- [5].Kobayashi M., Koh M., Irinoda T., Meguro E., Hayakawa Y., and Takagane A., “Stroke volume variation as a predictor of intravascular volume depression and possible hypotension during the early postoperative period after esophagectomy,” Ann. Surg. Oncol., vol. 16, no. 5, pp. 1371–1377, 2009. [DOI] [PubMed] [Google Scholar]
- [6].Behnia M., Powell S., Fallen L., Tamaddon H., and Behnia M., “Correlation of stroke volume measurement between sonosite portable echocardiogram and edwards Flotrac sensor-vigileo monitor in an intensive care unit,” Clin. Med. Insights, Circulatory, Respiratory Pulmonary Med., vol. 7, pp. 45–51, Sep. 2013. [DOI] [PMC free article] [PubMed] [Google Scholar]
- [7].Goodacre S. W., Bradburn M., Cross E., Collinson P., Gray A., and Hall A. S., “The randomised assessment of treatment using panel assay of cardiac markers (RATPAC) trial: A randomised controlled trial of point-of-care cardiac markers in the emergency department,” Heart, vol. 97, no. 3, pp. 190–196, 2011. [DOI] [PubMed] [Google Scholar]
- [8].Moore C. L. and Copel J. A., “Point-of-care ultrasonography,” New England J. Med., vol. 364, pp. 749–757, Feb. 2011. [DOI] [PubMed] [Google Scholar]
- [9].American Society of Anesthesiologists Task Force on Pulmonary Artery Catheterization, “Practice guidelines for pulmonary artery catheterization: An updated report by the American society of anesthesiologists task force on pulmonary artery catheterization,” Anesthesiology, vol. 99, pp. 988–1041, Oct. 2003. [DOI] [PubMed] [Google Scholar]
- [10].Connors A. F. Jr. et al. , “The effectiveness of right heart catheterization in the initial care of critically III patients,” JAMA, vol. 276, no. 11, pp. 889–897, 1996. [DOI] [PubMed] [Google Scholar]
- [11].Harvey S.et al. , “An evaluation of the clinical and cost-effectiveness of pulmonary artery catheters in patient management in intensive care: A systematic review and a randomised controlled trial,” Health Technol. Assessment (Winchester, England), vol. 10, no. 29, pp. 1–133, 2006. [DOI] [PubMed] [Google Scholar]
- [12].Johnson A. and Ahrens T., “Stroke volume optimization: The new hemodynamic algorithm,” Critical Care Nurse, vol. 35, no. 1, pp. 11–27, 2015. [DOI] [PubMed] [Google Scholar]
- [13].Truijen J., van Lieshout J. J., Wesselink W. A., and Westerhof B. E., “Noninvasive continuous hemodynamic monitoring,” J. Clin. Monit. Comput., vol. 26, no. 4, pp. 267–278, 2012. [DOI] [PMC free article] [PubMed] [Google Scholar]
- [14].Tang W. H. W., Warman E. N., Johnson J. W., James R. S. S., and Heywood T., “Threshold crossing of device-based intrathoracic impedance trends identifies relatively increased mortality risk,” Eur. Heart J., vol. 33, no. 17, pp. 2189–2196, 2012. [DOI] [PMC free article] [PubMed] [Google Scholar]
- [15].Abraham W. T.et al. , “Wireless pulmonary artery haemodynamic monitoring in chronic heart failure: A randomised controlled trial,” Lancet, vol. 377, no. 9766, pp. 658–666, Feb. 2011. [DOI] [PubMed] [Google Scholar]
- [16].Papali A., “Providing health care in rural and remote areas: Lessons from the international space station,” Bull. World Health Org., vol. 94, no. 1, pp. 73–74, 2016. [DOI] [PMC free article] [PubMed] [Google Scholar]
- [17].Wagner J. Y. and Saugel B., “When should we adopt continuous noninvasive hemodynamic monitoring technologies into clinical routine?” J. Clin. Monit. Comput., vol. 29, no. 1, pp. 1–3, 2015. [DOI] [PubMed] [Google Scholar]
- [18].Kuo H.-C.et al. , “A fully integrated 60-GHz CMOS direct-conversion Doppler radar RF sensor with clutter canceller for single-antenna noncontact human vital-signs detection,” IEEE Trans. Microw. Theory Techn., vol. 64, no. 4, pp. 1018–1028, Apr. 2016. [Google Scholar]
- [19].Li C., Lubecke V. M., Boric-Lubecke O., and Lin J., “A review on recent advances in Doppler radar sensors for noncontact healthcare monitoring,” IEEE Trans. Microw. Theory Techn., vol. 61, no. 5, pp. 2046–2060, May 2013. [Google Scholar]
- [20].Xiao Y., Li C., and Lin J., “Accuracy of a low-power Ka-band non-contact heartbeat detector measured from four sides of a human body,” in IEEE MTT-S Int. Microw. Symp. Dig., Jun. 2006, pp. 1576–1579. [Google Scholar]
- [21].Kim S. W., Choi S. B., An Y.-J., Kim B.-H., Kim D. W., and Yook J.-G., “Heart rate detection during sleep using a flexible RF resonator and injection-locked PLL Sensor,” IEEE Trans. Biomed. Eng., vol. 62, no. 11, pp. 2568–2575, Nov. 2015. [DOI] [PubMed] [Google Scholar]
- [22].Bo H., Xu L., Hao L., Dou Y., Zhao L., and Yu W., “A single-channel non-orthogonal I/Q RF sensor for non-contact monitoring of vital signs,” Appl. Comput. Electromagn. Soc. J., vol. 31, no. 6, pp. 603–611, 2016. [Google Scholar]
- [23].An Y.-J., Kim B.-H., Yun G.-H., Kim S.-W., Hong S.-B., and Yook J.-G., “Flexible non-constrained RF wrist pulse detection sensor based on array resonators,” IEEE Trans. Biomed. Eng., vol. 10, no. 2, pp. 300–308, Apr. 2015. [DOI] [PubMed] [Google Scholar]
- [24].Cluff K.et al. , “Passive wearable skin patch sensor measures limb hemodynamics based on electromagnetic resonance,” IEEE Trans. Biomed. Eng., vol. 65, no. 4, pp. 847–856, Apr. 2018. [DOI] [PubMed] [Google Scholar]
- [25].Alruwaili F. H., Griffith J., Cluff K., and Patterson J., “Non-invasive point-of-care method for measuring left-ventricular stroke-volume using a passive electromagnetic skin patch sensor,” J. Amer. College Cardiol., vol. 69, no. 11, p. 1068, 2017. [Google Scholar]
- [26].Griffith J. L., Wakim A. A., Moore-Jansen P., and Cluff K., “Non-invasive biomedical patch sensor to measure intracranial pressure,” in Proc. IEEE 13th Int. Conf. Wearable Implant. Body Sensor Netw. (BSN), Jun. 2016, p. 211. [Google Scholar]
- [27].Griffith J.et al. , “Non-invasive electromagnetic skin patch sensor to measure intracranial fluid–volume shifts,” Sensors, vol. 18, no. 4, p. 1022, 2018. [DOI] [PMC free article] [PubMed] [Google Scholar]
- [28].Dudley K. L., Szatkowski G. N., Smith L. J., Koppen S. V., Ely J. J., and Nguyen T. X., “Damage detection response characteristics of open circuit resonant (SansEC) sensors,” NASA, Seattle, WA, USA, Tech. Rep. SEA 13-59, 2013, p. 13. [Google Scholar]
- [29].Szatkowski G. N., Dudley K. L., Smith L. J., Wang C., and Ticatch L. A., “Open circuit resonant (SansEC) sensor technology for lightning mitigation and damage detection and diagnosis for composite aircraft applications,” NASA, Tech. Rep. NASA/TP-2014-218554, Nov. 2014, p. 179.
- [30].Woodard S. E., “Functional electrical sensors as single component electrically open circuits having no electrical connections,” IEEE Trans. Instrum. Meas., vol. 59, no. 12, pp. 3206–3213, Dec. 2010. [Google Scholar]
- [31].Woodard S. E., “SansEC sensing technology—A new tool for designing space systems and components,” in Proc. IEEE Aerosp. Conf., Mar. 2011, pp. 1–11. [Google Scholar]
- [32].Lornejad-Schäfer M., Hilber W., and Schäfer C., “Reflection coefficient S11 related measurement system for label-free cell seeding analysis and drug testing in a three-dimensional (3D) cell culture model,” J. Biosensors Bioelectron., vol. 5, p. 151, Apr. 2014. [Google Scholar]
- [33].Palmer K. D. and van Rooyen M. W., “Simple broadband measurements of balanced loads using a network analyzer,” IEEE Trans. Instrum. Meas., vol. 55, no. 1, pp. 266–272, Feb. 2006. [Google Scholar]
- [34].Gabriel C., Gabriel S., and Corthout E., “The dielectric properties of biological tissues: I. Literature survey,” Phys. Med. Biol., vol. 41, no. 11, p. 2231, 1996. [DOI] [PubMed] [Google Scholar]
- [35].Ade C. J., “Effects of supine and −6° head-down tilt posture on cardiovascular and exercise performance,” M.S. thesis, Dept. Kinesiol, Kansas State Univ, Manhattan, KS, USA, 2008. [Google Scholar]
- [36].Prisk G. K., Fine J. M., Elliott A. R., and West J. B., “Effect of 6 degrees head-down tilt on cardiopulmonary function: Comparison with microgravity,” Aviation, Space, Environ. Med., vol. 73, no. 1, pp. 8–16, 2002. [PubMed] [Google Scholar]
- [37].Naylor J. M., Chow C.-M., McLean A. S., Heard R. C., and Avolio A., “Cardiovascular responses to short-term head-down positioning in healthy young and older adults,” Physiotherapy Res. Int., vol. 10, no. 1, pp. 32–47, 2005. [DOI] [PubMed] [Google Scholar]
- [38].Vijayalakshmi P., “Acute effect of 30 degrees, 60 degrees and 80 degrees head-down tilt on blood pressure in young healthy human subjects,” Indian J. Physiol. Pharmacol., vol. 50, no. 1, pp. 28–32, 2006. [PubMed] [Google Scholar]
- [39].Kido T.et al. , “Compressed sensing real-time cine cardiovascular magnetic resonance: Accurate assessment of left ventricular function in a single-breath-hold,” J. Cardiovascular Magn. Reson., vol. 18, p. 50, Aug. 2016. [DOI] [PMC free article] [PubMed] [Google Scholar]
- [40].Serres F.et al. , “Comparison of 3 ultrasound methods for quantifying left ventricular systolic function: Correlation with disease severity and prognostic value in dogs with mitral valve disease,” J. Vet. Internal Med., vol. 22, no. 3, pp. 566–577, 2008. [DOI] [PubMed] [Google Scholar]
- [41].Lin J. C., Electromagnetic Fields in Biological Systems. Boca Raton, FL, USA: CRC Press, 2011. [Google Scholar]
- [42].Mohan S. S., del Mar Hershenson M., Boyd S. P., and Lee T. H., “Simple accurate expressions for planar spiral inductances,” IEEE J. Solid-State Circuits, vol. 34, no. 10, pp. 1419–1424, Oct. 1999. [Google Scholar]
- [43].Shimada Y. J.et al. , “Comparison of left ventricular stroke volume assessment by two- and three-dimensional echocardiography in a swine model of acute myocardial infarction validated by thermodilution method,” Echocardiography, vol. 29, no. 9, pp. 1091–1095, 2012. [DOI] [PubMed] [Google Scholar]
- [44].Peyton P. J. and Chong S. W., “Minimally invasive measurement of cardiac output during surgery and critical care: A meta-analysis of accuracy and precision,” J. Amer. Soc. Anesthesiol., vol. 113, no. 5, pp. 1220–1235, 2010. [DOI] [PubMed] [Google Scholar]
- [45].Da Silva C.et al. , “Two-dimensional color Doppler echocardiography for left ventricular stroke volume assessment: A comparison study with three-dimensional echocardiography,” Echocardiography, vol. 29, no. 7, pp. 766–772, 2012. [DOI] [PubMed] [Google Scholar]
- [46].Armstrong P. W., “Left ventricular dysfunction: Causes, natural history, and hopes for reversal,” Heart, vol. 84, no. 1, pp. i15–i17, 2000. [DOI] [PMC free article] [PubMed] [Google Scholar]
- [47].Roger V. L., “Epidemiology of heart failure,” Circulat. Res., vol. 113, no. 6, pp. 646–659, 2013. [DOI] [PMC free article] [PubMed] [Google Scholar]
- [48].Vieillard-Baron A. and Cecconi M., “Understanding cardiac failure in sepsis,” Intensive care Med., vol. 40, no. 10, pp. 1560–1563, 2014. [DOI] [PubMed] [Google Scholar]
- [49].Rogers J., Jayakumar B., Patterson J., and Cluff K., “Electromagnetic properties of blood-flow for screening of peripheral artery disease,” Arteriosclerosis, Thrombosis, Vascular Biol., vol 36, no. 1, pp. A516-A, 2016. [Google Scholar]


