

Abstract
We report the identification and use of a mutant of the purine selective ribonuclease RNase U2 that randomly cleaves RNA in a manner that is directly compatible with RNA modification mapping by mass spectrometry. A number of RNase U2 mutants were generated using site-saturation mutagenesis. The enzyme activity and specificity were tested using oligonucleotide substrates, which revealed an RNase U2 E49A mutant with limited specificity and a tendency to undercut RNA. Using this mutant, RNA digestion conditions were optimized to yield long, overlapping digestion products, which improve sequence coverage in RNA modification mapping experiments. The analytical utility of this mutant was demonstrated by liquid chromatography tandem mass spectrometry (LCMS/MS) mapping of several modified RNAs where 100% sequence coverage could be obtained using only a single enzymatic digestion. This new mutant facilitates more accurate and efficient RNA modification mapping than traditional highly base-specific RNases that are currently used.
Keywords: Ribonuclease U2, tRNA sequencing, post-transcriptional modifications, nonspecific endoribonuclease
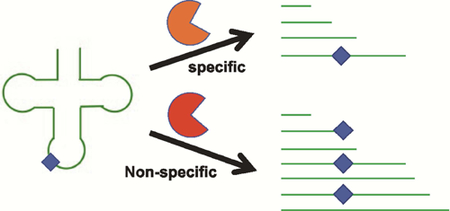
Graphical Abstract
1.0. Introduction
The four canonical bases in ribonucleic acid (RNA) are known to serve as the substrates for a variety of enzymatic processes that can generate a wide range of post-transcriptionally modified nucleosides. The locations, levels, functional roles and distribution across various organisms of the nearly 150 known post-transcriptional modified nucleosides are different.[1] Among the variety of methods that have been used to detect, identify and quantify modified nucleosides, mass spectrometry is an approach that is particularly sensitive to these molecules because of the concomitant change in nucleoside mass, structure or both upon modification.[2, 3]
Beyond detection, identification and quantification of modified nucleosides, mass spectrometry has also been used to determine the location of these modifications within the original RNA sequence. The approach for modification site determination, known as RNA modification mapping, was originally developed by McCloskey and co-workers based on an older biochemical technique of ribonuclease (RNase) mapping of RNAs.[2] Traditional RNA modification mapping makes use of one or more RNases to enzymatically digest RNA into smaller oligonucleotides (digestion products) that are amenable to separation by high performance liquid chromatography (HPLC) and subsequent detection by mass spectrometry. The mass spectrometry data can then reveal the type of modification present as well as the location through gas-phase fragmentation of the digestion products.
As typically implemented, RNA modification by mass spectrometry relies on RNases of high specificity although complementary information can be gleaned when non-specific RNases are used in conjunction with enzymes of high specificity. For example, the most popular RNase for these experiments is RNase T1, which will cleave RNA 3’ of all unmodified guanosine residues as well as 3’ of the modified nucleoside N2-methylguanosine (m2G). Other common RNases used in modification mapping by mass spectrometry include RNase A, which is selective for the canonical pyrimidines and the modified nucleoside pseudouridine; RNase U2, which is selective for the canonical purines; RNase MC1, which is specific for uridine; Cusativin, which is specific for cytidine; and several non-specific RNases.[4–10]
A prime motivation for using RNases of high specificity has been in the known simplification of data analysis within the mass spectrometry experiment.[11] As noted by Pomerantz and co-workers, the base composition of any RNase digestion product can be determined if the mass measurement is made with sufficient accuracy. When a base-specific RNase is used, two advantages accrue: (1) for a fixed mass measurement accuracy, base compositions can be defined for longer oligonucleotides; and (2) for a fixed oligonucleotide length, a lower mass accuracy is required to uniquely define the base composition. While these advantages are still relevant today, the advances in both mass spectrometry technical performance and computational speed since 1995 have lead us to re-examine whether RNases of high specificity remain a critical component of any RNA modification mapping strategy by mass spectrometry.
RNase U2, originally isolated from Ustilago sphaerogena,[12, 13] is a purine-selective enzyme with a slight preference to cleave at the 3’-end of adenosine residues. RNase U2 consists of 114 amino acids and belongs to the RNase T1 family of enzymes.[14] The binding site of RNase U2 consists of Y44 through I51 with E49 being an important residue for adenine recognition.[15, 16] Crystallization studies revealed that RNase U2 comes in multiple crystal forms, which can affect nucleobase selectivity.[15, 17–23] The enzyme has previously been cloned and expressed through Pichia pastoris but the produced enzyme was either misfolded or unstable.[24, 25] Recently, our lab developed an E. coli expression system for RNase U2 that we have used in RNA modification mapping by mass spectrometry.[8]
Here, we report the non-specific ribonuclease activity of an RNase U2 E49A substitution mutant and demonstrate its utility in providing increased sequence coverage of substrate RNA during modification mapping. Data analysis software was modified to account for non-specific digestion, and we demonstrate the combination allows for efficient and accurate RNA modification mapping with outcomes equal to or better than prior base-specific (e.g., RNase T1) strategies.
2.0. Materials and Methods
2.1. Materials
Rosetta 2 cells containing pET22b-U2 were obtained in house.[8] Degenerate primers for site saturation mutagenesis of position 49 were purchased from Integrated DNA Technologies (Skokie, Illinois, USA). Dpn1 enzyme was purchased from New England Biolabs (Ipswich, Massachusetts, USA). Saccharomyces cerevisiae tRNAPhe, terrific broth media, hexafluoroisopropanol (HFIP), and ammonium acetate solution were obtained from Sigma Aldrich (St. Louis, Missouri, USA). Carbenicillin, chloramphenicol, Isopropyl-β-D-thiogalactoside (IPTG), and lysozyme were purchased from Gold Biotechnology (St. Louis, Missouri, USA). The Ni-NTA His-Bind purification kit and 4–20% SDS gels were purchased from Novagen (Madison, Wisconsin, USA). Hydrochloric acid, 15% TBE-urea gels, Tris-Cl, boric acid, and triethylamine (TEA) were acquired from Fisher Scientific (Waltham, Massachusetts, USA). The synthetic 12-mer oligonucleotide was purchased from Dharmacon (Lafayette, Colorado, USA).
2.2. In silico alanine scanning
To first identify RNase U2 amino acid residues that could be mutated to reduce adenine nucleobase selectivity, alanine scanning was performed using the ABS-Scan software (S1).[26] To model RNase U2, the crystal structure of RNase U2 (PDB ID 3AGN[22]) was used. The ligand used in this simulation was adenosine 3’-monophosphate (3’-AMP). The distance cut-off was set to 3.0 Å.
2.3. RNase U2 Cloning, Overexpression and Purification
RNase U2-E49A is a product of site saturation mutagenesis of recombinant plasmid pET22b-U2.[27] The vector plasmids were isolated from a 10 mL overnight culture. Whole plasmid PCR was performed using degenerate primers (forward: TAC GAT GAA GCA TCA NNN GAC ATT ACC TTA TGT and reverse: ACA TAA GGT AAT GTC NNN TGA TGC TTC ATC GTA). Denaturation was done at 95 °C for two min followed by an amplification cycle at 92 °C for 30 s, 55 °C for 30 s and 72 °C for two min (repeated 28X). An extension step was performed thereafter at 72 °C for five min. The resulting mutant plasmids are then transformed into Rosetta DE competent cells and were plated into TB-carbenicillin-chloramphenicol agar plates at 37 °C. Single colonies in each plate were selected and inoculated into TB medium with antibiotics and shaken at 200 rpm at 37 °C overnight. This inoculum was transferred to a 1L TB medium and the OD was monitored until a value between 0.5 and 0.8 OD was reached. Next, IPTG was added to a final concentration of 600 μM. Incubation was continued for 3 h.
Cells were harvested by centrifugation at 6000 rpm for 8 min at 4 °C. The recovered pellet was lysed with 2 mg/mL lysozyme in 10 mM MgCl2, 25 mM Tris-Cl, and 60 mM KCl and incubated for at least 2 h at 4 °C. To remove cell debris, the lysis reaction was spun at 12000 rpm for 30 min at 4 °C. The supernatant was collected and purified through a Ni-NTA column and protein purification kit. Purified protein fractions were dialyzed with 50 mM ammonium acetate at pH 4.5, analyzed by SDS PAGE, and fractions containing an ~11 kDa band, consistent with RNase U2, were retained. Protein was aliquoted and added to glycerol to a final concentration of 10% and stored at −20 °C. The codon-optimized RNase U2 [8] was purified in the same manner as the mutants.
2.4. Activity Assay
To establish the activity of mutant E49A, 1 ng of enzyme was incubated with 3 μg Saccharomyces cerevisiae tRNAPhe in 50 mM ammonium acetate, pH 4.5, at room temperature for 10 and 20 min. The same substrate containing codon-optimized RNase U2 was used as a positive control under the same experimental conditions. An untreated tRNA sample served as negative control. Samples were loaded onto a 15% TBE-urea polyacrylamide gel and run for 1 h at 180 V. The running buffer used was 1X TBE. The resulting RNA bands were quantified using ImageJ software.
2.5. Specificity Assay
To examine the specificity of mutant E49A, 3 μg of a 12-mer synthetic oligoribonucleotide UAACUAUAACGG was incubated with 5 ng of enzyme in 200 mM ammonium acetate as described before [8] with a codon-optimized RNase U2 digest serving as a positive control. Digestion mixtures were dried through a centrifugal vacuum concentrator and reconstituted in 10 μL mobile phase A (MPA, 200mM HFIP and 8 mM triethylamine (TEA) in water at pH 7.0) just before LC-MS analysis.
2.6. Optimization of Digestion Conditions
Specific amounts of mutant E49A (1 ng, 5.5 ng, and 55.0 ng) were incubated with 5 μg of S. cerevisiae tRNAPhe in 220 mM ammonium acetate, pH 4.5 for 30 min at 37 °C. To examine any duration effects on RNA digestion, separate aliquots of 55 ng of mutant E49A were incubated with 5 μg S. cerevisiae tRNAPhe for 10 min, 30 min and 2 h at pH 4.5 and 37 °C. The effect of temperature was also investigated by incubating two aliquots of 5 μg of S. cerevisiae tRNAPhe with mutant E49A in 220 mM ammonium acetate, pH 4.5 for 30 min at 37 °C and 65 °C.
2.7. Temperature Ramp Experiments
Samples containing 5 μg of S. cerevisiae tRNAPhe and 5.5 ng of the E49A mutant were incubated in 50 mM ammonium acetate with a pH of 4.5 at a combination of different temperatures. Various temperature gradients (e.g., 28 or 37 °C initial temperature ramped to 67 °C over 5 min; 65 °C ramped to 45 °C over 5 min) or step-wise incubation (65 °C, 45 °C and 37 °C at five min intervals each) were studied.
2.8. LC-MS Analysis of RNase U2 Digestion Products
Digestion products of the RNase U2 mutant or codon-optimized control were separated on a Waters Xbridge C18 column (3.5 μm, 1.0 × 150 mm) with MPA and mobile phase B (MPB: 50% MPA and 50% methanol) at a flow rate of 30 μL/min. The gradient started from 5% to 40% MPB in 5 min, followed by an increase until 95% MPB in 30 min. Samples were injected using a Thermo Finnigan micro AS autosampler and all separations were done through a Thermo Finnigan Surveyor MS Pump. A Thermo LTQ-XL mass spectrometer with an electrospray ionization source was used. Mass spectra were acquired in negative polarity. The capillary temperature was set at 275 °C while the spray voltage was set at 4 kV.
2.9. Data Analysis
Automated data analysis and peak annotation was conducted using in-house software and RoboOligo.[28] The in-house software uses FASTA-formatted sequences of the RNA of interest and MGF-formatted MS/MS data as the inputs. The RNA input sequence is used to construct a database of expected fragmentation products using a previously published approach[29] and the experimental MS/MS data is searched against this local database. To characterize the specificity (or lack thereof) of E49A, the local database generates digestion products whose 3’-terminus can be any canonical nucleosides or modified nucleosides in the sequence. To characterize the efficiency of digestion, the local database digestion products were allowed to vary from dimers to 15-mers in overall length.
The in-house software uses previously reported metrics for MS/MS data interpretation and sequence annotation.[29] Any MS/MS data that cannot be matched to the database can be exported as a separate MGF file, which was then analyzed using RoboOligo.[28] Manual de novo sequencing was also performed to ensure no false positives and to identify digestion products that were not determined by either automated approach.
3. Results and Discussion
As it is well established in RNA modification mapping by mass spectrometry that base-specific endonucleases, such as RNase T1, cannot provide full sequence coverage of single or multiple RNA sequences,[9, 30] investigators have resorted to multiple enzyme digestion strategies to improve modification mapping confidence and accuracy.[4, 5, 31] Given recent technical advances in RNA modification mapping by mass spectrometry and the unique behavior identified from several RNase U2 mutants generated during other laboratory investigations into this enzyme, the utility of a single enzyme of limited specificity and characteristic undercutting of RNA to generate a mixture of digestion products that could improve RNA modification mapping as compared to prior multi-enzyme strategies was investigated in detail.
3.1. RNase U2 E49A Mutant
A codon-optimized RNase U2 plasmid[8] was used as a platform to create a mutant with altered binding site properties. Active mutants were screened and the specific mutation was identified by DNA sequencing. These active RNase U2 mutants were then incubated with S. cerevisiae tRNAPhe to test for mutant specificity (data not shown). LC-MS/MS analysis of the digestion products revealed that an E49A mutant exhibited no clear base specificity and was viewed as the best candidate to investigate for nonspecific enzymatic digestion of RNA in modification mapping experiments. This mutant was further characterized as described below.
The E49A mutant was purified and found to have the same molecular weight via SDS-PAGE analysis as the RNase U2 control (data not shown). Samples of tRNA incubated with E49A mutant were visualized on a 15% denaturing polyacrylamide gel to determine enzyme activity. tRNA samples incubated with only buffer served as the negative control while samples incubated with codon-optimized RNase U2 served as the positive control. The RNA bands were quantified to determine the extent of enzyme activity. The positive control resulted in nearly complete digestion of the tRNA substrate after 10 and 20 min incubation period. In contrast, the E49A mutant exhibited less activity, as 18% intact tRNA remained after 10 min and 14% intact tRNA remained after 20 min of incubation (Supplemental Figure S1). This data indicates that the incubation period did not significantly affect the extent of digestion, but the E49A mutant is less active than codon-optimized RNase U2.
A synthetic oligonucleotide, UAACUAUAACGG, was incubated with mutant E49A to identify any base specificity in the enzyme’s cleavage preference. Figure 1A presents representative LC-MS/MS data obtained from the E49A mutant. A significant number of digestion products were detected. These digestion products were found to contain a purine at the 3’-terminus, consistent with the known cleavage specificity of RNase U2. However, when comparing the mutant digestion pattern to that obtained from the codon-optimized RNase U2 control (Figure 1B), the mutant was characterized by a significant number of missed cleavages. The mass spectra and fragmentation patterns of each digestion product are provided in Supplemental Figures S2–S21. Moreover, because multiple digestion products appear to originate from the 5’-end of the oligonucleotide after loss of the 5’-terminal uridine, this mutant must also possess some ability to cleave at UpN sites.
Figure 1.

A. Total ion chromatogram (TIC) of E49A digestion products generated from the synthetic oligonucleotide 5’-UAACUAUAACGG-3’ substrate. B. As in A except using the codon optimized (wild type) RNase U2 for enzymatic digestion. MS/MS spectral assignments for each identified digestion product are provided in the Supplemental Information.
Given the promising results found from incubating a synthetic oligoribonucleotide with the E49A mutant, next we sought to determine whether the incubation conditions had any significant effect on enzyme specificity when using a modified RNA sample (tRNA-Phe). First, the amount of enzyme used was varied and the resulting digestion products were analyzed by LC-MS/MS (Table 1). Fewer digestion products were found when larger amounts of enzyme were added, likely due to the enzyme generating a significant amount of monomers and dimers (data not shown). No significant differences in enzyme digestion patterns were noted between the 1 ng and 5.5 ng protein amounts, but unlike the results found with the synthetic oligoribonucleotide, no clear nucleobase preference for enzyme cleavage sites could be discerned.
Table 1.
Comparison of peak areas of E49A digestion products of S. cerevisiae tRNA-Phe using variable amounts of enzyme. The list shows the peak areas of digestion products common between two digestion conditions at a minimum.
| Digestion Product | Peak area | ||||
|---|---|---|---|---|---|
| Sequence | RT | m/z | 0.001 μg | 0.006 μg | 0.055 μg |
| UUCGCp | 23.4 | 792 | 1.90E+06 | 1.01E+07 | 5.81E+05 |
| CAGAAp | 25.6 | 826 | 3.51E+05 | 3.27E+06 | n.d. |
| A[m2G]CUCp | 26.8 | 810 | 7.01E+06 | 1.21E+07 | n.d. |
| AG[D][D]GGp | 27.8 | 998 | 4.39E+05 | 2.50E+06 | 6.12E+05 |
| GCGGAp | 28.6 | 883 | 2.00E+06 | 3.23E+06 | n.d. |
| UUCGCACC>p | 30.95 | 1253 | n.d. | 1.20E+07 | 1.29E+06 |
| [yW]A[ψ]p | 32.1 | 1222 | 7.28E+05 | 2.34E+06 | 9.61E+04 |
| CAGDDGGGAGAGp | 32.9 | 1332 | 2.31E+06 | 4.24E+06 | 1.42E+05 |
| [Cm]U[Gm]AA[yW]A[ψ]p | 34.3 | 1378 | 8.01E+06 | 9.14E+06 | 9.70E+04 |
| UCAG[D][D]GGGAGAGC[m2,2G]p | 34.6 | 1660 | 3.41E+06 | 3.14E+07 | n.d. |
>p=cyclic phosphate; n.d.=digestion product not detected; m2G = N2-methylguanosine; D = dihydrouridine; yW =wybutosine; ψ = pseudouridine; Cm = 2’-O-methylcytidine; Gm = 2’-O-methylguanosine; m2,2G = N2,N2-dimethylguanosine1
In terms of incubation period, similar digestion products were again generated (Table 2). Incubation for 30 minutes generated the most useful sequence coverage information. At a short duration, such as 10 minutes, the digestion products generated are similar with comparable peak areas. Longer enzyme incubation does result in tRNA cleavage, however fewer overall digestion products resulted, which were of low abundance and less useful for improving sequence coverage.
Table 2.
Comparison of peak areas of digestion products of S. cerevisiae tRNA-Phe incubated with E49A for different digestion periods. The list shows the peak areas of digestion products common between two digestion conditions at a minimum.
| Digestion Product | Peak area | ||||
|---|---|---|---|---|---|
| Sequence | RT | m/z | 10 min | 30 min | 120 min |
| UUCGCp | 23.4 | 792 | 3.38E+05 | 1.01E+07 | n.d. |
| CAGAAp | 25.6 | 826 | 4.13E+05 | 3.27E+06 | 3.43E+05 |
| A[m2G]CUCp | 28.6 | 810 | 3.24E+06 | 1.21E+07 | n.d. |
| AG[D][D]GGp | 27.79 | 998 | 2.50E+06 | 5.80E+05 | n.d. |
| GCGGAp | 28.59 | 883 | 1.95E+06 | 3.23E+06 | n.d. |
| UUCGCACC>p | 30.95 | 1253 | 1.18E+07 | 7.36E+05 | n.d. |
| [yW]A[ψ]p | 32.1 | 1222 | n.d. | 2.34E+06 | 1.77E+05 |
| CAG[D][D]GGAGAp | 32.89 | 1332 | 8.53E+05 | 4.24E+06 | 2.80E+05 |
| [Cm]U[Gm]AA[yW]A[ψ]p | 34.27 | 1378 | 6.52E+07 | 9.14E+06 | n.d. |
| UCAG[D][D]GGGAGAGC[m2,2G]p | 34.56 | 1660 | 2.70E+06 | 3.14E+06 | n.d. |
>p=cyclic phosphate; n.d.=digestion product not detected; m2G = N2-methylguanosine; D = dihydrouridine; yW =wybutosine; ψ = pseudouridine; Cm = 2’-O-methylcytidine; Gm = 2’-O-methylguanosine; m2,2G = N2,N2-dimethylguanosine1
Incubation temperature yielded a dramatic impact on the mutant’s enzymatic properties. Digestion was conducted at 37 °C and 65 °C, where the latter temperature is that previously used for wild type RNase U2. At the higher temperature, shorter digestion products are generated. The difference in the identities of the digestion products formed at different temperatures generated information that covered different regions of the tRNA (Figure 2). Combining the information from the two different temperatures led to complete sequence coverage, providing confidence that a single enzyme of limited specificity could have utility in RNA modification mapping experiments.
Figure 2.

Secondary structure and detected sequence coverage of S. cerevisiae tRNA-Phe when digested using the RNase U2 E49A mutant A. Digestion at 37 °C and B. Digestion at 65 °C. Overall sequence coverage of tRNA from LC-MS/MS analysis is underlined.
3.2. Application for RNA Modification Mapping
Based on data obtained from amount, time and temperature studies, the E49A mutant appeared to generate digestion products that are much longer than typically observed when using base-specific RNases while also being insensitive to modified nucleosides. An example of this is shown in Figure 3. Figure 3A shows the fragmentation pattern of the 8-mer digestion product, AG[D][D]GGGA, from tRNA-Phe. This digestion product is a subset of an even longer digestion product, the 12-mer CAG[D][D]GGGAGAG, which was also detected in the mixture (Figure 3B). These longer, overlapping digestion products provide increased confidence in RNA modification mapping in two ways: (1) the longer products more specifically define the RNA sequence region from which the modification(s) arose; and (2) overlapping digestion products provide independent confirmation on RNA modification identities and levels.
Figure 3.

A. Extracted ion chromatogram (XIC) for m/z 1336 corresponding to the S. cerevisiae tRNA-Phe digestion product AG[D][D]GGGA. B. CID mass spectrum of m/z 1336 with fragmentation assignments supporting the digestion product annotation. C. XIC for m/z 1332 corresponding to the S. cerevisiae tRNA-Phe digestion product CAG[D][D]GGGAGAG. D. CID mass spectrum of m/z 1332 with fragmentation assignments supporting the digestion product annotation.
To determine whether the results obtained using the mutant E49A were substrate dependent, another modified RNA, E. coli tRNA-Tyr, was also digested and analyzed by LC-MS/MS. Different amounts of enzyme were used to digest the tRNA for 30 minutes at 37 °C. Figure 4 summarizes the sequence coverage by LC-MS/MS for these two analyses. Similar to what was found using tRNAPhe, the enzyme generates relatively longer, overlapping digestion products from tRNA-Tyr that can improve sequence coverage.
Figure 4.

Secondary structure and detected sequence coverage of E. coli tRNA-Tyr when digested using the RNase U2 E49A mutant. A. Digestion using 1 ng enzyme. B. Digestion using 3 ng enzyme. C. Digestion using 5 ng enzyme. D. Combined sequence coverage for three prior digestions. Overall sequence coverage of tRNA from LC-MS/MS analysis is underlined.
To confirm that the utility of this mutant arises from its ability to generate longer and overlapping digestion products that lead to complete sequence coverage for the two tRNA substrates tested, we performed comparable digests using both RNase T1 and the wild type RNase U2. Experiments were conducted under enzyme-optimized conditions, except that both of these enzymes were also incubated at two temperatures with the LC-MS/MS data combined in each case. Table 3 demonstrates that the mutant RNase has benefits over RNase T1, which is the gold standard in RNA modification mapping by mass spectrometry, and provides nearly 20% more sequence coverage than the codon-optimized RNase U2.
Table 3.
Sequence coverage of S. cerevisiae tRNA-Phe after digestion using RNase T1, wild type RNase U2 and the mutant RNase U2 (E49A). RNase T1 digestions were conducted at 20 and 37 °C. Codon-optimized and mutant RNase U2 digestions were conducted at 37 and 65 °C. The mapped digestion products at both temperatures were combined to determine the total sequence coverage for each enzyme.
| Ribonuclease | Sequence Coverage (%) |
|---|---|
| RNase T1 | 80 |
| Codon-optimized RNase U2 | 89 |
| Mutant RNase U2 (E49A) | 100 |
Having confirmed this mutant RNase U2 could be used for RNA modification mapping with the advantage of generating overlapping digestion products of longer length than typically found with base specific RNases, we next sought to determine whether another experimental variable could increase sequence coverage without resorting to additional experimental steps. Because the two digestion temperatures (37 °C and 65 °C) were found to yield complementary digestion patterns for the two different tRNAs already studied, we also wondered if a temperature ramp during digestion could yield similar results from only a single analysis. Several different temperature ramp conditions were investigated (Supplemental Figure S22). The optimal configuration was a linear temperature gradient from 28 °C to 65 °C, although the other variations were also effective at generating overlapping digestion products. One key variable identified in these temperature studies was the incubation period – shorter digestion periods were more likely to yield longer digestion products providing more sequence coverage in a single analysis.
After identifying the appropriate temperature gradient, the optimal enzyme to substrate ratio was also investigated (Supplemental Table S1). Similar to the other optimization experiments with the E49A mutant performed in this study, there was a trade-off between digestion product length and enzyme amount. Too little enzyme (with all other conditions fixed) resulted in less than complete sequence coverage due to undigested tRNA. Too much enzyme resulted in a greater number of smaller length digestion products. Regardless, these conditions and the various enzyme amounts investigated all resulted in greater sequence coverage than could be obtained by RNase T1 (Table 3) suggesting this RNase U2 mutant will be another useful enzyme for RNA modification mapping strategies. Overall, this RNase U2 mutant enabled non-specific digestion of single tRNAs when incubated within a temperature gradient of short duration. These overlapping digestion products could be used to readily reconstruct the original tRNA sequence, with multiple overlapping placement of modified nucleosides in the tRNA sequence.
4. Conclusions
The sole use of a non-specific ribonuclease for RNA modification mapping by mass spectrometry has not been explored previously. We have generated a mutant of RNase U2 and identified optimized conditions that provide the greatest analytical utility for RNA modification mapping applications. This RNase U2 mutant has limited base specificity and a tendency to undercut RNA, which leads to longer overlapping digestion products as compared to common base specific RNases. The robustness of this mutant enzyme allows one to create a digestion temperature gradient, which when applied over short durations, maximized the RNA modification mapping information obtained from a single LC-MS/MS analysis. The application of this enzyme with appropriately developed bioinformatics tools suggests that complete characterization of modified RNAs can be accomplished under single incubation conditions. Future extension of this methodology with enhanced software onto more complex RNA mixtures could significantly reduce sample requirements, improve modification placement confidence, and enable more challenging samples to be characterized.
Supplementary Material
Highlights.
A non-specific RNase U2 mutant has been identified
This mutant is temperature robust, allowing new digestion strategies for RNA modification mapping by mass spectrometry
Optimizing the digestion conditions enables generation of longer, overlapping digestion products, which improves identification of modified nucleosides in RNA
ACKNOWLEDGMENTS
Financial support for this work is provided by the National Institutes of Health (NIH GM058843). The generous support of the Rieveschl Eminent Scholar Endowment and the University of Cincinnati for these studies is also appreciated.
Footnotes
Publisher's Disclaimer: This is a PDF file of an unedited manuscript that has been accepted for publication. As a service to our customers we are providing this early version of the manuscript. The manuscript will undergo copyediting, typesetting, and review of the resulting proof before it is published in its final form. Please note that during the production process errors may be discovered which could affect the content, and all legal disclaimers that apply to the journal pertain.
REFERENCES
- 1.Boccaletto P, et al. , MODOMICS: a database of RNA modification pathways. 2017 update. Nucleic Acids Res, 2018. 46(D1): p. D303–D307. [DOI] [PMC free article] [PubMed] [Google Scholar]
- 2.Kowalak JA, et al. , A novel method for the determination of post-transcriptional modification in RNA by mass spectrometry. Nucleic Acids Res, 1993. 21(19): p. 4577–85. [DOI] [PMC free article] [PubMed] [Google Scholar]
- 3.Helm M and Motorin Y, Detecting RNA modifications in the epitranscriptome: predict and validate. Nat Rev Genet, 2017. 18(5): p. 275–291. [DOI] [PubMed] [Google Scholar]
- 4.Waghmare SP and Dickman MJ, Characterization and quantification of RNA post-transcriptional modifications using stable isotope labeling of RNA in conjunction with mass spectrometry analysis. Anal Chem, 2011. 83(12): p. 4894–901. [DOI] [PubMed] [Google Scholar]
- 5.Puri P, et al. , Systematic identification of tRNAome and its dynamics in Lactococcus lactis. Mol Microbiol, 2014. 93(5): p. 944–56. [DOI] [PMC free article] [PubMed] [Google Scholar]
- 6.Gaston KW and Limbach PA, The identification and characterization of non-coding and coding RNAs and their modified nucleosides by mass spectrometry. RNA Biol, 2014. 11(12): p. 1568–85. [DOI] [PMC free article] [PubMed] [Google Scholar]
- 7.Addepalli B, Lesner NP, and Limbach PA, Detection of RNA nucleoside modifications with the uridine-specific ribonuclease MC1 from Momordica charantia. RNA, 2015. 21(10): p. 1746–56. [DOI] [PMC free article] [PubMed] [Google Scholar]
- 8.Houser WM, et al. , Combining recombinant ribonuclease U2 and protein phosphatase for RNA modification mapping by liquid chromatography-mass spectrometry. Analytical Biochemistry, 2015. 478: p. 52–58. [DOI] [PubMed] [Google Scholar]
- 9.Ross RL, Cao X, and Limbach PA, Mapping Post-Transcriptional Modifications onto Transfer Ribonucleic Acid Sequences by Liquid Chromatography Tandem Mass Spectrometry. Biomolecules, 2017. 7(1). [Google Scholar]
- 10.Addepalli B, et al. , Novel ribonuclease activity of cusativin from Cucumis sativus for mapping nucleoside modifications in RNA. Anal Bioanal Chem, 2017. 409: p. 5645–5654. [DOI] [PMC free article] [PubMed] [Google Scholar]
- 11.Pomerantz SC, Kowalak JA, and McCloskey JA, Determination of oligonucleotide composition from mass spectrometrically measured molecular weight. J Am Soc Mass Spectrom, 1993. 4(3): p. 204–9. [DOI] [PubMed] [Google Scholar]
- 12.Arima T, Uchida T, and Egami F, Studies on extracellular ribonucleases of Ustilago sphaerogena. Characterization of substrate specificity with special reference to purine-specific ribonucleases. Biochem J, 1968. 106(3): p. 609–13. [DOI] [PMC free article] [PubMed] [Google Scholar]
- 13.Arima T, Uchida T, and Egami F, Studies on extracellular ribonucleases of Ustilago sphaerogena. Purification and properties. Biochem J, 1968. 106(3): p. 601–7. [DOI] [PMC free article] [PubMed] [Google Scholar]
- 14.Sato S and Uchida T, The amino acid sequence of ribonuclease U2 from Ustilago sphaerogena. Biochem J, 1975. 145(2): p. 353–60. [DOI] [PMC free article] [PubMed] [Google Scholar]
- 15.Noguchi S, et al. , Crystal structure of Ustilago sphaerogena ribonuclease U2 at 1.8 A resolution. Biochemistry, 1995. 34(47): p. 15583–91. [DOI] [PubMed] [Google Scholar]
- 16.Kanaya S and Uchida T, Revised sequence of ribonuclease U2 in the substrate-binding region. J Biochem, 1995. 118(4): p. 681–2. [DOI] [PubMed] [Google Scholar]
- 17.Glitz DG and Dekker CA, Studies on a Ribonuclease from Ustilago Sphaerogena. I. Purification and Properties of the Enzyme. Biochemistry, 1964. 3: p. 1391–9. [DOI] [PubMed] [Google Scholar]
- 18.Glitz DG and Dekker CA, Studies on a Ribonuclease Fromustilago Sphaerogenna. Ii. Specificity of the Enzyme. Biochemistry, 1964. 3: p. 1399–406. [DOI] [PubMed] [Google Scholar]
- 19.Hashimoto J, Uchida T, and Egami F, Action of ribonucleases T1, T2, and U2 on dinucleoside monophosphates containing 7-deazapurine base. Biochim Biophys Acta, 1970. 199(2): p. 535–6. [DOI] [PubMed] [Google Scholar]
- 20.Uchida T, Arima T, and Egami F, Specificity of RNase U2. J Biochem, 1970. 67(1): p. 91–102. [DOI] [PubMed] [Google Scholar]
- 21.Noguchi S, Conformational variation revealed by the crystal structure of RNase U2A complexed with Ca ion and 2’-adenylic acid at 1.03 A resolution. Protein Pept Lett, 2010. 17(12): p. 1559–61. [DOI] [PubMed] [Google Scholar]
- 22.Noguchi S, Isomerization mechanism of aspartate to isoaspartate implied by structures of Ustilago sphaerogena ribonuclease U2 complexed with adenosine 3’-monophosphate. Acta Crystallogr D Biol Crystallogr, 2010. 66(Pt 7): p. 843–9. [DOI] [PubMed] [Google Scholar]
- 23.Noguchi S, Structural changes induced by the deamidation and isomerization of asparagine revealed by the crystal structure of Ustilago sphaerogena ribonuclease U2B. Biopolymers, 2010. 93(11): p. 1003–10. [DOI] [PubMed] [Google Scholar]
- 24.Alvarez-Garcia E, et al. , Influence of key residues on the heterologous extracellular production of fungal ribonuclease U2 in the yeast Pichia pastoris. Protein Expr Purif, 2009. 65(2): p. 223–9. [DOI] [PubMed] [Google Scholar]
- 25.Martinez-Ruiz A, et al. , Ribonuclease U2: cloning, production in Pichia pastoris and affinity chromatography purification of the active recombinant protein. FEMS Microbiol Lett, 2000. 189(2): p. 165–9. [DOI] [PubMed] [Google Scholar]
- 26.Anand P, et al. , ABS-Scan: In silico alanine scanning mutagenesis for binding site residues in protein-ligand complex. F1000Res, 2014. 3: p. 214. [DOI] [PMC free article] [PubMed] [Google Scholar]
- 27.Chronopoulou EG and Labrou NE, Site-saturation mutagenesis: a powerful tool for structure-based design of combinatorial mutation libraries. Curr Protoc Protein Sci, 2011. Chapter 26: p. Unit 26.6. [DOI] [PubMed] [Google Scholar]
- 28.Sample PJ, et al. , RoboOligo: software for mass spectrometry data to support manual and de novo sequencing of post-transcriptionally modified ribonucleic acids. Nucleic Acids Res, 2015. 43(10): p. e64. [DOI] [PMC free article] [PubMed] [Google Scholar]
- 29.Yu N, et al. , RNAModMapper: RNA Modification Mapping Software for Analysis of Liquid Chromatography Tandem Mass Spectrometry Data. Anal Chem, 2017. 89(20): p. 10744–10752. [DOI] [PubMed] [Google Scholar]
- 30.Cao X and Limbach PA, Enhanced detection of post-transcriptional modifications using a mass-exclusion list strategy for RNA modification mapping by LC-MS/MS. Anal Chem, 2015. 87(16): p. 8433–40. [DOI] [PMC free article] [PubMed] [Google Scholar]
- 31.Hossain M and Limbach PA, Mass spectrometry-based detection of transfer RNAs by their signature endonuclease digestion products. RNA, 2007. 13(2): p. 295–303. [DOI] [PMC free article] [PubMed] [Google Scholar]
Associated Data
This section collects any data citations, data availability statements, or supplementary materials included in this article.