

Abstract
Background:
Cortical spreading depolarization (CSD) is a phenomenon classically associated with migraine aura. CSDs have also been implicated in secondary injury following ischemic stroke, intracerebral hemorrhage, subarachnoid hemorrhage, and traumatic brain injury; however, most investigations involving these disease processes do not account for the occurrence of CSDs. A major barrier to detection of CSDs in experimental models is that currently validated methods are invasive and require specialized equipment and a high level of expertise to implement.
New Method:
We present a low-cost, easy-to-implement approach to the detection of CSDs in the mouse through full-thickness intact skull. Our method uses the optical intrinsic signal from white light illumination (OIS-WL) and allows for real-time in vivo detection of CSDs using readily available USB cameras.
Results:
OIS-WL detected 100% of CSDs that were seen with simultaneous electrode recording (69 CSDs in 28 mice), laser Doppler flowmetry (82 CSDs in 10 mice), laser speckle flowmetry (68 CSDs in 25 mice), or combined electrode recording plus laser speckle flowmetry (29 CSDs in 20 mice). OIS-WL detected 1 additional CSD that was missed by laser Doppler flowmetry.
Comparison with Existing Methods:
OIS-WL is less invasive than electrophysiological recordings and easier to implement than laser speckle flowmetry. Moreover, it provides excellent spatial and temporal resolution for dynamic imaging of CSDs in the setting of brain injury.
Conclusions:
Detection of CSDs with an inexpensive USB camera and white light source provides a reliable method for the in vivo and non-invasive detection of CSDs through unaltered mouse skull.
Keywords: Cortical spreading depression, optical intrinsic signal imaging, migraine, stroke, non-invasive
1. Introduction
Cortical spreading depolarization (CSD)—also known as cortical spreading depression—is a massive neuronal and glial depolarization which slowly spreads across the surface of the brain (Ayata and Lauritzen, 2015). The phenomenon was originally implicated in migraine aura (Ayata, 2013) and has more recently been associated with poor outcome in human studies of acute brain injury (Flartings et al., 2016).
Even when CSD is not the primary focus of an investigation, it is a common confounder where CSDs could be inadvertently induced, with profound effects on all brain cells including the cerebral vasculature. Therefore, there is need for an easy, reliable, and non-invasive method to detect CSDs using non-specialized equipment so that any investigator who suspects occurrence of CSDs in their model can verify their presence or absence.
We present an economical approach that utilizes USB cameras to detect CSDs using a white light source through the intact mouse skull. We validate our approach using specialized DC electrode recordings, laser Doppler flowmetry, and laser speckle flowmetry to give other investigators the ability to detect CSDs without the need for a high level of expertise or specialized equipment.
2. Materials and Methods
2.1. Mice and CSD induction.
All experiments were performed in accordance with the Guide for Care and Use of Laboratory Animals (NIH Publication No. 85–23,1996). All protocols were approved by the Institutional Animal Care and Use Committee (MGH Subcommittee on Research Animal Care). C57BL/6J or CD1 mice (Charles River Laboratories, Wilmington, MA, USA) were used. Animals (male and female, 12 weeks to 1 year old) were anesthetized with isoflurane (5% induction, 1–1.5% maintenance) and were maintained spontaneously breathing on a mixture of 70% N2/30% O2 or 70% N2O/30% O2. Lubricating ointment was applied to protect eyes. Heads were fixed in a stereotaxic frame. The skull was exposed after a midline scalp incision. Mineral oil was applied to the skull surface while clearing it of overlying connective tissue. Care was taken to prevent drying of the skull by reapplying mineral oil. After approximately 10 minutes, penetration of mineral oil into the skull was complete and the skull maintained enough translucency for intrinsic signal (visible light) and laser speckle flowmetry (LSF) detection methods. Cameras and light sources were positioned to minimize glare from the surface of the skull. In a subset of experiments, a chronic imaging window was prepared as previously described (Silasi et al., 2016; Chung et al., 2018).
CSDs were induced using multiple previously established methods. In 83 mice, 16 CSDs were induced with potassium chloride (KCl), 17 with pinprick, 32 with distal middle cerebral artery occlusion ischemic stroke (dMCAO), 21 with filament middle cerebral artery occlusion ischemic stroke (fMCAO), and 162 using non-invasive optogenetic light stimulation.
The procedure for the induction of CSDs using KCl, pinprick, and ischemic stroke has been described elsewhere (Ayata, 2013; Houben et al., 2016; Oka et al., 2016; Chung et al., 2018). In brief, a burr hole was drilled with carbon steel burr (0.5 mm or 0.7 mm, 19007–05 or 1900707, Fine Science Tools, Foster City, CA, USA) and cordless micro-drill (Ideal Micro-Drill, RS- 6300A, Roboz, Gaithersburg, MD, USA) over motor, whisker barrel, or visual cortex for KCl and pinprick experiments. For KCl induction, a small cotton ball approximating the size of the burr hole was soaked with up to 1M KCl and placed over the burr hole. For pinprick induction, a needle or fine glass pipette tip was inserted through the burr hole.
Ischemic stroke was induced with the distal middle cerebral artery occlusion (dMCAO) and filament middle cerebral artery occlusion methods (fMCAO). For dMCAO induction, mice were anesthetized, placed in a stereotaxic frame, and scalp and periosteum were pulled aside. Bilateral intact skull was covered with a thin layer of mineral oil to prevent drying and enhance transparency. Optical intrinsic signal from white light illumination (OIS-WL) and LSF (see below) imaging was started to detect any inadvertent CSDs during surgery. The temporalis muscle was separated from the temporal bone and removed. A 2 mm diameter burr hole was drilled in the temporal bone overlying the distal MCA just above the zygomatic arch. The dura was kept intact and middle cerebral artery was occluded just distal to the inferior cerebral vein using a microvascular clip as described in detail previously (Shin et al., 2006; Eikermann- Haerter et al., 2012). The degree of cortical perfusion was imaged during middle cerebral artery occlusion with LSF through intact skull. Reperfusion was achieved by carefully removing the clip after 60 minutes. Mice were excluded if clip placement or removal was associated with arterial injury and hemorrhage or if reperfusion was not achieved. Intraluminal fMCAO was carried out as described previously in mice (Eikermann-Haerter et al., 2012). In anesthetized mice, a silicone-coated 6–0 nylon monofilament was inserted into the internal carotid artery via the external carotid artery. Occlusion was confirmed using LDF (Perimed, Jarfalla, Sweden) over the ischemic core. Mice were then transferred to a stereotaxic frame in order to measure ischemia-induced CSDs. Scalp and periosteum were pulled aside. The bilateral intact skull was covered with a thin layer of mineral oil to prevent drying and enhance transparency. Simultaneous OIS-WL and LSF were started approximately 15 minutes after the onset of fMCAO. The filament was removed 60 min after the onset of fMCAO (reperfusion).
For optogenetic induction of CSDs, Thy1-ChR2-YFP mice (B6.Cg-Tg(Thy1- COP4/EYFP)9Gfng/J or B6.Cg-Tg(Thy1-COP4/EYFP)18Gfng/J, Jackson Laboratories, Bar Harbor, ME, USA) were used. Detailed methods for optogenetic induction of CSDs are described elsewhere (Houben et al., 2016; Chung et al., 2018). In brief, stimulation light was delivered to the transgenic Thy1 -ChR2-YFP mice via a 400 pm diameter fiber connected to a 470 nm LED (LED: MF470F3; LED driver: DC2100; Thorlabs, Newton, NJ, USA). Continuous light stimulation of up to 10 mW for 20 seconds was used. Light-induced CSDs were preferentially induced in motor and whisker barrel cortices as these have lower thresholds for stimulation than medial somatosensory or visual cortices, which were also used (Chung et al., 2018).
2.2. Intrinsic signal imaging detection.
The focus of this paper is on the detection of CSDs using the OIS-WL method. Two methods were used to acquire and process OIS-WL. In the first method, a UVC-compliant webcam (OT-HD, Opti-TekScope, Chandler, AZ, USA, $77.95 at Amazon.com, CMOS sensor, resolution 1600×1200) was used, which was able to directly interface with MATLAB after installing the Support Package for USB Webcams (Mathworks, version 2017a, Natick, MA, USA). Either white light LEDs integrated in the camera or ambient fluorescent room light was used for illumination and adjusted to allow for acceptable image quality. MATLAB-based software was developed to permit adjustment of the acquisition frame rate and the time elapsed between calculated difference jpeg images. Difference images were generated from the green channel of the jpeg every 1–10 seconds using the imsubtract function. Images were output in real time and stored in a circular buffer comprised of 15 frames (Supplemental Data 1). In the second method, a USB camera which was not able to directly interface with MATLAB was used (MU300, AmScope, Irvine, CA, USA, $115.50 at Amscope.com, Aptina MT9T001 CMOS sensor, 8-bit, resolution 2048×1536). Time-lapse images were taken every 2–10 seconds with the software included with the USB camera. The images were saved as jpeg files and a MATLAB script was written to periodically check the folder and generate difference images as above (Supplemental Data 2). For both acquisition methods, exposure times were adjusted either automatically by the camera software or manually to allow for adequate jpeg picture exposure. Finally, an additional MATLAB script was written to allow for post-hoc review of existing images (Supplemental Data 3). CSDs were identified using the difference images based on the characteristic morphology of the spreading wave front and validated with conventional CSD detection methods. The area of the CSD wave front seen on difference images can be enhanced by increasing the duration between subtracted images. The contrast of the difference images was determined by the MATLAB script or adjusted manually through MATLAB prompts.
2.3. Conventional CSD detection methods.
Methods for the detection of CSDs using DC potential recordings, laser Doppler flowmetry (LDF), and laser speckle flowmetry (LSF) have been previously described by our laboratory (Oka et al., 2016). In brief, DC records were obtained by inserting a Ag/AgCI glass capillary microelectrode containing 0.9% (w/v) NaCI solution inserted 200 pm through a burr hole in the skull and a reference electrode inserted into the neck, connected to a differential amplifier (Axoprobe 1A or Dagan EX-1). LDF measurements utilized an ML191 LDF probe (ADInstruments, Colorado Springs, CO, USA).
DC records and LDF signals were obtained at 1–4 kHz and further processed with a PowerLab 16/SP (ADInstruments) and visualized with LabChart software (ADInstruments). LSF images were obtained by analyzing the widefield speckle pattern generated by a 780 nm laser diode using a custom software program (Dunn et al., 2001). Data were acquired every 3–4 seconds. Relative blood flow maps were obtained with respect to a pre-CSD baseline.
3. Results
We validated the ability of our white light source, optical intrinsic signal imaging (OIS-WL) approach to detect CSDs by concurrently using widely-accepted CSD detection methods. The hemodynamic wave of CSD propagation is too slow and subtle to detect in real time with unprocessed visible light images (Figure 1, top panels of A and B). Therefore, it is necessary to generate difference images to detect the presence of a CSD in real time.
Figure 1: Cortical spreading depolarizations (CSD) are reliably detected by optical intrinsic signal imaging with a white light source (OIS-WL) through full thickness intact mouse skull.
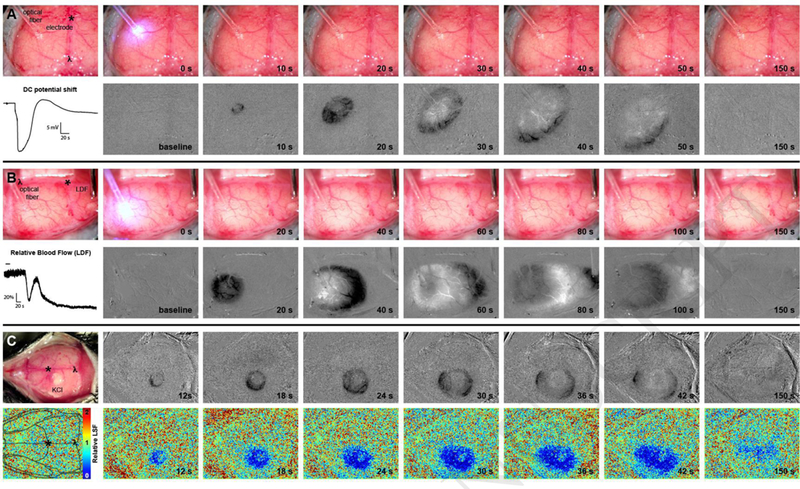
OIS- WL detection of CSDs was validated with simultaneous detection using (A) DC electrode recording, (B) laser Doppler flowmetry (LDF), and (C) laser speckle flowmetry (LSF). (A,B) An optical fiber delivers blue light for optogenetic induction of CSDs. Upper panels are full color RGB jpeg images from a USB camera. Bottom panels show grayscale difference images using only the green channel of the jpeg image. Dark areas denote decreased blood volume and lighter areas denote increased blood volume. (A) A DC potential shift during a CSD recorded from an electrode is shown. Images were taken every 2 seconds and difference images where generated by subtracting the prior image. (B) A relative blood flow trace during a CSD from a LDF probe is shown. Images were taken every 10 seconds and the difference images where generated by subtracting the prior image. (C) A cotton ball soaked in 1 M KCI overlying a burr hole induces a CSD. Difference images are in the top panels. Images were taken every 1 second and the difference images were generated by subtracting the image 3 frames prior (i.e. 3 seconds prior). LSF maps are in the bottom panels. A mouse skull schematic is overlaid on a baseline LSF image to provide orientation and a relative LSF color map is shown to indicate relative blood flow. Bregma is indicated with an asterix (*) and lambda with λ on full color visible light images and on the baseline LSF map. A relative scale is indicated by 1 mm graph paper (pink markings, 4 mm shown between bregma and lambda) in the upper panels of (B).
We used a moving reference to create difference images by defining the number of frames between the image of interest and a prior baseline image. The moving reference has advantages over a fixed reference image. For example, no fixed reference has to be chosen and possibly re-chosen by the experimenter, and artifacts caused by drift in the camera over time are minimized. We did not need to use image averaging as each image generated with our USB cameras provided adequate exposure and signal-to-noise. We were able to detect CSDs with time differences of 1–10 seconds between subtracted frames. Longer time differences had the advantage of showing a greater area of signal change. Figure 1 shows representative experiments of the OIS-WL approach with simultaneous electrode, LDF, and LSF recordings. Difference OIS-WL images reliably demonstrate the spatiotemporal characteristics of a CSD. We have made the MATLAB code for either real-time or post-hoc detection of CSDs using intrinsic signal imaging available as unrestricted, open scripts (Supplemental Data 1,2, and 3).
Out of 83 mice and 248 CSDs, we found that 100% of CSDs detected by electrophysiology, LDF, or LSF were also detected by OIS-WL (Figure and Table). Notably, there was 1 CSD which was detected by visible light which was not detected by LDF (Table), due to placement of the LDF probe in a position medial to the propagating CSD wave (Supplemental Figure). Consistent with prior observations, there were no sex differences in detection of CSDs using any of the techniques. We also did not observe an age effect. Mineral oil allowed for sufficient transparency to detect CSDs with OIS-WL in all mice tested, up to 1 year old.
Table.
CSDs detected by standard measures versus white light optical intrinsic signal (OIS- WL) imaging.
| Standard Measures | Standard Measure % (Detected / Actual) |
Intrinsic Signal % (Detected / Actual) |
|---|---|---|
| Electrophysiology N = 128 mice |
100% (69/69) |
100% (69/69) |
| Laser Doppler Flowmetry N = 10 mice |
98.8% (81/82) |
100% (82/82) |
| Laser Speckle Flowmetry N = 25 mice |
100% (68/68) |
100% (68/68) |
| Electrophysiology and Laser Speckle Flowmetry N = 20 mice |
100% (29/29) |
100% (29/29) |
4. Discussion
We detected CSDs in live mice, non-invasively through full thickness intact skull, and with high sensitivity using inexpensive USB cameras, a white light source, and real-time MATLAB processing. Our method, OIS-WL, has the advantage of requiring no specialized equipment and is ideally suited for experiments where the simple detection of CSDs is warranted.
Notably, OIS-WL could be adapted to awake and head-fixed animals with chronic intact skull imaging preparations, allowing for repeated recording sessions and greatly advancing the practical use of this technique (Chung et al., 2018).
Characterization of cerebral hemodynamics using the intrinsic signal (utilizing visible light) has a long history (Grinvald et al., 1986). In vivo quantification of hemoglobin concentrations during a CSD has been well described but generally requires multiple monochromatic light sources and a high degree of expertise to obtain and interpret (Yuzawa et al., 2012; Santos et al., 2014; Ma et al., 2016). A recent report describes off-line detection of CSDs with an unfiltered light source in mouse using a thinned skull preparation, high sensitivity CCD camera, and a sophisticated lens system (Kaufmann et al., 2017). Our group has used intrinsic signal imaging with a white light source to determine thresholds of CSDs to characterize a new optogenetic mouse model (Chung et al., 2018). The strength of our approach is that CSDs can be detected in real time through the full thickness of the mouse skull (no thinning required) and utilizes inexpensive optics available to anyone. However, we are not aware of existing implementations that utilize a similar approach to real time detection of CSDs.
The hemodynamic effects of CSDs in mouse brain have been well described and previously reviewed (Ayata and Lauritzen, 2015). Our OIS-WL approach reproduces previous findings of the hemodynamic changes in mice, namely, that with the first CSD there is an immediate oligemia, followed by transient hyperemia and a long-lasting oligemia (Figure 1, panel B, second column). This is apparent on OIS-WL images where black represents relative oligemia and white represents relative hyperemia.
A limitation of our approach is that it does not allow for the quantification of underlying hemoglobin concentrations or blood flow changes. This is due to the use of a white light source, which we use so that the approach can be widely adopted. Therefore, if the intent of study is to quantify hemodynamic effects of a CSD, such as the temporal evolution of oligemia and hyperemia, then traditional approaches using filtered light and analysis based on the modified Beer-Lambert Law should be undertaken (Ma et al., 2016). There are additional limitations of our study. We did not calculate the propagation speed of the CSD using OIS-WL as we did not include a scale in all experiments; therefore, our method is not yet validated as a way to measure CSD propagation speed. Finally, we recognize that there may be concerns about the sensitivity of our method in the hands of those who have never before detected CSDs. Therefore, investigators who are new to the study of CSDs and wish to implement the OIS-WL approach should induce a CSD (via the pinprick method through a burr hole, for example) as a positive control.
In conclusion, CSDs can be reliably detected non-invasively in live mice using a low-cost system requiring no specialized equipment. We envision that the OIS-WL technique will facilitate detection of CSDs by laboratories not accustomed to detecting CSDs in a wide range of mouse studies where non-invasive methods are necessary. We believe that our approach will have an impact on the emerging role of CSDs in human disease including migraine aura, ischemic stroke, intracerebral hemorrhage, subarachnoid hemorrhage, and traumatic brain injury.
Supplementary Material
HIGHLIGHTS:
Cortical spreading depolarizations are reliably detected in vivo through the intact, full thickness mouse skull with a USB camera and white light source.
We validate our approach with specialized methods such as direct current (DC) electrode recording, laser Doppler flowmetry, and laser speckle flowmetry.
This low-cost and easy-to-implement method enables any investigator to detect cortical spreading depolarizations in their experimental mouse model.
Acknowledgements
Funding was provided by the National Institute of Neurological Disorders and Stroke at the National Institutes of Health (R25NS065743 to D.Y.C., R00AG042026 to M.A.Y., NS091499 to N.H., R01NS091230 and R01MH111359 to S.S., and P01NS055104 and R01NS102969 to C.A.); the Lawrence M. Brass Stroke Research Award from the American Heart Association and American Brain Foundation (18POST34030369 to D.Y.C); the Brain Aneurysm Foundation’s Timothy P. Susco and Andrew David Heitman Foundation Chairs of Research to D.Y.C.; the Aneurysm and AVM Foundation to D.Y.C.; the International Headache Society to H.S.; the Japanese Heart Foundation and the Bayer Yakuhin Research Grant Abroad to F.O.; and Fondation Leducq, the Heitman Foundation, and the Ellison Foundation to C.A. We thank Saef Izzy for comments on the manuscript.
Abbreviations:
- CSD
cortical spreading depolarization or cortical spreading depression
- LDF
laser Doppler flowmetry
- LSF
laser speckle flowmetry
- OIS-WL
white light source optical intrinsic signal
Footnotes
Publisher's Disclaimer: This is a PDF file of an unedited manuscript that has been accepted for publication. As a service to our customers we are providing this early version of the manuscript. The manuscript will undergo copyediting, typesetting, and review of the resulting proof before it is published in its final citable form. Please note that during the production process errors may be discovered which could affect the content, and all legal disclaimers that apply to the journal pertain.
References
- Ayata C (2013) Pearls and pitfalls in experimental models of spreading depression. Cephalalgia : an international journal of headache 33:604–613. [DOI] [PubMed] [Google Scholar]
- Ayata C, Lauritzen M (2015) Spreading Depression, Spreading Depolarizations, and the Cerebral Vasculature. Physiological reviews 95:953–993. [DOI] [PMC free article] [PubMed] [Google Scholar]
- Chung DY, Sadeghian H, Qin T, Lule S, Lee H, Karakaya F, Goins S, Oka F, Yaseen MA, Houben T, Tolner EA, van den Maagdenberg A, Whalen MJ, Sakadzic S, Ayata C (2018) Determinants of Optogenetic Cortical Spreading Depolarizations. Cereb Cortex. [DOI] [PMC free article] [PubMed] [Google Scholar]
- Dunn AK, Bolay H, Moskowitz MA, Boas DA (2001) Dynamic imaging of cerebral blood flow using laser speckle. Journal of cerebral blood flow and metabolism : official journal of the International Society of Cerebral Blood Flow and Metabolism 21:195–201. [DOI] [PubMed] [Google Scholar]
- Eikermann-Haerter K, Lee JH, Yuzawa I, Liu CH, Zhou Z, Shin HK, Zheng Y, Qin T, Kurth T, Waeber C, Ferrari MD, van den Maagdenberg AM, Moskowitz MA, Ayata C (2012) Migraine mutations increase stroke vulnerability by facilitating ischemic depolarizations. Circulation 125:335–345. [DOI] [PMC free article] [PubMed] [Google Scholar]
- Grinvald A, Lieke E, Frostig RD, Gilbert CD, Wiesel TN (1986) Functional architecture of cortex revealed by optical imaging of intrinsic signals. Nature 324:361–364. [DOI] [PubMed] [Google Scholar]
- Hartings JA et al. (2016) The continuum of spreading depolarizations in acute cortical lesion development: Examining Leao’s legacy. Journal of cerebral blood flow and metabolism : official journal of the International Society of Cerebral Blood Flow and Metabolism. [DOI] [PMC free article] [PubMed] [Google Scholar]
- Houben T, Loonen IC, Baca SM, Schenke M, Meijer JH, Ferrari MD, Terwindt GM, Voskuyl RA, Charles A, van den Maagdenberg AM, Tolner EA (2016) Optogenetic induction of cortical spreading depression in anesthetized and freely behaving mice. Journal of cerebral blood flow and metabolism : official journal of the International Society of Cerebral Blood Flow and Metabolism. [DOI] [PMC free article] [PubMed] [Google Scholar]
- Kaufmann D, Theriot JJ, Zyuzin J, Service CA, Chang JC, Tang YT, Bogdanov VB, Multon S, Schoenen J, Ju YS, Brennan KC (2017) Heterogeneous incidence and propagation of spreading depolarizations. Journal of cerebral blood flow and metabolism : official journal of the International Society of Cerebral Blood Flow and Metabolism 37:1748–1762. [DOI] [PMC free article] [PubMed] [Google Scholar]
- Ma Y, Shaik MA, Kim SH, Kozberg MG, Thibodeaux DN, Zhao HT, Yu H, Hillman EM (2016) Wide-field optical mapping of neural activity and brain haemodynamics: considerations and novel approaches. Philos Trans R Soc Lond B Biol Sci 371. [DOI] [PMC free article] [PubMed] [Google Scholar]
- Oka F, Hoffmann U, Lee JH, Shin HK, Chung DY, Yuzawa I, Chen SP, Atalay YB, Nozari A, Hopson KP, Qin T, Ayata C (2016) Requisite ischemia for spreading depolarization occurrence after subarachnoid hemorrhage in rodents. Journal of cerebral blood flow and metabolism : official journal of the International Society of Cerebral Blood Flow and Metabolism. [DOI] [PMC free article] [PubMed] [Google Scholar]
- Santos E, Scholl M, Sanchez-Porras R, Dahlem MA, Silos H, Unterberg A, Dickhaus H, Sakowitz OW (2014) Radial, spiral and reverberating waves of spreading depolarization occur in the gyrencephalic brain. NeuroImage 99:244–255. [DOI] [PubMed] [Google Scholar]
- Shin HK, Dunn AK, Jones PB, Boas DA, Moskowitz MA, Ayata C (2006) Vasoconstrictive neurovascular coupling during focal ischemic depolarizations. Journal of cerebral blood flow and metabolism : official journal of the International Society of Cerebral Blood Flow and Metabolism 26:1018–1030. [DOI] [PubMed] [Google Scholar]
- Silasi G, Xiao D, Vanni MP, Chen AC, Murphy TH (2016) Intact skull chronic windows for mesoscopic wide-field imaging in awake mice. Journal of neuroscience methods 267:141–149. [DOI] [PMC free article] [PubMed] [Google Scholar]
- Yuzawa I, Sakadzic S, Srinivasan VJ, Shin HK, Eikermann-Haerter K, Boas DA, Ayata C (2012) Cortical spreading depression impairs oxygen delivery and metabolism in mice. Journal of cerebral blood flow and metabolism : official journal of the International Society of Cerebral Blood Flow and Metabolism 32:376–386. [DOI] [PMC free article] [PubMed] [Google Scholar]
Associated Data
This section collects any data citations, data availability statements, or supplementary materials included in this article.