

Abstract
Neuroinflammatory diseases, such as multiple sclerosis, are characterized by invasion of the brain with autoreactive T cells. The mechanism of how T cells acquire their encephalitogenic phenotype and trigger disease remains, however, unclear. The existence of lymphatic vessels in the meninges indicates a relevant link between the central nervous system (CNS) and peripheral immune system, perhaps affecting autoimmunity. Here we demonstrate that meningeal lymphatics fulfill two critical criteria - assist in the drainage of cerebrospinal fluid components and enable immune cells to enter draining lymph nodes in a CCR7-dependent manner. Unlike other tissues, meningeal lymphatic endothelial cells do not undergo expansion during inflammation and express a unique transcriptional signature. Notably, the ablation of meningeal lymphatics diminishes pathology and reduces the inflammatory response of brain-reactive T cells during EAE. Our findings demonstrate that meningeal lymphatics govern inflammatory processes and immune surveillance of the CNS and pose a valuable target for therapeutic intervention.
One of the principal phenomena arguing in favor of the brain’s immune privilege is the apparent lack of lymphatic drainage from the brain parenchyma. This was, however, disputed by experimental evidence showing that tracers and proteins injected into the brain parenchyma and/or the cerebrospinal fluid (CSF) found their way to the brain’s peripheral lymph nodes1–3. Intraparenchymal macromolecules were shown to exit the parenchyma mainly via perivascular efflux into the CSF4, while the CSF itself was reported to exit the CNS mainly through arachnoid granulations into the venous system5 and along the neural sheaths of cranial (particularly the olfactory) nerves, using the perineural lymphatics2,3,6.
Although immune cells (with the exception of microglia) have no access to the brain parenchyma under homeostatic conditions, the meninges surrounding the brain are populated by a variety of immune-cell types, which not only provide immune surveillance but also affect brain function7.
The recent demonstration of the presence of functional lymphatic vessels in the brain meninges1,8 raised the possibility of another path for drainage of CSF-contained macromolecules and immune cells directly into the CLNs. The exact route(s) taken by macromolecules and immune cells to exit the CNS, as well as the contribution of each route to the CNS-associated initiation of immune responses, are still a matter of debate9,10. It is important to identify and characterize the route(s) responsible for drainage of CNS-derived antigens, because modulation of these may offer a valuable approach to the treatment of CNS-associated neuroinflammatory conditions.
Here we demonstrate that meningeal lymphatic vessels represent an important drainage route for CNS/CSF-derived soluble molecules and for meningeal immune cells. Meningeal lymphatic endothelial cell transcriptome suggests the unique biology of these cells, compared to lymphatic endothelial cells from other tissues. Lastly, we show that in mice with experimental autoimmune encephalomyelitis (EAE, an animal model of multiple sclerosis), decreasing the lymphatic drainage under neuroinflammatory conditions leads to diminished acquisition of encephalitogenic properties by antigen-specific T cells, with resulting amelioration of clinical symptoms of EAE.
Results
Access of the cerebrospinal fluid to meningeal lymphatic vessels.
In order to examine whether macromolecules from the CSF can directly access meningeal lymphatics, Prox1GFP reporter mice were injected with Qdot655 in the intra-cisterna magna (i.c.m.) and followed the fluorescent tracer within meningeal lymphatics using multiphoton intravital imaging (Fig. 1a, 1b). One hour after Qdot655 injection, tracer was detected within the meningeal lymphatic vessels adjacent to the transverse sinus (Fig. 1c). This observation suggests that while meningeal lymphatic vessels are located in the dura matter of the meninges8,11,12, they have a direct access to the CSF. To investigate the potential entry routes of the CSF into the meningeal lymphatics, fluorescently labeled anti-Lyve-1 antibodies were injected into the CSF and followed through meningeal lymphatics at different time points. Analysis of the whole mount meninges revealed a time-dependent enhancement of immunostaining of the meningeal lymphatic vessels by the i.c.m. injected antibody (Fig. 1d, 1e). Within 5 to 15 min after injection, specific areas of the lymphatics along the transverse sinus (arrows in inset for 5 and 15 min) and the meninges covering the olfactory bulb were labeled with the antibody, suggesting that these areas are the first to have contact with CSF (we term these areas as ‘hot spots’). At later time points, larger areas of meningeal lymphatics were covered by anti-Lyve-1 antibodies. The lymphatic appearance of Lyve-1 antibodies was independent of their speed of injection (Supplementary Fig. 1a). Fluorescent protein, particles (Fig. 1f) or immune cells (Fig. 1g), all accumulate at the same areas along the lymphatic vessels after i.c.m. injection. Exogenously labeled T cells injected i.c.m. accumulate mainly around and inside the meningeal lymphatics of the transverse sinus (Fig. 1h). Interestingly, lymphatics along the middle meningeal artery do not appear to be labeled by the injected antibodies (Fig. 1d, Supplementary Fig. 1a), suggesting these vessels may be draining the dura but not the CSF. Accumulation of fluorescent microparticles is independent of the route of CSF administration, as cisterna magna and lateral ventricle injections resulted in similar accumulation at the hot spots (Supplementary Fig. 1b). Intranasal injection of fluorescent particles leads to only a limited appearance of beads in the meningeal spaces, likely because of the large size of the particles used (Supplementary Fig. 1b).
Figure 1: Meningeal lymphatic sub-arachnoid extensions uptake molecules and immune cells from the cerebrospinal fluid.

a, General scheme of meningeal lymphatic vascular organization. b, Scheme of the experiment presented in (c). Prox1GFP mice were injected into the cisterna magna (i.c.m.) with 5µl of Qdot655. The transverse sinus was imaged through a thinned skull. c, Representative image of meningeal lymphatics adjacent to the transverse sinus (Prox1GFP – green) filled with the i.c.m. injected Qdot655 (red) 60min after injection. The inset represents the coronal view of the lymphatic vessel filled with Qdot655. Scale bar = 65 µm. Representative of 3 independent animals. d, Representative images of the lymphatic vessels co-labeled with i.c.m. injected anti-Lyve-1A488 and exogenously applied anti-Lyve-1A660 at different time points after i.c.m. injection. Arrows in inset at 5 and 15 min illustrate the initial points where the i.c.m. injected anti-Lyve-1A488 labelled the meningeal lymphatics. Scale bar = 1000 µm (upper panel); 250 µm (bottom left panel) 60 µm (bottom right panel). e, Quantification of the percentage of lymphatic vessels labeled by the i.c.m. injected antibody and total lymphatic area at different time points post injection (mean ± s.e.m.; n=4 mice/group). f, Representative images of OVA594 and fluorescent bead accumulation along the lymphatics (Lyve-1 - red) are shown. Arrows point to lymphatic extensions in the area of microbeads and OVA accumulation. Scale bar = 300 µm (upper panel), 120 µm (bottom panels). Representative of 5 independent animals. g, Representative images of the accumulation of exogenously injected T cells (CFSE – green) at the extension-rich regions of lymphatic vessels adjacent to the transverse sinuses 12h after i.c.m. injection. Scale bar = 1000µm (right panel), 200µm (insets) . Representative of 3 independent animals. h, Representative images of exogenously injected T cells (CFSE – green) located within the meningeal lymphatics (Lyve-1 – white) associated with the transverse sinus (CD31 – blue). Scale bar = 35 µm. Representative images of 5 independent animals. i, Representative images of the lymphatics of the superior sagittal sinus (left panel) and the transverse sinus (right panel) with i.c.m. injected Qdot655. Arrows point to the subarachnoid space (SAS). Scale bar = 25 µm. Representative of 2 independent animals. j, Representative images of lymphatic sprout at the extension-rich region of lymphatic vessels along the transverse sinus, immunostained with Lyve-1 (grey) and junction proteins, VE-Cadherin (green) and Claudin-5 (red). Scale bar = 25µm. Representative of 2 independent animals. k, Representative image of the meningeal lymphatic vessels adjacent to the transverse sinus of Prox1GFP mice. Arrows point toward sprouting/extensions along the lymphatic vessels. Scale bar = 350 µm. Representative of 5 mice. l, Quantification of the length of lymphatics and number of lymphatic extensions in adjacent sections of meningeal lymphatics associated with the transverse sinus starting from the pineal gland (mean ± s.e.m.; n = 5 mice; n = 2 transverse sinus/mouse).
The intradural localization of the meningeal lymphatic vessels, and the uptake of i.v. injected gadolinium in human and primate meningeal lymphatics8,12 suggest that meningeal lymphatic vessels are draining the dura matter. Therefore, if the tracer injection results in dural leakage, our interpretation may be incorrect. To address the potential caveat of dural leakage, we injected fluorescent ovalbumin into the cisterna magna of wild type mice or applied the same amount of ovalbumin to non-fixed dissected skull caps for 1h prior to fixation (Supplementary Fig. 1c, 1d). Application of fluorescent ovalbumin onto meningeal explants resulted in an uptake of ovalbumin by the meningeal macrophages (most likely through pinocytosis13) throughout the entire meninges (Supplementary Fig. 1c, 1d). However, i.c.m. injection of ovalbumin resulted in its uptake only by macrophages along the sinuses (Supplementary Fig. 1c, 1d), suggesting other dural macrophages were not exposed to the ovalbumin injected i.c.m. in vivo. To further substantiate this point, we performed multiphoton imaging of the subarachnoid space above the cerebellum of a CX3CR1GFP mice after i.c.m. injection of Qdot655. Qdot655 were present below the dura mater (as was visualized through the secondary harmonic and i.v. injection of furamidine that labels nuclei of the dura matter and blood endothelial cells; Supplementary Video 1). Ten minutes after i.c.m. injection, fluorescent ovalbumin was found in perivascular spaces of the pial blood vessels of the cerebellum, the hot spots and the immediate surrounding of the injection site, but not anywhere else in the dura, demonstrating that the ovalbumin circulated within the subarachnoid spaces but not intradurally (Supplementary Fig. 1e).
Using multiphoton live imaging, we demonstrate that within minutes after i.c.m. injection of Qdot655, lymphatics along the transverse sinus (where we observe the hot spots) are filled with the tracer (Fig. 1i), whereas lymphatics along the superior sagittal sinus (lacking hot spots) remained devoid of the tracer (Fig. 1i). Qdot655 uptake by the meningeal lymphatics was more rapid in the region of the transverse sinus associated with lymphatic hot spots than in the regions that do not contain hot spots (Supplementary Video 2). Overall, these observations demonstrate that the meningeal lymphatics can uptake and transport CSF constituents.
Close observation of the lymphatics of the transverse sinuses revealed an increase in lymphatic length and the presence of lymphatic extension-like structures (Fig. 1j, Supplementary Fig. 1f), commonly observed in peripheral lymphatic vasculature14. The structures are ~1800 µm from the pineal gland (Fig. 1k, l), correlating with regions of Lyve-1 antibody accumulation at early time points after injection. Meningeal lymphatics at the hot spots appear as sprouts harboring button-like junctions of VE-Cadherin and Claudin-5 (Fig. 1j, Supplementary Fig. 1f). Although spatial organization of the tight junction proteins in the meningeal lymphatic sprouts reveals discontinuous pattern (Supplementary Fig. 1f), it is unique and not identical to what is observed on lymphatic sprouts of the diaphragm (Supplementary Fig. 1f and ref14).
Extensions of the meningeal lymphatics along the transverse sinus and the upper part of the superior sagittal sinus can be observed by multiphoton microscopy and might suggest direct exposure to the CSF (Supplementary Fig. 1g, h and Supplementary Video 3). Similar to peripheral lymphatics, the meningeal lymphatic extensions might represent the entry points for fluid and macromolecules into the meningeal lymphatic vasculature from the sub-arachnoid space/CSF.
The network of meningeal lymphatics previously described does not appear to only cover the forebrain but also be present in the spinal cord meninges, more specifically along the nerve roots15 (Supplementary Fig. 2a-e). The lymphatic extensions were also observed on the cerebellar ring of lymphatics (Supplementary Fig. 2f), suggesting that multiple sites along the meningeal lymphatic network might have access to CSF. Similarly, fluorescent microparticles injected into the CSF through the lateral ventricle or cisterna magna were seen accumulating near the lymphatics of the cervical nerve roots in the spinal cord meninges (Supplementary Fig. 2g). Previous reports have described a lymphatic network at the sides and base of the skull as well as the spinal8,16,17 (Supplementary Fig. 2h-j). After i.c.m. injection, some of the fluorescent particles are seen accumulating around the sides of the skull, close to lymphatic vessels (Supplementary Fig. 2j). These vessels, however, seem to have lymphatic valves, as previously described8, suggesting they are collecting lymphatics, which are usually less accessible by macromolecules.
Overall, these results suggest the existence of particular spots along meningeal lymphatic vessels that serve as entry points for solutes and immune cells from the sub-arachnoid space/CSF.
Trafficking of meningeal T cells to the deep cervical lymph nodes is CCR7-dependent.
Given that meningeal spaces are populated by numerous T cells16, and that those can enter the meningeal lymphatics (Fig. 1h), we hypothesized that meningeal T cells use lymphatic vessels to reach the CLNs. In Prox1GFPLcktdTOMATO mice (lymphocyte protein tyrosine kinase is primarily expressed by T cells and some NK cells18) we observed endogenous lymphocytes inside the lymphatic extensions (Fig. 1h, Supplementary Fig. 3a). Using KiKGR mice allows photo-conversion and in vivo tracing of endogenous cells in a specific anatomical location (from KiKG (green fluorescence) to KiKR (red) in response to violet light exposure). Serial illumination through an intact skull results in 40 to 45% conversion of meningeal/CSF KiKG+ CD4 T cells into KiKR+ T cells (Fig. 2a-c) without targeting the blood circulating CD4 T cells (Fig. 2c). Analysis of brain draining (dCLNs, sCLNs), and non-brain draining inguinal lymph nodes (ILNs) after serial conversion of the meningeal spaces reveals an accumulation of KiKR+ CD4 T cells uniquely in the dCLN of the converted mice (Fig. 2b, d). While the conversion is limited to the accessibility of the laser to the meningeal regions, these results demonstrate that T cells, localized in the meningeal/CSF spaces (sub-arachnoid spaces, pia, CSF, and dura) traffic to dCLNs under physiological conditions. Naïve CD4 T cells injected into the CSF of adult mice accumulate primarily in the dCLNs and sCLNs after injection into the CSF of naive mice (Fig. 2e, f). T cell accumulation in the dCLN is first observed in the lymph vessels of the lymph nodes and subsequently in the T cell zone (Fig. 2e). Using flow cytometry, we showed that similar numbers of i.c.m. injected T cells drain into dCLNs and sCLNs, but that the percentage of GFP+ T cells is higher in the dCLNs than the sCLNs (Supplementary Fig. 3b-d). These results confirm previous reports2,3,6 on dCLNs and sCLNs being the major CNS-draining lymph nodes.
Figure 2: Meningeal T cells migrate into the cervical lymph nodes in a CCR7 dependent manner.
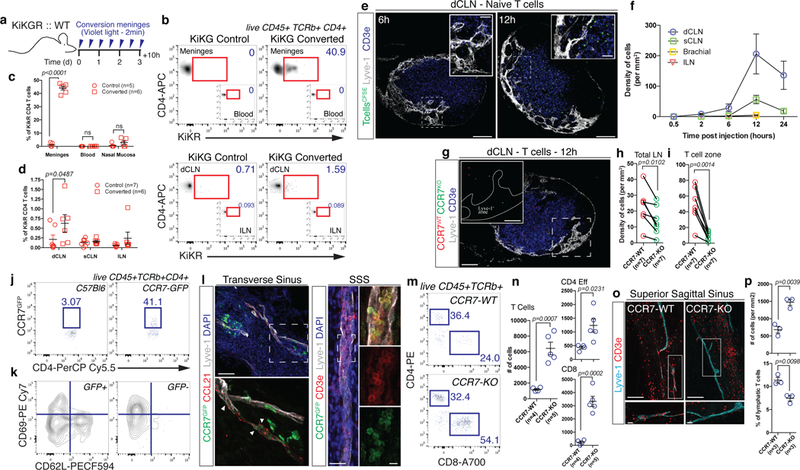
a, Scheme of the experiments in (b-d). C57Bl6 mice were reconstituted with bone marrow from KiKGR mice after irradiation. Ten weeks after reconstitution, meninges were converted for 2 min with a violet light (through the intact skull) every twelve hours for 3 days. Ten hours after the last conversion, tissues were harvested and analyzed by FACS. b, Representative density plot of converted T cells (KiKR+) in the meninges and deep cervical (dCLN) of control and converted mice. c, Quantification of the percentage of converted CD4 T cells (KiKR+) in the meninges, blood and nasal mucosa of control and converted mice (mean ± s.e.m.; F(1,26)=388.8; 2-way ANOVA with Sidak’s multiple comparisons test). d, Quantification of the percentage of KiKR+ CD4 T cells in the dCLN, sCLN and ILN of control and converted mice (mean ± s.e.m.; F(1,33)=4.862; mice pooled from 2 independent experiments, 2-way ANOVA with Sidak’s multiple comparisons test). e, Representative images of i.c.m. injected naïve T cells in the dCLN of mice at 6 and 12h post injection. Scale bar = 200 µm, 50µm (insets). f, Quantification of the density of naïve T cells per mm2 of dCLN, sCLN, brachial, and ILN at different time points post injection (mean ± s.e.m.; n=2–7 mice per group pooled from 2 independent experiments). g, Representative images of CCR7-WT (red) and CCR7-KO (green) CD4 T cells in the dCLN 12h post injection. Scale bar = 200 µm, 75µm (inset). h, i, Quantification of the density of CCR7-WT and CCR7-KO cells per mm2 of total lymph nodes (h) or per T cell zone (i) at 12h post injection (mean ± s.e.m.; t=3.687 df=6 (h) t=5.586 df=6 (i); pooled from 2 independent experiments; two-tailed paired t-test). j, Representative dot plot of GFP expression by CD4 T cells in the meninges of C57Bl6 mice and CCR7GFP mice. Representative of 3 independent mice. k, Representative contour plot of phenotype of CCR7+ and CCR7-CD4 T cells in the meninges of CCR7GFP mice. Representative of 3 independent mice. l, Representative images of CCR7 expression (CCR7GFP – green) in and around the meningeal lymphatics (Lyve-1 – white and CCL21 – red) along the transverse and superior sagittal sinuses. Arrows point to leukocyte-shaped cells expressing CCR7 located inside of the meningeal lymphatics. Scale bar = 120 µm. CCR7 expressing T cells (CD3e – red) are found in the meningeal lymphatics (Lyve-1 – grey). Scale bar = 40 µm, 15µm (insets). Representative of 3 independent mice. m, Representative dot plots of meningeal T cells (both CD4 and CD8) in the meninges of adult CCR7-WT and CCR7-KO mice. n, Quantification of the number of total, CD4 effector and CD8 T cells in the meninges of CCR7-WT and CCR7-KO mice (mean ± s.e.m.; representative of 2 independent experiments; t=5.744 df=7 (T Cells), t=2.897 df=7 (CD4 Eff), t=6.961 df=7 (CD8); two-tailed unpaired t-test). o, Representative images of T cells (CD3e – red) in and around the meningeal lymphatics (Lyve-1 – blue) of the superior sagittal sinus in CCR7-WT and CCR7-KO mice. Scale bar = 120 µm, 15µm (inset). p, Quantification of the density of T cells in the proximity of the sinuses of CCR7-WT and CCR7-KO mice (top panel) and percentage of T cells localized inside of the lymphatics (bottom panel) (mean ± s.e.m.; t=5.998 df=4 (density), t=4.633 df=4 (percentage); two-tailed unpaired t-test).
Because meninges are mainly populated by central memory T cells19, we injected in vitro generated central memory CD4 T cells (Supplementary Fig. 3e) into adult mice and found them accumulating in the dCLNs (Supplementary Fig. 3f, g). Co-injection of naïve and central memory CD4 T cells shows that efficiency of drainage is similar between the two cell types (Supplementary Fig. 3h).
Migration of immune cells requires attraction through a chemokine gradient, along with the expression of integrins and other adhesion molecules. Most of these signals involve the activation of G protein-coupled receptors20. Pre-treatment of CD4 T cells with the G protein-coupled receptor inhibitor, pertussis toxin (PTX) resulted in their failure to drain into the dCLNs as efficiently as control CD4 T cells (Supplementary Fig. 3i, j).
The CCR7-CCL21 pathway has been described as the main pathway for T cells and DCs to circulate through the lymphatic system, and mediate both entry and intra-lymphatic migration of cells, under both physiological and pathological conditions21,22 (although additional pathways contribute to immune cell trafficking under inflammatory conditions23). To address the role of CCR7 in meningeal cell trafficking, we co-injected CCR7-WT and CCR7-KO T cells at a 1:1 ratio into the CSF of naïve mice. Drainage of CCR7-KO T cells in the dCLNs was significantly reduced compared to that of CCR7-WT T cells (Fig. 2g-i). Similarly to T cells, injection of in vitro generated DCs (Supplementary Fig. 3k, l) led to their entry into the meningeal lymphatic around the hot spots (Supplementary Fig. 3m). Using the KiKGR system, we demonstrate that endogenous dendritic cells migrate from the meninges to the dCLNs after mobilization with Poly(I:C) (Supplementary Fig. 3n-r). Their migration into the dCLNs (Supplementary Fig. 3s, t) is CCR7-dependent since CCR7-deficient DCs failed to drain to dCLNs from CSF (Supplementary Fig. 3u,v;24).
FACS analysis of meningeal T cells in mice expressing GFP under the CCR7 promoter demonstrated that about 40% of the meningeal CD4 T cells express CCR7 (Fig. 2j) and are CD69–CD62L–/int, suggesting a recirculating phenotype (Fig. 2k). Immunostaining of the meninges from CCR7GFP mice revealed CCR7+ T cells primarily in close relationship with CCL21-expressing lymphatic endothelial cells (Fig. 2l). CCR7-KO mice showed increased numbers of meningeal T cells (Fig. 2m-p), and partial exclusion of the meningeal T cells from the lymphatic compartment (Fig. 2o, p).
Meningeal lymphatic vessels serve as a route for the drainage of immune cells and macromolecules from the CSF.
To demonstrate that T cell egress and macromolecule drainage is dependent on the lymphatic vasculature, we first analyzed meningeal drainage in mice heterozygous for the transcription factor prospero homeobox protein 1 (Prox1), the master regulator of lymphatic endothelial cells (LEC) fate25. Homozygous mice are embryonically lethal, whereas heterozygous mice survive to adulthood, although their lymphatic compartment is mis-patterned and leaky26. Prox1 has been shown to be expressed by neurons, but Prox1 heterozygote neurons do not appear to be affected27. We found that T cells (Supplementary Fig. 4a, b) and macromolecules (Supplementary Fig. 4c, d) injected into the CSF of two month old Prox1het mice failed to drain as efficiently into the dCLNs as in wild-type counterparts (no difference in lymph node size was observed (Supplementary Fig. 4e)). Interestingly, the number of endogenous meningeal T cells is significantly higher in Prox1het mice compared to WT littermates (Supplementary Fig. 4f, g). These results suggest that drainage from the meninges is dependent on lymphatic vascular integrity. Because Prox1het mice present a global defect in lymphatic vasculature, we surgically ligated afferent lymphatics reaching the dCLNs, a procedure previously shown to impair drainage of Evans blue from CSF to dCLNs1. Similarly to Prox1het mice, T cells (Fig. 3a, b), dendritic cells (Supplementary Fig. 4h, i) and fluorescent microbeads (Fig. 3c, d) injected into the CSF of ligated mice failed to drain into the dCLNs. Ligation procedure did not affect the lymph node size (Fig. 3e). Interestingly, the drainage of T cells into the sCLNs was unaffected by the surgical ligation (Fig. 3b), suggesting that meningeal efferent lymphatics might split at some point along its path to enter sCLNs and dCLNs. Endogenous meningeal T cell numbers were increased in the meninges after the ligation of dCLNs afferent lymphatics (Fig. 3f), further strengthening the connection between lymphatic drainage and meningeal T cell compartment.
Figure 3: Meningeal lymphatics as the main route for immune cell and macromolecule drainage from the CSF.
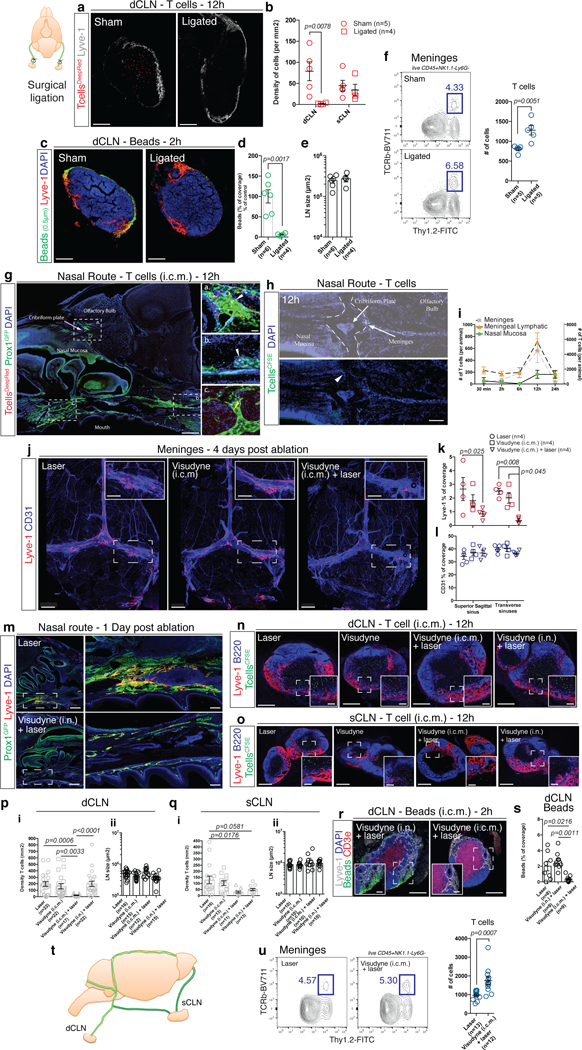
a, Representative images of exogenously injected T cells (CellTracker Deep Red Dye – red) in the dCLN at 12h after i.c.m. injection in sham-operate or ligated mice (24h post-surgery). Scale bar = 150 µm. b, Quantification of the density of T cells per mm2 of dCLN and sCLN in sham-operate or ligated mice (mean ± s.e.m.; F(1,14)=7.676; two-way ANOVA with Sidak’s multiple comparison test). c, Representative images of exogenously injected fluorescent microbeads (0.5µm in diameter – green) in the dCLN of sham-operated or ligated mice. Scale bar = 150 µm. d, Quantification of the percentage of bead coverage in the dCLN of sham-operated or ligated mice ((5µl of beads were injected); expressed as percentage of the control condition; mean ± s.e.m.; t=4.603 df=8; two-tailed unpaired t-test). e, Quantification of the size of the dCLNs of sham-operated or ligated mice (mean ± s.e.m). f, Representative contour plot of T cells in the meninges of sham-operated or ligated mice. Quantification of the number of T cells (TCRb+) in the meninges sham-operated or ligated mice (mean ± s.e.m.; representative of 2 independent experiment; t=3.813 df=8; two-tailed unpaired t-test). g, Representative images of i.c.m. injected T cells (Deep Red Cell Tracker – red) in the lymphatics of the cribriform plate (a) and in and around the lymphatics at the base of the nose (b and c). White arrowheads point to intra-lymphatic T cells while yellow arrowheads point to peri-lymphatic T cells. Scale bar = 1000 µm, 50µm (insets). Representative of 2 independent mice. h, Representative images of the cribriform plate region after 2 and 12h post i.c.m. injection of CFSE-labeled T cells (green). Arrowhead points to a CFSE-labeled T cell localized on the nasal side of the cribriform plate. Scale bar = 230 µm. Representative of 4 independent mice. i, Quantification of the number of exogenously injected T cells in the meninges (grey curve), in the meningeal lymphatics (orange curve), and in the nasal mucosa (green curve) of mice at different time post i.c.m. injection (mean ± s.e.m.; n=2–8 mice per group, pooled from 2 independent experiments). j, Representative images of the meningeal lymphatics (Lyve-1 – red) and blood (CD31 – blue) vasculature of laser alone, Visudyne (i.c.m.) alone and Visudyne (i.c.m.) + laser treated mice 4 days after photoconversion. Scale bar = 1000 µm, 400µm (insets). k, l, Quantification of the Lyve-1 (k) and CD31 (l) coverage on the superior sagittal and transverse sinuses of laser alone, Visudyne (i.c.m.) alone and Visudyne (i.c.m.) + laser treated mice 4 days after photoconversion (mean ± s.e.m.; representative of 3 independent experiments; F(2,18)=10.67; two-way ANOVA with Sidak’s multiple comparison test). m, Representative images of the nasal lymphatics (Prox1GFP – green, Lyve1 – red) 24h after laser or intranasal (i.n.) injection of Visudyne. The inset illustrates the lymphatic bundle at the base of the skull that is ablated after Visudyne treatment. Scale bar = 500 µm, 200µm (insets). Representative of 6 mice/group from 2 independent experiments. n, o, Representative images of i.c.m. injected T cells (CFSE-labeled, green) in the dCLNs (n) or sCLNs (o) of laser alone, Visudyne alone, Visudyne i.c.m. + laser, and Visudyne (i.n.) + laser treated mice 12h after i.c.m. injection. Scale bar = 150µm, 30µm (insets) (n), 300µm, 50µm (insets) (o). p, Quantification of the density of T cells per mm2 of dCLNs (i) and size of dCLNs (ii) in the laser alone, Visudyne alone, Visudyne i.c.m. + laser, and Visudyne (i.n.) + laser treated mice 12h after i.c.m. injection (mean ± s.e.m.; pooled from 4 independent experiments (i) pooled from 3 independent experiments (ii); Kruskal-Wallis test with Dunn’s multiple comparison test). q, Quantification of the density of T cells per mm2 of sCLNs (i) and sCLNs size (ii) in the laser alone, Visudyne alone, Visudyne i.c.m. + laser, and Visudyne (i.n.) + laser treated mice 12h after i.c.m. injection (mean ± s.e.m.; pooled from 2 independent experiment (i) and from a single experiment (ii); F(3,49)=4.282; one-way ANOVA with Sidak’s multiple comparison test). r, Representative images of CSF-injected beads drained to the dCLNs in Visudyne (i.n.) + laser and Visudyne (i.c.m.) + laser treated mice at 2h after injection. Scale bar = 150µm, 35µm (insets). s, Quantification of the percentage of bead coverage of the dCLNs of laser, Visudyne (i.c.m.) + laser and Visudyne (i.n.) + laser treated mice at 2h after CSF injection (mean ± s.e.m.; F(2,23)=9.122; one-way ANOVA with Tukey’s multiple comparisons test). t, Scheme of the proposed model of the route of drainage into the cervical lymph nodes. u, Representative contour plot of T cells in the meninges of laser and Visudyne (i.c.m.) + laser treated mice at 7 days post ablation. Quantification of the number of T cells in the meninges of laser and Visudyne (i.c.m.) + laser treated mice (mean ± s.e.m.; pooled from 3 independent experiments; t=3.939 df=23; two-tailed unpaired t-test).
Previous works have suggested the cribriform plate and nasal mucosa lymphatics as the route for immune cells to exit the CNS and reach the cervical lymph nodes2 Indeed, the cribriform plate and nasal mucosa harbor an organized lymphatic vasculature expressing all hallmarks of lymphatic endothelial cells (Supplementary Fig. 4j-o). Staining for endogenous T cells usually does not detect T cells on the nasal side of the cribriform plate (Supplementary Fig. 4p, q) and no KiKR+ CD4 T cells were found in the nasal mucosa upon conversion of the meningeal T cells (Fig. 2c). T cells injected i.c.m. can be found on the CNS side of the cribriform plate closely associated or inside the lymphatic network (Fig. 3g-i),, with increasing abundance relative to the speed of injection (Supplementary Fig. 4r, s).
To assess whether this experimental paradigm reflects a physiological trafficking pattern of meningeal T cells, we exploit a variety of techniques to directly and specifically ablate meningeal lymphatics. First, we crossed Prox1creERT2 mice with either DTRfl/fl or DTAfl/fl mice and administered 4-hydroxytamoxifen (TAM) or diphtheria toxin (DT) i.c.m. Unfortunately, both systems resulted in lethality, even in control mice that do not harbor either the DTR or DTA transgene or failure to induce recombination at lower dose (Supplementary Fig. 4t-x). This limitation led us to use a pharmacological/chemical approach to ablate meningeal lymphatic vessels. Visudyne, a photoconvertible compound that produces short-lived reactive oxygen species (ROS) upon conversion with a non-thermal 689-nm laser has been shown to efficiently ablate peripheral lymphatic vessels28. We injected Visudyne into the cisterna magna of wild-type mice, and after 15 to 30 min (to enable the compound to accumulate in the lymphatics), the laser was applied through the intact skull at five different spots located above the transverse and superior sagittal sinuses as well as above the lymphatic ring posterior to the cerebellum. This treatment results in efficient and stable elimination of the meningeal lymphatic vasculature (Fig. 3j, k; Supplementary Fig. 5a, b).
No difference in intracranial pressure was observed between laser (PBS), Visudyne (i.c.m.), and Visudyne (i.cm.) + laser mice at 3 days post ablation groups (Supplementary Fig. 5c, d) Visudyne treatment also did not alter vascular integrity and function (Fig. 3l, Supplementary Fig. 5e-j) nor did we observe alteration in the integrity of the pia or glia limitans (Supplementary Fig. 5k, l). Meningeal cytokines and chemokines were slightly upregulated one day post injection in Visudyne treated mice, as compared to PBS-injected controls, but by day 4 no difference between the PBS and Visudyne treated groups was observed (Supplementary Fig. 5m, n). Moreover, neither proliferation nor activation of meningeal macrophages (Supplementary Fig. 5o-q, Supplementary Fig. 5t-w) and recruitment of innate immune cells (Supplementary Fig. 5t, u) was evident. Activation of the brain and spinal cord vasculature after Visudyne treatment appears to be mildly increased as indicated by modest upregulation of ICAM1 on day 1 after treatment, levels of which are reversed to control baseline after 4 days (Supplementary Fig. 5r, s).
To address the contribution of the nasal route to CNS drainage, we designed a similar approach to ablate nasal lymphatics. Visudyne was injected intranasally and the laser was aimed through the mouth at the base of the nasal cavity. This treatment resulted in the ablation of the lymphatic bundle located at the base of the nose (Fig. 3m). Fluorescently labeled T cells were injected into the CSF of mice with ablated meningeal lymphatics (Visudyne (i.c.m.) + laser), ablated nasal lymphatics (Visudyne (i.n.) + laser) or two different control groups (PBS (i.c.m.) + laser or Visudyne (i.c.m.) without laser), 4 days after the treatment. Ablation of the meningeal lymphatics resulted in a significant decrease of T cell accumulation in both, the dCLNs and sCLNs (Fig. 3n-q). Ablation of the nasal lymphatic route significantly decreased drainage into the sCLNs, but not into the dCLNs (Fig. 3n-q). Similarly, drainage of beads into the dCLNs is only affected by the disruption of meningeal but not nasal lymphatics (Fig. 3r, s). Importantly, lymphatics of the cribriform plate remained intact when meningeal lymphatics were ablated (Supplementary Fig. 5x) and the ability of injected T cells to cross the cribriform plate was also not impacted (Supplementary Fig. 5y). These results may be indicative of meningeal lymphatics draining into both the dCLNs and sCLNs, while the nasal lymphatics may drain primarily into the sCLNs (Fig. 3t). Interestingly, when the laser is aimed at spots located outside of the lymphatic vasculature to induce the potential meningeal sides effects via ROS production without meningeal lymphatic ablation, we found no difference in T cell migration compared to control mice (Supplementary Fig. 5z). Likewise, ablation of the meningeal lymphatics results in accumulation of endogenous T cells in the meningeal compartment (Fig. 3u). These results collectively suggest that the meningeal lymphatic vessels are an important route for CSF cellular and molecular constituents to reach the dCLNs, whereas both meningeal and cribriform/nasal routes connect to sCLNs.
RNAseq of meningeal lymphatic endothelial cells reveals a unique transcriptomic signature.
Lymphatic endothelial cells have been shown to proliferate and expand in an inflammatory environment29. We used the animal model of multiple sclerosis, experimental autoimmune encephalomyelitis (EAE), to induce a robust inflammation in the CNS, including in the CSF/meningeal spaces30,31. Analysis of the meningeal lymphatic vasculature at different time points after immunization of mice revealed no morphological changes in both brain and spinal cord meningeal lymphatics (Supplementary Fig. 6a-d). Interestingly, later in the disease, lymphatics located on the CNS-side of the cribriform plate do expand (Supplementary Fig. 6e, f), suggesting potential increased drainage through the nasal route in late stage of the disease. Indeed, VEGFc, among other pro-lymphangiogenic molecules, has been shown to be elevated during EAE32.
Quantification of the number of meningeal T cells during disease progression revealed an increased density of T cells inside and around the meningeal lymphatic vasculature, corresponding with the emergence of clinical symptoms (Supplementary Fig. 6g – i), implying an increase in meningeal immune cell egress in the draining lymph nodes. This suggests that, contrary to peripheral, meningeal lymphatics might not demonstrate a classical inflammation-induced lymphangiogenesis.
Meningeal vasculature is submitted to an environment that might physically constrain the vessels, we decided to further investigate the endogenous properties of the meningeal LECs as compared to those from the diaphragm and skin (ear). Cells were FACS sorted from wild-type mice as previously described1 and RNA-seq was performed. Principal component analysis showed a clustering of the samples in a tissue specific manner (Fig. 4a). Differential expression analysis showed that ~300 genes were specifically up-or down-regulated in the meningeal lymphatics compared to peripheral lymphatics (Fig. 4b, c), whereas LEC-specific gene set enrichment analysis revealed no difference between these three sources of cells (Fig. 4d). Gene set enrichment analysis showed the alteration of multiple pathways related to extracellular matrix, focal adhesion and angiogenesis, but also response to endogenous and exogenous stimuli (Fig. 4e). The meningeal LECs appear then to possess unique gene sets that enable their interaction with the meningeal environment. Of interest, several molecules previously implicated in lymphatic development and proliferation33–35 are dysregulated in the meningeal compared to peripheral lymphatics (Fig. 4f). Furthermore, the role of environmental stiffness has been demonstrated in regulation of the LEC transcriptome and response to growth factors36. When compared to peripheral lymphatics, expression for stiffness-regulated genes by meningeal LEC is similar to their expression by LECs cultured on a stiff matrix36,37 (Fig. 4g). Such expression profile may underlie the limited ability of adult meningeal LECs to respond to growth factors or local inflammation.
Figure 4: Transcriptomic analysis of the meningeal lymphatic endothelial cells.

a, Principal component analysis of the transcriptome of the lymphatic endothelial cells (LEC) of the diaphragm (blue), meninges (green) and skin (red – ear) (n=3 biological replicate per group each pooled from 10 individual mice). b, Upset plot showing the set intersection between the differentially up-regulated genes in meningeal, diaphragm, and skin LEC. The orange bar represents the 304 up-regulated genes in the meningeal LEC compared to the diaphragm and skin LEC. c, Heat map of the significantly up– and down– regulated genes in the meningeal LEC compared to the diaphragm and skin LEC. d, Heat map of the relative expression of the LEC-related genes in the meningeal, diaphragm, and skin LEC. e, Representation of significantly up– and down– regulated gene pathways in the meningeal LEC compared to diaphragm and skin LEC (Fisher’s exact test). f, Quantification of the normalized counts for Sema3a, Ephb2, Thsp1, and Klf4 in the diaphragm, meningeal and skin LEC. Genes were selected from the significantly up-or down-regulated genes (mean ± s.e.m.). g, Quantification of the normalized counts from diaphragm, meninges and skin LECs for genes previously shown to be down-or up-regulated by LECs when cultured on high stiffness surfaces (mean ± s.e.m.; F(2,42)=12.14; two-way ANOVA with Tukey’s multiple comparison test).
Ablation of meningeal lymphatic drainage ameliorated EAE pathology.
Although meningeal lymphatics did not change morphologically during EAE associated inflammation, we decided to assess their role in EAE. Previous reports, using different models of EAE showed a critical role of the dCLNs in disease severity38–40. We confirmed in our model that the resection of the dCLNs (Supplementary Fig. 7a) leads to a decreased disease severity. Using a Visudyne-based approach, we found that disruption of the meningeal lymphatics also delayed the development of EAE and resulted in milder disease pathology (Fig. 5a, b). Interestingly, ablation of the nasal lymphatics using Visudyne, while preventing drainage into the sCLNs (Fig. 3q), did not interfere with the disease development (Fig. 5a, b). Similar results were obtained via surgical ligation of the afferent lymphatics of the dCLNs (Supplementary Fig. 7b, c). In line with these findings, analysis of the CNS compartments during the active phase of EAE (D17 post immunization) revealed lower CD4 T cell infiltrates in the spinal cord parenchyma while the numbers of CD4 T cells remained higher in the brain meninges (Fig. 5c, d). Collectively, these results suggest that the dCLNs represent an important site for the induction or maintenance of encephalitogenic T cells and that drainage of the CSF into dCLNs might be key for the lymph node to harbor this unique characteristic.
Figure 5: Ablation of lymphatic drainage modulates T cell activation and ameliorates disease development.

a, EAE clinical symptoms development in laser, Visudyne (i.n.) + laser, and Visudyne (i.c.m.) + laser treated mice (on the day of EAE induction; mean ± s.e.m.; pooled from 3 independent experiments; F(2,79)=23.07; repeated measures two-way ANOVA with Tukey’s multiple comparisons test). b, Incidence of EAE development (the day mice reach a score of 1 or above) in laser, Visudyne (i.n.) + laser, and Visudyne (i.c.m.) + laser treated mice (pooled from 3 independent experiments, Log-rank (Mantel-Cox) test). c, Representative dot plots of CD4 and CD8 T cells in the spinal cord, brain meninges and spinal cord meninges of laser and Visudyne (i.c.m.) + laser mice during late onset EAE (D17). d, Quantification of the number of CD4 and CD8 T cells in the spinal cord, brain meninges and spinal cord meninges of laser and Visudyne (i.c.m.) + laser treated mice at D17 post immunization (mean ± s.e.m.; pooled from 2 independent experiments; F(1,26)=5.5990 (Brain Meninges), F(1,26)=10.91; two-way ANOVA with Sidak’s multiple comparisons test). e-h, Adult wild-type mice were injected i.v. with 1:1 ratio of 2D2TdTOMATO and OTIIGFP T cells (4 millions total). One day after injection, mice were laser or Visudyne (i.c.m.) + laser treated and EAE was induced by immunization with MOG35–55. The dCLNs were harvested at day 8 of EAE development and the interaction of the 2D2 and OTII T cells with CD11c+ cells were analyzed. e, Representative images of MOG-specific T cells (2D2 – red) and OVA-specific T cells (OTII - green) in the dCLNs of laser and Visudyne (i.c.m.) + laser treated mice at D8 post EAE induction. Green arrowheads points to OTII T cells. Yellow arrowheads points to 2D2 non in contact with a CD11c+ cells, and white arrowheads points to 2D2 in contact with a CD11c+ cells. Scale bar = 150µm, 25µm (insets). Representative of 5 independent mice per group. f, Representative images and associated profile plot of a MOG-specific T cells (2D2 – red) in close contact (upper panel) or not (lower panel) to a CD11c+ expressing cells (cyan) in the dCLNs of laser and Visudyne (i.c.m.) + laser treated mice at D8 post EAE induction. Scale bar = 10µm. Representative of 5 independent mice per group. g, Quantification of the density of OTII and 2D2 T cells in the dCLNs of laser and Visudyne (i.c.m.) + laser treated mice at D8 post EAE induction (mean ± s.e.m.). h, Quantification of the percentage of OTII and 2D2 T cells in contact with a CD11c+ cells in the dCLNs of laser and Visudyne (i.c.m.) + laser treated mice at D8 post EAE induction (mean ± s.e.m.; F(1,8)=4.204; two-way ANOVA with Sidak’s multiple comparisons test). i, Heat map of the significantly up-and down-regulated genes in the CD44+ 2D2 T cells obtained from dCLN and spleen of Visudyne (i.c.m.) + laser vs. control laser treated mice (Fisher’s exact test with p value > 0.05). j, Volcano plot of the significantly up– and down– regulated genes in the CD44+ 2D2 T cells obtained from dCLN of Visudyne (i.c.m.) + laser vs. control laser treated mice (n=3 samples per group; P values were corrected for multiple hypothesis testing with the Benjamini-Hochberg false-discovery rate procedure). k, Representation of some of the significantly enriched pathways in the CD44+ 2D2 T cells obtained from dCLN of Visudyne (i.c.m.) + laser vs. control laser treated mice (P values were corrected for multiple hypothesis testing with the Benjamini-Hochberg false-discovery rate procedure). l, Dot plot analysis of the active miRNA in the CD44+ 2D2 T cells obtained from dCLN of the Visudyne (i.c.m.) + laser vs. control laser treated mice (data was analyzed using the hypergeometric distribution with a significance at p<0.05).
Analysis of T cell activation and proliferation in the spleen and dCLNs of mice with normal and ablated lymphatic drainage was comparable (Supplementary Fig. 7d-h).
To test the hypothesis that lymphatic drainage is necessary to shape T cell phenotype, we analyzed the interactions of brain antigen-specific T cells (MOG −2D2) and non-brain antigen-specific T cells (Ovalbumin - OTII) with dendritic cells (CD11c+) in the dCLNs of EAE mice. For this purpose, adult C57Bl6 mice were seeded with 1:1 ratio of fluorescent 2D2 and OTII T cells one day prior to meningeal lymphatic ablation and EAE induction. Proliferation of 2D2 T cells was not affected by the ablation of the meningeal lymphatics (Fig. 5e-h). Interestingly, we found that the interaction of 2D2 (but not OT II) T cells with CD11c+ cells, quantified as a contact between two cells, was significantly reduced in mice with meningeal lymphatic ablation (Fig. 5f-h). This result suggests that the lack of lymphatic drainage reduces T cells-APC interactions. Quantification of APCs in dCLNs of control and ablated mice did not show differences (Supplementary Fig. 7i).
In order to better understand how CNS lymphatic drainage impacts T cell encephalitogenicity, we analyzed the transcriptomic profile of dCLN-isolated antigen-specific T cells. Adult mice were injected with naïve fluorescent 2D2 (MOG-specific) T cells prior to meningeal lymphatic ablation and EAE induction, and were harvested from the spleen and dCLNs 8 days after EAE induction. We found that about 500 genes were significantly up– or down– regulated in the 2D2 T cells activated in the dCLNs without lymphatic drainage when compared to control EAE mice (without lymphatic manipulation), with the majority of the genes being down-regulated (Fig, 5i, j). Interestingly, no difference in gene expression was observed in the spleen of these mice (Fig. 5i). Gene ontology on unadjusted normalized gene counts revealed a significant down-regulation of multiple pathways related to the inflammatory response and more precisely to cytokine and chemokine responses and production in T cells (Fig. 5k). Multiple downregulated genes (Fig. 5j) have been previously identified as promoting EAE development (Ccr141), are involved in T cell activation/differentiation (Tradd42) or migration and vascular transmigration (Nod243). Furthermore, prediction of active miRNAs revealed a potentially increased activity of miRNA implicated in T cell activation, differentiation, and migration, such as miR Let744 (Fig. 5l). Overall, this transcriptomic analysis suggests that the lack of lymphatic drainage prevented the acquisition of the fully encephalitogenic profile by MOG-specific T cells in the dCLNs, in turn resulting in decreased migration/encephalitogenic properties of T cells into the CNS and milder clinical score.
These results suggest an active role of cellular and/or molecular drainage to modulate T cell phenotype in response to CNS-antigens and highlight how lymphatic drainage regulates tissue-specific immune responses.
Discussion
Here, we show that meningeal lymphatic vessels sample macromolecules and immune cells from the CSF and serve as an important conduit for CNS drainage. We also describe structural features of spinal cord meningeal lymphatics. We expand on our understanding of immune-cell trafficking via the meningeal lymphatic vessels to the draining lymph nodes, which is primarily dependent on CCR7. Using a pharmacological method that we adopted to specifically ablate meningeal (or nasal) lymphatic vessels, we demonstrate that the nasal route drains directly into the sCLNs, while the meningeal lymphatic route drains into both the dCLNs and sCLNs. RNA-seq analysis of LECs from mouse meninges, diaphragm, and skin revealed that the meningeal lymphatic vessels exhibit a unique transcriptional profile, which, under local inflammatory conditions might underlie the distinct behavior of meningeal lymphatics. Attenuation of EAE was obtained after surgical and pharmacological blockade of lymphatic function suggesting that drainage contributes to the activation of encephalitogenic T cells in the lymph nodes. Supporting this notion, reduction of meningeal lymphatic drainage reduced interactions of 2D2 T cells with local antigen-presenting cells. RNA-seq of activated 2D2 T cells isolated from dCLNs showed that T cells from mice lacking lymphatic drainage acquired a different phenotype from that of controls. These findings warrant further research to identify the cellular (and/or molecular) mediators draining from the CNS and driving T cell encephalitogenicity.
Meningeal lymphatic vessels are embedded within the dura11,12. This raised an obvious question: how can macromolecules and immune cells drain from the CSF into meningeal lymphatic vessels, given that the arachnoid mater, is supposedly impermeable to CSF45? We noticed, however, that certain spots along the meningeal lymphatics could be seen to take up the tracer from the CSF almost immediately after its injection, whereas tracer uptake along remaining parts of the vessels was slower. Subsequent experiments revealed certain spots along the meningeal lymphatics where the vessel structure was more complex and ramified, and extensions exposed to the CSF. The structure of these lymphatic sprouts is reminiscent to peripheral tissue lymphatic buttons14, which serve as the entry gate into the lymphatic vasculature14. Further experiments using electron microscopy technique will be necessary to demonstrate that the meningeal lymphatic vessels are physically crossing the arachnoid mater.
Previous reports have implicated the cribriform plate as a major player in the passage of immune cells from the CNS to its draining lymph nodes9. Furthermore, recent study has challenged the potential contribution of the meningeal lymphatics in the drainage of CSF into the CLNs6. Here, using live-imaging, our data (supported by others46) clearly demonstrates the uptake by meningeal lymphatics of tracers injected into the CSF. Our observations, however, do not exclude alternative routes as previously suggested.
In the present study, we injected exogenous cells into the cisterna magna, and also observed cells in the nasal mucosa and associated lymphatics. However, we could not detect any T cells on the nasal side of the cribriform plate under physiological conditions. Moreover, we labeled endogenous meningeal T cells using laser photoconversion but could not detect any labeled cells in the nasal mucosa. It is possible that if photo-conversion of meningeal T cells would be complete, some crossing of the cribriform plate by meningeal T cells could have been observed. Furthermore, the speed of injection (and, hence, change in intracranial pressure) appears to be a major factor in facilitating crossing of the cribriform plate by CNS immune cells. Our results thus suggest that the cribriform plate in all probability does not represent a major physiological immune-relevant exit route. This structure has been shown, however, to play an important role in the regulation of CSF homeostasis, since its surgical blockade results in an immediate and constant increase in CSF pressure47. Our results also show that chronic neuroinflammation is accompanied by expansion of the lymphatic vasculature localized around the cribriform plate (as opposed to brain and spinal cord meningeal lymphatics), suggesting that the nasal region might have a more important function at later stages of disease development.
Several organs (such as the lung48, for example) have been suggested as sites at which CNS-specific T cells become “licensed” to acquire an appropriate migratory profile that will allow them to infiltrate the CNS. Our data suggest that dCLNs could be another site for T-cell licensing or reactivation. Dendritic cells migrating from different tissues have been shown to uniquely influence T-cell activation and migration49, and MOG-loaded dendritic cells reportedly activate T cells in the CLNs prior to their migration into the CNS50. In the context of EAE (both induced and spontaneous), excision of the brain-draining lymph nodes has been shown to delay or attenuate disease development38–40. In spontaneous models, limitation of the drainage of MOG into the dCLNs, thereby preventing activation of MOG-specific T cells is a likely mechanism. A similar scenario might apply when meningeal lymphatics are ablated. It is important to note that meningeal lymphatic ablation only attenuates and ameliorates EAE but does not completely stop it, suggesting that other routes are involved. Although no side effects were found when using the Visudyne approach, future development of targeted techniques will allow to discern the role of anatomically distinct lymphatics in EAE.
Overall, the work described here provides the first characterization of the meningeal lymphatic system in the context of brain immunity and neuroinflammation and opens the way to a better understanding of brain immune surveillance and the generation of CNS-directed immune responses. These results might help to uncover the etiology of the immune imbalance typical of neuroinflammatory disorders, with promising implications for therapy.
Methods:
Mice:
Mice were maintained and bred in-house under standard housing conditions (12 hours light/dark cycles and fed ad libitum). All mice were on a C57Bl/6J background except for the Prox1LacZ (identified as Prox1Het in the manuscript) that were on an NMRI background. Both adult males and females were used unless stated otherwise at 8 – 12 weeks of age. Only female mice were used for the immunization experiments. Strains used are C57Bl/6J (JAX: 000664); Prox1LacZ (gift from Guillermo Oliver); B6.129P2(C)-Ccr7TM1RFOR/J (CCR7KO – JAX: 006621); C57Bl/6-Ccr7tm1.1Dnc/J (CCR7GFP – JAX: 027913); Tg(CAG-KiKGR)33Hadj/J (KiKGR – JAX: 013753); Prox1GFP / Prox1tdTOMATO (gift from Dr. Young Kwon Hong); Prox1CreERT2.(gift from Dr. Taija Makinen); Gt(ROSA)26Sortm1(DTA)Lky/J (ROSA DTA – JAX: 009669); Gt(ROSA)26Sortm1(HBEGF)Awai/J (ROSA DTR – JAX: 007900); C57Bl/6-Tg(Tcra2D2, Tcrb2D2)1Kuch/J (2D2 – JAX: 006912); B6.Cg-Tg(TcraTcrb)425Cbn/J (OTII – JAX: 004194); B6.Cg-Tg(Lck-cre)548Jxm/J (Lck-Cre – JAX: 0038802); B6.129P-Cx3cr1tmLitt/J (CX3CR1GFP – JAX: 005582) and Gt(ROSA)26Sortm14(CAG-tdTOMATO)Hze/J (ROSA tdTOMATO – JAX: 007914). Experimental groups were blinded during scoring and quantifications. Sample size was chosen in accordance with similar previously published experiments. Animals from different cages in the same experimental group were selected to assure randomization. All experiments were approved by the Institutional Animal Care and Use Committee of the University of Virginia.
Intra-cisterna magna (i.c.m.) injection:
Mice were anesthetized with ketamine/xylazine i.p. and injected i.c.m. into the cisterna magna. 2µl of fluorescent beads mix (0.75µl of FluoSpheres Carboxylate-Modified Microspheres of 1.0µm diameter (ThermoFisher); 0.5µl of FluoSpheres Carboxylate-Modified Microspheres 0.5µm diameter (ThermoFisher) in a total volume of 2µl PBS), 5µl of FluoSpheres Carboxylate-Modified Microsphere of 0.5µm, or 5µl of Alexa-fluor 594/647 conjugated OVA (0.5mg/ml; ThermoFisher) at a rate of 0.5 or 3µl/min. After injection, the needle is left in place for 1–2 minutes to avoid backflow. Subsequently, the muscle was pinched to apply some pressure on the cisterna magna prior to the needle removal. Mice were then sutured and allowed to recover on a heating pad until responsive (after about 45 min to an hour). Lymph nodes and meninges were harvested at the indicated time points and analyzed by immunohistochemistry or flow cytometry.
Vasculature labeling:
Mice were injected i.v. with 50µl of DyLightA488 labeled Lycopersicon Esculentum (DL-1174; Vector Laboratories) two to three minutes prior to mouse euthanasia.
Stereotactic injections:
Mice were anesthetized with ketamine/xylazine i.p. and immobilized on a stereotactic frame. Intracerebroventricular (i.c.v.) injections were performed for the right lateral ventricle at 1 mm lateral, −0.6 mm longitudinal from bregma, and the needle lowered −2 mm. 0.5µl of FluoSpheres Carboxylate-Modified Microspheres of 0.5µm size (ThermoFisher) were reconstituted in 2 µl PBS and delivered at indicated rate of injection with a syringe pump. The skin was sutured and mice treated with analgesic.
Lymph nodes excision and surgical ligation:
Eight-week old mice were anesthetized with ketamine/xylazine (i.p.), shaved at the neck (or armpit), cleaned with iodine and 70% ethanol, and an ophthalmic solution was put on the eyes to prevent drying. For dCLN resection or ligation, an incision was made midline 5mm superior to the clavicle. The sternocleidomastoid muscle (SCN) was retracted, and the dCLN were removed with forceps. For ligation, the collecting lymphatic vessels anterior to the dCLN were ligated using a nylon suture (11–0, Nylon non-absorbable monofilament suture, AD Surgical). For the brachial lymph nodes, an incision was made at the bottom of the triceps. The brachial lymph nodes were either resected using forceps or had their collecting lymphatic ligated using a nylon suture (11–0, Nylon non-absorbable monofilament suture, AD Surgical). Mice were then sutured and allowed to recover on a heating pad until responsive. Post-surgery, mice were given analgesic and antibiotics subcutaneously.
Visudyne treatment:
Adapted from previous publications28,51,52. Mice were anesthetized with ketamine/xylazine (i.p.). Visudyne® (Valeant Ophtalmics) was reconstituted following manufacturer instructions and 5µl was injected either i.c.m into the cisterna magna (for meningeal lymphatic ablation) or 2µl in each nostril (for nasal lymphatics ablation). After 15 min, Visudyne was photo-converted with a non-thermal 689nm wavelength laser light (Coherent Opal Photoactivator, Lumenis) on 5 different spots through the intact skull (1 on the cisterna magna, 2 on the transverse sinuses, 1 on the superior sagittal sinus and 1 at the junction of all sinuses). For nasal lymphatic ablation, the laser was applied through the soft palate of the mouse’s mouth. Each spot was irradiated with a light dose of 50J/cm2 at an intensity of 600mW/cm2 for 83s. Mice were then sutured and allowed to recover on a heating pad until responsive. Post-surgery, mice were given analgesic subcutaneously.
Experimental Autoimmune Encephalomyelitis:
EAE was induced in female mice (8 to 12 weeks old) by subcutaneous injection of MOG35–55 peptide (200µg, CSBio) emulsified in Freund’s adjuvant (Sigma Aldrich) supplemented with 2mg/ml of Mycobacterium Tuberculosis (BD). Pertussis toxin (200ng, List Biologicals) was injected i.p. on day 0 and day 1 after MOG immunization. For clinical evaluation, mice were scored daily: 0-no clinical disease, 1-limp tail, 2-hindlimb weakness, 3-hindlimb paralysis, 4-partial front limb paralysis, 5-moribund.
Intracranial Pressure Measurement:
Mice were anesthetized (ketamine/xylazine, i.p.) and the skin was incised to expose the skull. A 0.5mm diameter hole was drilled in the skull above the right parietal lobe. A pressure sensor (model SPR100; Millar) was inserted perpendicularly into the cortex at a depth of 1mm. The pressure sensor was connected to the PCU-2000 pressure control unit (Millar) and recorded for 5 min after stabilization of the signal (around a minute after insertion of the probe). The average pressure was calculated over the last 2 minutes of recording (between minute 4 and 6 of the recording). Animals were killed at the conclusion of the measurement. For positive control, adult C57Bl6 mice were submitted to bilateral ligation of the jugular vein53,54. For negative control, adult C57Bl6 were injected intraperitoneally with 20mg/kg of Acetazolamide (Sigma) dissolved in DMSO (Sigma)55.
Photoacoustic imaging:
Adult mice were anesthetized with 1.5% isoflurane and the body temperature was maintained with the aid of a temperature controlled heating pad. A surgical incision was made in the scalp and the fascia was removed to expose the skull. The skull over the region of interest was thinned to the desired thickness (100µm) one day prior to the imaging. Mice were then imaged by multi-parametric photoacoustic microscopy (PAM), which is capable of simultaneously image oxygen saturation of hemoglobin (sO2) and blood flow speed as described previously56. sO2 is computed from the Oxy-hemoglobin (HbO2) and deoxy-hemoglobin (Hbr) recorded using two nanosecond-pulsed lasers (532 and 559 nm). Correlation analysis of adjacent A-line signals allows the quantification of blood flow speed within individual vessels. By segmenting major vessels within the region of interest, average values of the sO2 and blood flow speed were extracted for quantitative analysis.
Multiphoton microscopy.
Adult Prox1GFP, LckCre::tdTOMATOfl/fl mice were anesthetized by ketamine/xylazine intraperitoneal (i.p.) injection. Mice were injected intravenously (i.v.) or into the cisterna magna (i.c.m.) with Qtracker655 vascular tracker (ThermoFisher - Qdot655 – 5µl with 95µl saline (i.v.) or 5µl (i.c.m.)). Furamidine dihydrochloride (125µg -Sigma Aldrich) was injected i.v. prior to imaging. Meningeal lymphatic vessels were imaged through a thinned skull preparation above the superior sagittal, transverse sinuses or cerebellum. The core temperature of the mice was maintained at 37C. Imaging was performed with a Leica TCS SP8 multiphoton system (Leica Microsystems) equipped with a Chameleon Ultra II tunable Ti:sapphire laser (Coherent). GFP, tdTOMATO and Qdot655 were excited with an excitation wavelength of 880 nm (or 780nm for furamidine57). Second harmonic signal (bone and meningeal signal) was visualized using a 400/450 external detector. Images were obtained using a 25X water immersion objective with 0/95NA and external HyD non-descanned detectors (Leica Microsystems). Three-dimensional images data were collected by obtaining images from the x,y and z-planes. The resulting images were analyzed with Imaris software (Bitplane).
Photoconversion of KiKGR:
Mice were anesthetized with 3% isoflurane (vol/vol). Incision of the skin above the skull was realized to expose the skull from in between the eyes to the lower part of the cerebellum. Aluminum foil is used to cover the mouse except the skull to ensure local conversion. Photoconversion was performed using an Optogenetics-LED-Violet module (Prizmatix) for 2 min at an intensity of 6 with the light source placed at 1cm above the skull. Mice were then sutured and allowed to recover on a heating pad until responsive. Post-surgery, mice were giver analgesic subcutaneously. For DC migration experiments, skull bone of anesthetized mice was exposed to violet light for 3 min per spot in 3 locations – 2 spots above the transverse sinus and 1 spot in the center of the superior sagittal sinus. Immediately after illumination, Kikume green fluorescent (KiKG+) meningeal cells become red fluorescent (KiKR+)58. Repeated conversion led to a photoconversion efficiency of 70–92% of CD45 cells in the meninges (with differential effect depending on the population – indicated in the text). Soluble peptide (10µg GP33–42/KAVYNFATC) and 2µg of poly(I:C) were injected i.c.m. to mobilize local DCs.
Diphtheria toxin and tamoxifen injection:
Prox1CreERT2::DTRfl/fl mice and Prox1CreERT2 were injected i.c.m. with 250ng, 25ng. 2.5ng or 0.25ng of diphtheria toxin (Merck4Biosciences). Injections were repeated 4 and 7 days after the initial injection. Mice weight and survival were followed for 10 days. Meninges of surviving mice were analyzed by immunohistochemistry. Prox1CreERT2::DTAfl/fl mice and Prox1CreERT2 were injected i.c.m. with 0.1mg/µl of 4-hydroxitamoxifen (1 injection, 4µl total, Sigma Aldrich) or 100µg, 20µg or 10µg of 4-hydroxitamoxifen (3 injection every 3 days, 4µl total, Sigma Aldrich). Mice weight and survival were followed for 10 days. Meninges of surviving mice were analyzed by immunohistochemistry.
Generation of dendritic cells and labeling:
DCs were generated from flushed femurs and tibiae bone marrow suspension as previously described55,59. At day 8 of culture with GM-CSF (20 ng/ml recombinant protein; eBioscience), DCs were matured over-night with lipopolysaccharide (200 ng/ml LPB-EB Ultrapure; Invivogen). Wild-type or CCR7-KO DCs were differently labeled with 5µM CFSE (eBioscience) or 10µM TAMRA (Molecular Probes) in serum-free RPMI medium for 20min at room temperature and washed twice with complete RPMI, then resuspended at a concentration of 2.5×10⁵ cells/µl for i.c.m. injection (2µl total).
T cells isolation and labeling:
Mice were euthanized with an i.p. injection of Euthasol. Spleen and lymph nodes (inguinal, brachial, axillary, cervical, mesenteric and lumbar) were harvested and gently pressed through a 70µm nylon mesh cell strainers (Fisher) with sterile plastic plunger (BD Biosciences) to yield a single cell suspension. Red blood cells were lysed by 5min incubation in ACK lysis buffer (Quality Biologicals). T cells were then enriched using the EasySep Mouse CD4 T cells isolation kit (STEMCELL Technologies) following manufacturer’s instructions.
To generate activated memory T cells, purified CD4 T cells were plated at 1×10⁶ cells/ml in a petri dish previously coated with 2µg/ml of anti-CD3 (clone 17A2, BioXCell) and anti-CD28 (clone PV-1, BioXCell) O/N. After 48h, cells were transferred into a new petri dish with 50% fresh media (RPMI (Gibco) with 10% FBS (Atlas Biologicals), 1% penicillin/streptomycin (Gibco), 1% L-glutamine (Gibco), and 50µM β-mercaptoethanol (Gibco)) supplemented with 100u/ml of rIL-2 (eBioscience). IL-2 supplementation was repeated every other day until day 9. Cells were split in half and supplemented with fresh media on day 5.
Prior to injection, T cells were labeled with CFSE (eBioscience), CellTracker Deep Red Dye (ThermoFisher) or CellTrace Violet (ThermoFisher) following manufacturer’s instructions. T cells (1 million total in 2µl) were injected i.c.m. into anesthetized mice (ketamine/xylazine, i.p.) using a Hamilton syringe with a 33-gauge needle.
Pertussis Toxin treatment:
As previously described60, isolated T cells were incubated for 2h at 37C with 200ng/ml of PTX (List Biological) in media (RPMI (Gibco) with 10% FBS (Atlas Biologicals), 1% penicillin/streptomycin (Gibco), 1% L-glutamine (Gibco), and 50µM β-mercaptoethanol (Gibco)). Cells were then washed 3 times with media and labeled prior to injection.
Tissue collection and processing:
Mice were euthanized with and i.p. injection of Euthasol and perfused with 0.1M of PBS (10–15ml/mouse).
−Lymph nodes were harvested using forceps and placed in PBS with 4% paraformaldehyde (PFA) overnight for immunohistochemistry. For flow cytometry, LNs were either digested with collagenase D (1 mg/ml; Roche) and DNAse (50U/ml; Sigma) for 30 min at 37C or kept in ice-cold FACS buffer (pH7.4; 0.1M PBS; 1mM EDTA; 1% BSA) before mechanical dissociation using a piston and 70 um nylon filter mesh (Fisher Scientific). DCLNs were harvested from the side of the internal jugular vein while the sCLNs were harvested from the upper part of the salivary gland. For IHC, lymph nodes were transferred in PBS containing 30% sucrose O/N at 4C. Lymph nodes were then embedded in OCT and 30µm thick sections were sliced onto gelatin-coated slides on a cryostat (Leica).
−Skin was then removed from the head and the muscles were stripped of the bone. After removal of the mandibles, the nose was sectioned (below the olfactory bulbs) with a scalpel and placed in PBS with 4% PFA for 72 hours. The noses were the decalcified by incubation in PBS with 0.1M of EDTA for 6 days (with daily change of the decalcification solution) and transferred in PBS with 30% sucrose O/N. Noses were then embedded in OCT and 50µm thick section (coronal or sagittal) were sliced onto gelatin-coated slides on a cryostat (Leica).
−Brains were places in 4% paraformaldehyde (PFA) solution for 3 days, transferred in PBS with 30% sucrose O/N, embedded in OCCT and 40µm thick section (coronal) were sliced on a cryostat (Leica).
−Whole mount meninges were fixed while still attached to the skullcap in PBS with 2% PFA for 24h at 4C (for IHC) or dissected and transferred in ice-cold FACS buffer for flow cytometry. Meninges (dura/arachnoid) were the dissected from the skullcap.
−Spinal columns were fixed in PBS with 4% PFA for 2 days at 4C. The bone on the ventral side of the vertebrae was cut laterally and taken off to expose the spinal cord. Nervous tissue was dissected with fine forceps, meninges cut along the ventral site and pealed from the spinal cord as a whole.
Immunohistochemistry:
Whole mount and section were incubated with PBS containing 2% of normal serum (either goat or chicken), 1% BSA, anti-CD16/32 (eBioscience, 1:1000) 0.1% Triton-X-100 and 0.05% Tween 20 for 1h at room temperature (RT), followed by incubation with appropriate dilutions (1:200) of primary antibodies O/N at 4C in PBS containing 1% BSA and 0.5% Triton-X-100. Primary antibodies used were: Anti-alpha smooth muscle actin (C6198; Sigma Aldrich); Goat polyclonal anti-CCL21 (AF457; R&D Systems); Rat anti-CD3e (12–0032-81; BD Biosciences); Armenian hamster anti-CD31 (MAB1398.Z; Millipore); Mouse anti-Claudin-5 AF488 conjugated (352588; ThermoFisher); Rabbit anti-GFAP (Z0334; Dako); Goat anti-Iba1(ab5076; Abcam); Rabbit anti-Laminin1&2 (ab7463; Abcam); Rat anti-Lyve-1 biotinylated (13–0443-82; eBioscience); Rat anti-Lyve-1 AF488 conjugated (53–0443-82; eBioscience); Rat anti-Lyve-1 eF660 conjugated (50–0443-82, eBioscience); Syrian hamster anti-podoplanin biotinylated (12–5381-82; eBioscience); Goat anti-VEGFR3 (AF743; R&D Systems); Rat anti-VE-cadherin (CD144) biotinylated (13–1441-80; eBioscience); and Chicken polyclonal anti-beta3-tubulin (Ab9354; Chemicon). Whole mounts and sections were washed 3 times for 5 min RT with PBS followed by incubation with Alexa-fluor 488/594/647 chicken/goat antibodies (Invitrogen, 1:1000), Alexa-fluor 594/647 goat anti-Armenian Hamster IgG antibodies (Jackson ImmunoResearch, 1:1000) or BV480 conjugated streptavidin (BD Biosciences, 1:500) for 1h at RT in PBS with 1% BSA and 0.5% Triton-X-100. After 5 min in 1:20 000 DAPI reagent (Sigma-Aldrich), whole mount and sections were washed with PBS and mounted with Aqua-Mount (Lerner) under coverslips.
Image analysis:
Images were acquired with a Leica TCS SP8 confocal system (Leica Microsystems) using the LSA AF software. Images were acquired with a 10X objective with 0.25NA or 20X objective with 0.70NA, with a resolution of 512×512 or 1024×1024 resolution with a z-step of 4µm. Quantitative assessments were performed using FIJI software (NIH) or Imaris software (Bitplane). Density of injected T cells or dendritic cells was determined by dividing the number of labeled T cells/DCs per section by the area of the lymph node section. Beads coverage was quantified by dividing the area occupied by the beads over the area of the lymph nodes. Every other section covering the totality of the lymph nodes were quantified (Around 15 to 20 section per lymph nodes). Lymphatic ablation was measure either by dividing the area occupied by Lyve-1 immunostaining by the area of the sinus or by dividing the total length of lymphatics by the total length of the sinuses. Macrophages size was determined by averaging the Iba1+ area of 10 individual cells randomly chosen per animal.
Statistical analyses were performed using GraphPad Prism software. Specific statistical tests are presented in the text for each experiment. Outlier samples were eliminated using Grubbs’ test with a significance level of 0.05. No estimate of variation between groups was performed.
Flow Cytometry:
Mice were perfused with 0.1M PBS (10–15ml). Meninges, lymph nodes, spleen and spinal cord were then dissected. Lymph nodes and spleen were either digested with collagenase D (1 mg/ml; Roche) and DNAse I (50U/ml) or gently pressed through 70µm nylon mesh cell strainers with sterile plastic plunger (BD Biosciences) to yield a single cell suspension. For spinal cord, they were stripped of their meninges prior to digestion for 45min in 4U/ml of papain (Worthington Biochemical) and 50U/ml of DNAse I (Sigma Aldrich) at 37C prior to being strained. Cells were then centrifuged at 300g at 25°C for 10 min. Spinal cord cells were resuspended in 37% Percoll (Fisher) and centrifuged at 1200g for 30 min without brake. Meninges were digested 15min at 37C with 1.4U/ml of Collagenase VIII (Sigma Aldrich) and 35U/ml of DNAse I (Sigma Aldrich) in complete media (DMEM (Gibco) with 2% FBS (Atlas Biologicals), 1% L-Glutamine (Gibco), 1% penicillin/streptomycin (Gibco), 1% Sodium pyruvate (Gibco), 1% non-essential amino-acid (Gibco) and 1.5% Hepes (Gibco)). The cell pellets (for all tissues) were resuspended in ice-cold FACS buffer (pH7.4; 0.1M PBS; 1mM EDTA and 1% BSA). Cells were stained for extracellular marker with the following antibodies at a 1:200 dilution: Rat monoclonal anti-B220 PE conjugated (553090; BD Biosciences); Rat anti-CCR7 APC conjugated (17–1971-63; Biolegend); Rat anti-CD4 APC conjugated (553051; BD Biosciences); Rat anti-CD4 PerCP-Cy5.5 conjugated (550954; BD Biosciences); Rat anti-CD8 Pacific blue conjugated (558106; BD Biosciences); Rat anti-CD11b PE conjugated (12–0112-82; eBioscience); Armenian hamster anti-CD11c PE conjugated (12–0114-82; eBioscience); Armenian hamster anti-CD11c BV421 conjugated (562782; BD Bioscience); Armenian hamster anti-CD11c APC conjugated (17–0114-82; eBioscience); Rat anti-CD19 AF700 conjugated (557958; BD Biosciences); Rat anti-CD40 APC conjugated (17–0401-81; eBioscience); Rat anti-CD44 APC conjugated (559250; BD Biosciences); Rat anti-CD45 Biotin conjugated (553078; BD Biosciences); Rat anti-CD45 BV510 conjugated (563891; BD Biosciences); Rat anti-CD45 PerCP Cy5.5 conjugated (550994; BD Biosciences); Mouse anti-CD45.2 AF700 conjugated (109822; Biolegend); Hamster anti-CD54 PE conjugated (553253; BD Biosciences); Rat anti-CD62L PE-CF594 conjugated (562404; BD Biosciences); Rat anti-CD62L PE conjugated (12–0621-83; eBioscience); Armenian hamster anti-CD69 PE-Cy7 conjugated (552879; BD Biosciences); Armenian hamster CD80 APC conjugated (17–0801-81; eBioscience); Armenian hamster anti-CD103 APC conjugated (17–1031-82; eBioscience); Rat anti-CD106 FITC conjugated (11–1061-81; ThermoFisher); Rat anti-FoxP3 eFluor450 conjugated (48–5773-82; eBioscience); Anti-ICAM PE conjugated (12–0549-42; ThermoFisher) Rat anti-IFNγ FITC conjugated (554411; BD Biosciences); Rat anti-IL-17 PerCP-Cy5.5 conjugated (45–7177-82; eBioscience); Rat anti-IL-17A AF700 conjugated (560820; BD Biosciences); Rat anti-Ly6C PerCP-Cy5.5 conjugated (560525; BD Biosciences); Rat anti-Ly6G AF700 conjugated (561236; BD Biosciences); Rat anti-I-A/I-E PE conjugated (12–5321-82; eBioscience); Rat anti-I-A/I-E PE-Cy7 conjugated (25–5321-82; eBioscience); Mouse anti-NK1.1 PE-Cy7 conjugated (552878; BD Biosciences); Rat anti-Siglec-F BV421 conjugated (562681; BD Biosciences); Armenian hamster anti-TCRb APC-Cy7 conjugated (557656; BD Biosciences); Armenian hamster anti-TCRb FITC conjugated (11–5961-85; eBioscience); Armenian hamster anti-TCRb BV711 conjugated (563613; BD Biosciences); Armenian hamster anti-TCRb BV510 conjugated (563221; BD Biosciences); Rat anti-Thy1.2 FITC conjugated (553013 – BD Biosciences) and Armenian hamster anti-TCRb PE conjugated (12–5961-81; eBioscience).. Cells were then fixed in 1% PFA in 0.1M pH7.4 PBS. For intracellular staining, cells where fixed and permeabilized following manufacturers instruction (BD Biosciences) then incubated with antibodies directed towards intracellular markers diluted in Perm/Wash buffer (BD Biosciences). Fluorescence data were collected with a Gallios (Beckman Coulter) then analyzed using FlowJo software (Treestar). Single cells were gated using the height, area and the pulse width of the forward and side scatter, then cells were selected for being live cells using the LIVE/DEAD Fixable Dead Cell Strain Kit per the manufacturer’s instructions (Invitrogen). Cells were then gated for the appropriate marker of cell type. An aliquot of unstained cells was counted using Cellometer Auto2000 (Nexcelor) to provide accurate cell count from the samples. Data processing was done with Excel and statistical analysis performed using GraphPad Prism.
T cell activation and proliferation:
Splenocytes were collected from mice at D8 of EAE development. Cells were labeled with CellTrace Violet (ThermoFisher) following manufacturer’s instructions and plated at 500 000 cells/200µl with CD3/CD28 (2µg/ml each, BioXCell) or increasing concentration of MOG35–55 (CSbio) for 72h. Data were acquired on a Gallios (Beckman Coulter) and analyzed with FlowJo software (Treestar). Splenocytes and dCLN were collected from mice at D8 of EAE development and stimulated for 6h with 20ng/ml PMA (eBioscience), 1µg/ml ionomycin (eBioscience), and 10µg/ml Brefeldin A (Sigma Aldrich). Cells were then washed and immunostained.
Cell sorting and RNAseq analysis:
To FACS sort lymphatic endothelial cells (LEC), meninges, skin (ear) and diaphragm were collected after euthanization and systemic perfusion with PBS. Skin and diaphragm were physically minced prior to digestion. Tissues were incubated for 15min at 37C with 1.4U/ml of Collagenase VIII (Sigma Aldrich) and 35U/ml of DNAse I (Sigma Aldrich) in complete media (DMEM (Gibco) with 2% FBS (Atlas Biologicals), 1% L-Glutamine (Gibco), 1% penicillin/streptomycin (Gibco), 1% Sodium pyruvate (Gibco), 1% non-essential amino-acid (Gibco) and 1.5% Hepes (Gibco)). Tissues were then pelleted after filtration through a 70µm nylon mesh cell strainer and immunostained as described before. To FACS sort T cells, spleen and lymph nodes were harvested after euthanization and systemic perfusion with PBS. A single cell suspension was obtained by gentle pressing on a 70µm nylon mesh cell strainer. Cells were then immunostained as previously described. Cells were sorted in a 96well plate in 100µl of lysis buffer (Arcturus PicoPure RNA Isolation Kit) using the Influx Cell Sorter (BD Biosciences).
RNA was isolated from FACS sorted cells using the Arcturus PicoPure RNA Isolation Kit. For RNA sequencing, all post processing (including linear RNA amplification and cDNA library generation) and sequencing was performed by Hudson Alpha Genomic Services Laboratory.
The raw sequencing reads (FASTQ files) went through two stages of processing to remove low quality reads and bases as previously published61. First, they were chastity filtered, which removes any clusters that have a higher than expected intensity of the called base compared to other bases. Then they were trimmed with Trimmomatic to remove low quality bases (minimum read length after trimming = 36). After processing, the quality of the reads was evaluated using FastQC, and after passing quality control (QC), were aligned to the UCSC mm9 genome using the splice-aware read aligner STAR. The quality of the alignments was next assessed by SAMStat, and low quality alignments were removed with samtools (MAPQ<10). Next, the number of reads aligning to each gene was quantified with HTSeq, and then the Bioconductor package. DESeq2 was used to normalize the raw counts, perform exploratory analysis (e.g., PCA), and differential expression analysis. The Benjamini-Hochberg false discovery rate procedure was used to correct the p-values for multiple testing. Heatmaps of the differentially expressed genes generated with the R package heatmap, and the T implementation of Fisher’s exact test (fisher.test) was used to identify enriched gene sets in the differentially expressed gens using the gene set collections from MSigDB (C5) and the gene families from the Hugo Gene Nomenclature Committer (HGNC).
Multiplex Immunoassay:
Cerebrospinal fluid was collected from the cisterna magna (see intra cisterna magna injection for animal preparation) under a dissection microscope using a glass capillary (Sutter Instrument, B100–50-10, pulled with a Sutter Instrument P-30 micropipette puller to a size of 0.5 mm in diameter). 10 μl of the obtained volume from two mice was pooled and used for the quantification of cytokines using Luminex magnetic beads following the Bio-Plex Pro Mouse Chemokine Panel 33-plex instruction (Bio-Rad). Data were acquired with a Bio-Plex 200 with HTF and analyzed with the Bio-Plex Manager software Version 6.1.
Multiplex Immunoassay:
Sample sizes were chosen on the basis of standard power calculations (with α = 0.05 and power of 0.8) performed for similar experiments. In general, statistical methods were not used to re-calculate or predetermine sample sizes. The Kolmogorov–Smirnov test was used to assess normal distribution of the data or data distribution was assumed to be normal but this was not formally tested. Variance was similar within comparable experimental groups. Animals from different cages, but within the same experimental group, were selected to assure randomization. Experimenters were blinded to the identity of experimental groups from the time of euthanasia until the end of data collection and analysis for at least one of the independent experiments. Statistical tests for each figure were justified to be appropriate. One-way ANOVA, with appropriate multiple comparison tests was used to compare three independent groups. Two-group comparisons were made using two-tailed unpaired student t test. For comparisons of multiple factors, two-way ANOVA with appropriate multiple comparison tests was used. Repeated-measures two-way ANOVA with appropriate multiple comparison tests was used for clinical symptoms evaluation with repeated observations. Statistical analysis (data are always presented as mean ± s.e.m.) was performed using Prism 6.0a (GraphPad Software, Inc.).
Data Availability:
All RNA-seq data sets are available online (GEO database) under the accession numbers: LEC experiment is GSE99743 and the T cell lymphatic ablation experiment is GSE99764. The data that supports the finding of the study are available from the corresponding authors upon request.
Supplementary Material
Acknowledgements:
We would like to thank S. Smith for editing the manuscript. We also thank all the members of the Kipnis lab and the members of the Center for Brain Immunology and Glia (BIG) for their valuable comments during multiple discussions of this work. This work was supported by grants from the National Institutes of Health (AG034113 and NS096967), National Multiple Sclerosis Society (NMSS), and the German Research Council (DFG; CRC-TR-128, B11) to J.K., National Institutes of Health HL073402 to G.O, and by LE&RN Postdoctoral Fellowship Award to A.L.
Footnotes
Competing interests: J.K. is an Advisor to PureTech Health/Ariya.
References:
- 1.Louveau A et al. Structural and functional features of central nervous system lymphatic vessels. Nature 523, 337–341, doi: 10.1038/nature14432 (2015). [DOI] [PMC free article] [PubMed] [Google Scholar]
- 2.Kida S, Pantazis A & Weller RO CSF drains directly from the subarachnoid space into nasal lymphatics in the rat. Anatomy, histology and immunological significance. Neuropathol Appl Neurobiol 19, 480–488 (1993). [DOI] [PubMed] [Google Scholar]
- 3.Cserr HF, Harling-Berg CJ & Knopf PM Drainage of brain extracellular fluid into blood and deep cervical lymph and its immunological significance. Brain Pathol 2, 269–276 (1992). [DOI] [PubMed] [Google Scholar]
- 4.Iliff JJ et al. A paravascular pathway facilitates CSF flow through the brain parenchyma and the clearance of interstitial solutes, including amyloid beta. Sci Transl Med 4, 147ra111, doi: 10.1126/scitranslmed.3003748 (2012). [DOI] [PMC free article] [PubMed] [Google Scholar]
- 5.Go KG, Houthoff HJ, Hartsuiker J, Blaauw EH & Havinga P Fluid secretion in arachnoid cysts as a clue to cerebrospinal fluid absorption at the arachnoid granulation. J Neurosurg 65, 642–648, doi: 10.3171/jns.1986.65.5.0642 (1986). [DOI] [PubMed] [Google Scholar]
- 6.Ma Q, Ineichen BV, Detmar M & Proulx ST Outflow of cerebrospinal fluid is predominantly through lymphatic vessels and is reduced in aged mice. Nat Commun 8, 1434, doi: 10.1038/s41467-017-01484-6 (2017). [DOI] [PMC free article] [PubMed] [Google Scholar]
- 7.Kipnis J Multifaceted interactions between adaptive immunity and the central nervous system. Science 353, 766–771, doi: 10.1126/science.aag2638 (2016). [DOI] [PMC free article] [PubMed] [Google Scholar]
- 8.Aspelund A et al. A dural lymphatic vascular system that drains brain interstitial fluid and macromolecules. J Exp Med 212, 991–999, doi: 10.1084/jem.20142290 (2015). [DOI] [PMC free article] [PubMed] [Google Scholar]
- 9.Engelhardt B, Vajkoczy P & Weller RO The movers and shapers in immune privilege of the CNS. Nat Immunol 18, 123–131, doi: 10.1038/ni.3666 (2017). [DOI] [PubMed] [Google Scholar]
- 10.Louveau A et al. Understanding the functions and relationships of the glymphatic system and meningeal lymphatics. J Clin Invest 127, 3210–3219, doi: 10.1172/JCI90603 (2017). [DOI] [PMC free article] [PubMed] [Google Scholar]
- 11.Andres KH, von During M, Muszynski K & Schmidt RF Nerve fibres and their terminals of the dura mater encephali of the rat. Anat Embryol (Berl) 175, 289–301 (1987). [DOI] [PubMed] [Google Scholar]
- 12.Absinta M et al. Human and nonhuman primate meninges harbor lymphatic vessels that can be visualized noninvasively by MRI. Elife 6, doi: 10.7554/eLife.29738 (2017). [DOI] [PMC free article] [PubMed] [Google Scholar]
- 13.Kamphorst AO, Guermonprez P, Dudziak D & Nussenzweig MC Route of antigen uptake differentially impacts presentation by dendritic cells and activated monocytes. J Immunol 185, 3426–3435, doi: 10.4049/jimmunol.1001205 (2010). [DOI] [PMC free article] [PubMed] [Google Scholar]
- 14.Baluk P et al. Functionally specialized junctions between endothelial cells of lymphatic vessels. J Exp Med 204, 2349–2362, doi: 10.1084/jem.20062596 (2007). [DOI] [PMC free article] [PubMed] [Google Scholar]
- 15.Castren E & Antila H Neuronal plasticity and neurotrophic factors in drug responses. Mol Psychiatry 22, 1085–1095, doi: 10.1038/mp.2017.61 (2017). [DOI] [PMC free article] [PubMed] [Google Scholar]
- 16.Foldi M et al. New contributions to the anatomical connections of the brain and the lymphatic system. Acta Anat (Basel) 64, 498–505 (1966). [DOI] [PubMed] [Google Scholar]
- 17.Antila S et al. Development and plasticity of meningeal lymphatic vessels. J Exp Med 214, 3645–3667, doi: 10.1084/jem.20170391 (2017). [DOI] [PMC free article] [PubMed] [Google Scholar]
- 18.Hennet T, Hagen FK, Tabak LA & Marth JD T-cell-specific deletion of a polypeptide N-acetylgalactosaminyl-transferase gene by site-directed recombination. Proc Natl Acad Sci U S A 92, 12070–12074 (1995). [DOI] [PMC free article] [PubMed] [Google Scholar]
- 19.Derecki NC et al. Regulation of learning and memory by meningeal immunity: a key role for IL-4. J Exp Med 207, 1067–1080, doi: 10.1084/jem.20091419 (2010). [DOI] [PMC free article] [PubMed] [Google Scholar]
- 20.Ziarek JJ et al. Structural basis for chemokine recognition by a G protein-coupled receptor and implications for receptor activation. Sci Signal 10, doi: 10.1126/scisignal.aah5756 (2017). [DOI] [PMC free article] [PubMed] [Google Scholar]
- 21.Debes GF et al. Chemokine receptor CCR7 required for T lymphocyte exit from peripheral tissues. Nat Immunol 6, 889–894, doi: 10.1038/ni1238 (2005). [DOI] [PMC free article] [PubMed] [Google Scholar]
- 22.Weber M et al. Interstitial dendritic cell guidance by haptotactic chemokine gradients. Science 339, 328–332, doi: 10.1126/science.1228456 (2013). [DOI] [PubMed] [Google Scholar]
- 23.Randolph GJ, Ivanov S, Zinselmeyer BH & Scallan JP The Lymphatic System: Integral Roles in Immunity. Annu Rev Immunol 35, 31–52, doi: 10.1146/annurev-immunol-041015-055354 (2017). [DOI] [PMC free article] [PubMed] [Google Scholar]
- 24.Clarkson BD et al. CCR7 deficient inflammatory Dendritic Cells are retained in the Central Nervous System. Sci Rep 7, 42856, doi: 10.1038/srep42856 (2017). [DOI] [PMC free article] [PubMed] [Google Scholar]
- 25.Wigle JT & Oliver G Prox1 function is required for the development of the murine lymphatic system. Cell 98, 769–778 (1999). [DOI] [PubMed] [Google Scholar]
- 26.Harvey NL et al. Lymphatic vascular defects promoted by Prox1 haploinsufficiency cause adult-onset obesity. Nat Genet 37, 1072–1081, doi: 10.1038/ng1642 (2005). [DOI] [PubMed] [Google Scholar]
- 27.Lavado A & Oliver G Prox1 expression patterns in the developing and adult murine brain. Dev Dyn 236, 518–524, doi: 10.1002/dvdy.21024 (2007). [DOI] [PubMed] [Google Scholar]
- 28.Tammela T et al. Photodynamic ablation of lymphatic vessels and intralymphatic cancer cells prevents metastasis. Sci Transl Med 3, 69ra11, doi: 10.1126/scitranslmed.3001699 (2011). [DOI] [PubMed] [Google Scholar]
- 29.Kim H, Kataru RP & Koh GY Inflammation-associated lymphangiogenesis: a double-edged sword? J Clin Invest 124, 936–942, doi: 10.1172/JCI71607 (2014). [DOI] [PMC free article] [PubMed] [Google Scholar]
- 30.Dendrou CA, Fugger L & Friese MA Immunopathology of multiple sclerosis. Nat Rev Immunol 15, 545–558, doi: 10.1038/nri3871 (2015). [DOI] [PubMed] [Google Scholar]
- 31.Ajami B et al. Single-cell mass cytometry reveals distinct populations of brain myeloid cells in mouse neuroinflammation and neurodegeneration models. Nat Neurosci 21, 541–551, doi: 10.1038/s41593-018-0100-x (2018). [DOI] [PMC free article] [PubMed] [Google Scholar]
- 32.Proescholdt MA, Jacobson S, Tresser N, Oldfield EH & Merrill MJ Vascular endothelial growth factor is expressed in multiple sclerosis plaques and can induce inflammatory lesions in experimental allergic encephalomyelitis rats. J Neuropathol Exp Neurol 61, 914–925 (2002). [DOI] [PubMed] [Google Scholar]
- 33.Cursiefen C et al. Thrombospondin 1 inhibits inflammatory lymphangiogenesis by CD36 ligation on monocytes. J Exp Med 208, 1083–1092, doi: 10.1084/jem.20092277 (2011). [DOI] [PMC free article] [PubMed] [Google Scholar]
- 34.Jurisic G et al. An unexpected role of semaphorin3a-neuropilin-1 signaling in lymphatic vessel maturation and valve formation. Circ Res 111, 426–436, doi: 10.1161/CIRCRESAHA.112.269399 (2012). [DOI] [PMC free article] [PubMed] [Google Scholar]
- 35.Makinen T et al. PDZ interaction site in ephrinB2 is required for the remodeling of lymphatic vasculature. Genes Dev 19, 397–410, doi: 10.1101/gad.330105 (2005). [DOI] [PMC free article] [PubMed] [Google Scholar]
- 36.Frye M et al. Matrix stiffness controls lymphatic vessel formation through regulation of a GATA2-dependent transcriptional program. Nature Communications 9, doi: ARTN 1511 10.1038/s41467-018-03959-6 (2018). [DOI] [PMC free article] [PubMed] [Google Scholar]
- 37.Yeh YT et al. Matrix Stiffness Regulates Endothelial Cell Proliferation through Septin 9. Plos One 7, doi:ARTN e46889 10.1371/journal.pone.0046889 (2012). [DOI] [PMC free article] [PubMed] [Google Scholar]
- 38.Furtado GC et al. Swift entry of myelin-specific T lymphocytes into the central nervous system in spontaneous autoimmune encephalomyelitis. J Immunol 181, 4648–4655 (2008). [DOI] [PMC free article] [PubMed] [Google Scholar]
- 39.Phillips MJ, Needham M & Weller RO Role of cervical lymph nodes in autoimmune encephalomyelitis in the Lewis rat. J Pathol 182, 457–464, doi: (1997). [DOI] [PubMed] [Google Scholar]
- 40.van Zwam M et al. Surgical excision of CNS-draining lymph nodes reduces relapse severity in chronic-relapsing experimental autoimmune encephalomyelitis. J Pathol 217, 543–551, doi: 10.1002/path.2476 (2009). [DOI] [PubMed] [Google Scholar]
- 41.Rottman JB et al. Leukocyte recruitment during onset of experimental allergic encephalomyelitis is CCR1 dependent. Eur J Immunol 30, 2372–2377, doi: (2000). [DOI] [PubMed] [Google Scholar]
- 42.Guan YJ et al. Phospho-SXXE/D motif mediated TNF receptor 1-TRADD death domain complex formation for T cell activation and migration. J Immunol 187, 1289–1297, doi: 10.4049/jimmunol.1003399 (2011). [DOI] [PMC free article] [PubMed] [Google Scholar]
- 43.Wu X, Lahiri A, Haines GK 3rd, Flavell RA & Abraham C NOD2 regulates CXCR3-dependent CD8+ T cell accumulation in intestinal tissues with acute injury. J Immunol 192, 3409–3418, doi: 10.4049/jimmunol.1302436 (2014). [DOI] [PMC free article] [PubMed] [Google Scholar]
- 44.Jeker LT & Bluestone JA MicroRNA regulation of T-cell differentiation and function. Immunol Rev 253, 65–81, doi: 10.1111/imr.12061 (2013). [DOI] [PMC free article] [PubMed] [Google Scholar]
- 45.Brinker T, Stopa E, Morrison J & Klinge P A new look at cerebrospinal fluid circulation. Fluids Barriers CNS 11, 10, doi: 10.1186/2045-8118-11-10 (2014). [DOI] [PMC free article] [PubMed] [Google Scholar]
- 46.Cai R, P. C, Ghasemigharagoz A, Torodov M,I, Foerstera B, Zhao S, Bhatia H,S, Mrowka L, Theodorou D, Rempfler M, Xavier A, Kress B,T, Benakis C, Liesz A, Menze B, Kerschensteiner M, Nedergaard M, Eturk A. Panoptic vDISCO imaging reveals neuronal connectivity, remote trauma effects and meningeal vessels in intact transparent mice. bioRxiv, doi: 10.1101/374785 (2018). [DOI]
- 47.Mollanji R, Bozanovic-Sosic R, Zakharov A, Makarian L & Johnston MG Blocking cerebrospinal fluid absorption through the cribriform plate increases resting intracranial pressure. Am J Physiol Regul Integr Comp Physiol 282, R1593–1599, doi: 10.1152/ajpregu.00695.2001 (2002). [DOI] [PubMed] [Google Scholar]
- 48.Odoardi F et al. T cells become licensed in the lung to enter the central nervous system. Nature 488, 675–679, doi: 10.1038/nature11337 (2012). [DOI] [PubMed] [Google Scholar]
- 49.Mora JR et al. Reciprocal and dynamic control of CD8 T cell homing by dendritic cells from skin-and gut-associated lymphoid tissues. J Exp Med 201, 303–316, doi: 10.1084/jem.20041645 (2005). [DOI] [PMC free article] [PubMed] [Google Scholar]
- 50.Zozulya AL et al. Intracerebral dendritic cells critically modulate encephalitogenic versus regulatory immune responses in the CNS. J Neurosci 29, 140–152, doi: 10.1523/JNEUROSCI.2199-08.2009 (2009). [DOI] [PMC free article] [PubMed] [Google Scholar]
- 51.Kilarski WW et al. Optimization and regeneration kinetics of lymphatic-specific photodynamic therapy in the mouse dermis. Angiogenesis 17, 347–357, doi: 10.1007/s10456-013-9365-6 (2014). [DOI] [PMC free article] [PubMed] [Google Scholar]
- 52.Wachowska M et al. Investigation of cell death mechanisms in human lymphatic endothelial cells undergoing photodynamic therapy. Photodiagnosis Photodyn Ther 14, 57–65, doi: 10.1016/j.pdpdt.2016.02.004 (2016). [DOI] [PubMed] [Google Scholar]
- 53.Ensari S et al. Venous outflow of the brain after bilateral complete jugular ligation. Turk Neurosurg 18, 56–60 (2008). [PubMed] [Google Scholar]
- 54.Kawajiri H, Furuse M, Namba R, Kotani J & Oka T Effect of internal jugular vein ligation on resorption of cerebrospinal fluid. J Maxillofac Surg 11, 42–45 (1983). [DOI] [PubMed] [Google Scholar]
- 55.Vogh BP, Godman DR & Maren TH Effect of AlCl3 and other acids on cerebrospinal fluid production: a correction. J Pharmacol Exp Ther 243, 35–39 (1987). [PubMed] [Google Scholar]
- 56.Ning B et al. Ultrasound-aided Multi-parametric Photoacoustic Microscopy of the Mouse Brain. Sci Rep 5, 18775, doi: 10.1038/srep18775 (2015). [DOI] [PMC free article] [PubMed] [Google Scholar]
- 57.Coles JA et al. Intravital imaging of a massive lymphocyte response in the cortical dura of mice after peripheral infection by trypanosomes. PLoS Negl Trop Dis 9, e0003714, doi: 10.1371/journal.pntd.0003714 (2015). [DOI] [PMC free article] [PubMed] [Google Scholar]
- 58.Nowotschin S & Hadjantonakis AK Use of KikGR a photoconvertible green-to-red fluorescent protein for cell labeling and lineage analysis in ES cells and mouse embryos. BMC Dev Biol 9, 49, doi: 10.1186/1471-213X-9-49 (2009). [DOI] [PMC free article] [PubMed] [Google Scholar]
- 59.Oshio K, Watanabe H, Song Y, Verkman AS & Manley GT Reduced cerebrospinal fluid production and intracranial pressure in mice lacking choroid plexus water channel Aquaporin-1. FASEB J 19, 76–78, doi: 10.1096/fj.04-1711fje (2005). [DOI] [PubMed] [Google Scholar]
- 60.Cyster JG & Goodnow CC Pertussis toxin inhibits migration of B and T lymphocytes into splenic white pulp cords. J Exp Med 182, 581–586 (1995). [DOI] [PMC free article] [PubMed] [Google Scholar]
- 61.Da Mesquita S et al. Functional aspects of meningeal lymphatics in ageing and Alzheimer’s disease. Nature, doi: 10.1038/s41586-018-0368-8 (2018). [DOI] [PMC free article] [PubMed]
Associated Data
This section collects any data citations, data availability statements, or supplementary materials included in this article.
Supplementary Materials
Data Availability Statement
All RNA-seq data sets are available online (GEO database) under the accession numbers: LEC experiment is GSE99743 and the T cell lymphatic ablation experiment is GSE99764. The data that supports the finding of the study are available from the corresponding authors upon request.