

Abstract
We previously showed that (+)-tramadol is metabolized in dog liver to (+)-M1 exclusively by CYP2D15 and to (+)-M2 by multiple CYPs, but primarily CYP2B11. However, (+)-M1 and (+)-M2 are further metabolized in dogs to (+)-M5, which is the major metabolite found in dog plasma and urine. In this study we identified canine CYPs involved in metabolizing (+)-M1 and (+)-M2 using recombinant enzymes, untreated dog liver microsomes (DLMs), inhibitor-treated DLMs, and DLMs from CYP inducer-treated dogs. A canine P-glycoprotein expressing cell line was also used to evaluate whether (+)-tramadol, (+)-M1, (+)-M2, or (+)-M5 are substrates of canine P-glycoprotein, thereby limiting their distribution into the central nervous system. (+)-M5 was largely formed from (+)-M1 by recombinant CYP2C21 with minor contributions from CYP2C41 and CYP2B11. (+)-M5 formation in DLMs from (+)-M1 was potently inhibited by sulfaphenazole (CYP2C inhibitor) and chloramphenicol (CYP2B11 inhibitor) and was greatly increased in DLMs from phenobarbital treated dogs. (+)-M5 was formed from (+)-M2 predominantly by CYP2D15. (+)-M5 formation from (+)-M1 in DLMs was potently inhibited by quinidine (CYP2D inhibitor) but had only a minor impact from all CYP inducers tested. Intrinsic clearance estimates showed over 50-times higher values for (+)-M5 formation from (+)-M2 compared with (+)-M1 in DLMs. This was largely attributed to the higher enzyme affinity (lower Km) for (+)-M2 compared with (+)-M1 as substrate. (+)-tramadol, (+)-M1, (+)-M2, or (+)-M5 were not p-glycoprotein substrates. This study provides a clearer picture of the role of individual CYPs in the complex metabolism of tramadol in dogs.
INTRODUCTION
Tramadol is a centrally acting analgesic widely used in dogs to treat mild to moderate pain of either acute or chronic origin. However, clinical studies and anecdotal reports indicate high variability in response between dogs (Cardozo, 2014; Delgado, 2014; Kongara, 2013; Kogel, 2014), which could result from variable metabolism of tramadol by the cytochrome P450 (CYP) enzymes as a consequence of genetic differences, drug-drug interactions, or other extrinsic influences.
Although the metabolism of tramadol has been extensively described in humans, the CYP enzymes involved in the initial metabolism of tramadol to the two primary metabolites O-desmethyltramadol (M1) and N-desmethyltramadol (M2) in dogs were only recently reported by our research group (Perez Jimenez, 2016). In that study, we showed that M1 (O-desmethyltramadol) is solely formed by canine CYP2D15, while M2 (N-desmethyltramadol) is formed by multiple CYPs including CYP2B11, CYP3A12, CYP2C21, and CYP2C41. This mirrors human drug metabolism well in that M1 is solely formed by CYP2D6, while M2 is formed by CYP2B6 and CYP3A4. We also showed that dog liver microsomes (DLMs), when compared with cat and human liver microsomes, do not produce high amounts of the M1 metabolite relative to the M2 metabolite. This may explain in part relatively low circulating concentrations of M1 in dogs (Kukanich, 2011; Giorgi, 2009; Kogel, 2014; Itami, 2013) compared with humans (Scott, 2000; Grond, 1999; Ardakani, 2007; Garcia Quetglas, 2007) and cats (Pypendop, 2008; Pypendop, 2009; Cagnardi, 2011) after administration of tramadol to each species. This is clinically relevant because M1, and not M2 or the parent compound, is thought to have analgesic properties mediated by μ-opioid agonist activity at therapeutic doses. (Raffa, 1992; Gillen, 2000).
Further oxidative metabolism of M1 and M2 is also possible through N-demethylation (of M1) or O-demethylation (of M2) to form the M5 metabolite (N,O-didesmethyltramadol). After tramadol administration to dogs, M5 was found in plasma at concentrations that were approximately similar to M2 and tramadol concentrations but higher (by about 20-fold) than M1 concentrations (Kukanich, 2011; Giorgi, 2009). However M5 has much weaker μ-opioid agonist efficacy and potency (by about 30 times) when compared with M1 by in vitro testing (Gillen, 2000). Furthermore, a recent study in rats indicates that M5 has lower penetration into the central nervous system (CNS) in that CSF to plasma concentration ratios after tramadol administration were less than 0.1 for M5, while M1, M2, and tramadol showed ratios of 0.3, 0.4, and 0.44, respectively (Sheikholeslami, 2016). This low ratio for M5 (3-fold less than M1) may be a consequence of higher polarity and lower membrane solubility, or active efflux from the CNS by a membrane transporter such as p-glycoprotein. Given the poor brain permeability and the low potency and efficacy of M5, the formation of M5 from M1 may contribute to reduction of the μ-opioid antinociceptive effects of M1. However, the identity of CYP enzymes forming M5 from M1 or from M2 have not been reported (for any species).
In this study, we initially evaluated species differences in the formation rates of (+)-M5 from (+)-M1 and from (+)-M2 by DLMs, compared with cat and human liver microsomes. We studied the (+)-enantiomers of the metabolites here since, although tramadol is used clinically as a racemic mixture, there is evidence that (+)-M1 is a more potent μ-opioid agonist than (−)-M1 (Gillen, 2000), and we have previously observed somewhat faster formation rates of (+)-M1 from tramadol compared with (−)-M1 formation (Perez Jimenez, 2016). We then used different approaches (canine recombinant enzymes, chemical inhibition and hepatic microsomes from inducer treated dog) to identify the CYPs involved in the formation of (+)-M5 from (+)-M1 and from (+)-M2 in dog liver. Given the structural similarities between (+)-tramadol compared with (+)-M1 and (+)-M2 as substrates (i.e. they only differ by a methyl group that is away from the demethylation site), we hypothesized that O-demethylation of (+)-M2 would be performed mainly by CYP2D15, while N-demethylation of (+)-M1 would be performed by multiple CYPs including CYP2B, CYP2C and CYP3A isoforms. Finally, we used a competitive transport assay to evaluate whether (+)-tramadol, (+)-M1, (+)-M2, or (+)-M5 are substrates of canine P-glycoprotein, which could limit CNS distribution via the blood-brain barrier.
MATERIALS AND METHODS
Reagents
(+)-N,O-didesmethyltramadol (#D441230), (+)-O-desmethyltramadol hydrochloride (#D294755), (+)-N-desmethyltramadol (#D294725), and racemic N,O-didesmethyltramadol-d3 (#D294702) were acquired from Toronto Research Chemicals Inc. (Toronto, Ontario, Canada). NADP+, isocitrate dehydrogenase, DL-isocitrate, chloramphenicol, sulfaphenazole and quinidine were purchased from Sigma-Aldrich (St. Louis, MO).
Recombinant canine CYPs expressed in Bactosomes (1A1, 1A2, 2B11, 2C21, 2C41, 2D15, 3A12, and 3A26; each co-expressed with canine P450 oxidoreductase) and the liver microsomes from male beagle dogs treated with corn oil, rifampin, β-naphthoflavone, saline, phenobarbital and clofibric acid were purchased from Xenotech LLC (Lenexa, KS). Additional canine liver microsomes (without treatment of inducers) were prepared as previously described (Court, 1997) from a bank of frozen dog livers maintained at Washington State University, Pharmacogenomics Laboratory. The livers were from 59 adult dogs including 25 Beagles (19 males, 6 females), 5 Greyhounds (all males), 12 Hounds (all females) 12 mixed breed dogs (6 females and 6 males), 4 Chihuahuas (3 males and 1 female), and one Labrador retriever (male). All dogs were healthy and were being euthanized for reasons unrelated to the present study. Feline liver microsomes were prepared from a bank of frozen cat livers maintained at Washington State University that were obtained from 16 domestic shorthair cats (11 males and 5 females). The collection of the dog and cat livers was approved by the Institutional Animal Care and Use Committee Washington State University (#04412). Human liver microsomes were prepared using frozen liver samples from 48 human donors with no known liver disease, which were provided by the International Institute for the Advancement of Medicine (Exton, PA), the Liver Tissue Procurement and Distribution System (University of Minnesota, Minneapolis), or the National Disease Research Interchange (Philadelphia, PA). These de-identified samples originally had been obtained under the approval of the Human Investigation Review Committee at the respective institutions. The use of these de-identified tissues for this study was approved by the Human Investigation Review Board at Washington State University. The bicinchoninic acid assay was used (Thermo Scientific Pierce, Rockford, Illinois) to measure the protein content of the dog, human and cat liver microsomes used in this study.
Assay to measure (+)-M5 formation rates from (+)-M1 and from (+)-M2
Assays were developed to measure the rate of formation of (+)-M5 from (+)-M1 and from (+)-M2 by dog, human and cat liver microsomes, and by recombinant canine CYPs. Briefly, incubations of 100 μL (final volume) were prepared containing 50 μL NADPH-regenerating system and enzyme consisting of either 10 μg DLMs for (+)-M1, 5 μg DLMs for (+)-M2 or one pmole of each recombinant CYP (25μL). The substrate was added (25μL) to start the reaction and consisted of either (+)-M1 (1–200 μM final concentration) or (+)-M2 (0.01–5 μM final concentration) dissolved in water buffered with 50 mM potassium phosphate at pH 7.4. Samples were incubated in a water bath at 37°C for 20 minutes when (+)-M1 was the substrate or for 5 minutes when (+)-M2 was the substrate. The reaction was stopped by adding 100 μL of ice cold internal standard (100 nmol racemic N,O-didesmethyltramadol-d3) in methanol, vortexed, centrifuged at 15,000 RCF for 10 minutes, and the supernatant was analysed by HPLC with mass spectrometry detection. Unless otherwise indicated, all experiments were performed at least in duplicate, repeated at least twice on separate days, and the results were averaged.
The HPLC apparatus (Agilent 1100, Agilent Technologies, Santa Clara, CA) was connected to a triple quadrupole mass spectrometry detector (AB-Sciex API4000, Applied Biosystems Life Technologies, Framingham, MA) operated in positive ion mode. The mobile phase consisted of 65% v/v water (containing 0.1% v/v formic acid) and 35% v/v methanol that was pumped at 1 mL per minute through a 2.1 mm x 50 mm 5 μ C18 column (Zorbax Eclipse XDB-C18, Phenomenex, Torrance, CA). Mass transitions monitored included m/z 236→44 (N,O-didesmethyltramadol) and m/z 239→47 (N,O-didesmethyltramadol-d3). The peak retention time for both N,O-didesmethyltramadol, and N,O-didesmethyltramadol-d3 was at 1.9 minutes after injection. The molar amount of metabolite formed was calculated using a standard curve generated using samples with known differing amounts of N,O-didesmethyltramadol and a fixed amount of internal standard. Enzyme activities were calculated by dividing these values by incubation time (in minutes) and enzyme content (in mg of protein for microsomes or pmoles of P450 for recombinant CYPs). Preliminary experiments were performed to confirm linearity in the formation rate of metabolite for microsomal protein concentrations up to 0.1 mg/ml and incubation time up to 20 minutes for (+)-M1 as substrate and 0.05 mg/ml and incubation time up to 5 minutes for (+)-M2 as substrate. Predicted dog liver activities for each recombinant CYP were also estimated by multiplying by the reported average abundance for each CYP measured by mass spectrometry in liver microsomes from 18 Beagle dogs. Abundance values (in pmoles P450 per mg microsomal protein) were 37, 35, 70, 56, 36, 93, and 2.7 for CYPs 1A2, 2B11, 2C21, 2D15, 2E1, 3A12, and 3A26, respectively.
Inhibition assays
Sulfaphenazole (100 μM), chloramphenicol (10 μM) and quinidine (10 μM) were evaluated as inhibitors of (+)-M5 formation rate by pooled DLMs and recombinant enzymes. Inhibitors dissolved in methanol were added to incubation tubes and dried down in a centrifugal vacuum. NADPH cofactor mix, and enzyme were added to the tube and pre-incubated at 37°C for 15 minutes. Enzyme consisted of either 10 μg of DLMs for (+)-M1, 5 μg of DLMs for (+)-M2, or 1 pmole of recombinant CYP2C21 or CYP2D15. (+)-M1 at 10 μM final concentration or (+)-M2 at 0.5 μM final concentration dissolved in phosphate buffer was then added and incubated for a further 20 minutes for (+)-M1 and 5 minutes for (+)-M2. The reaction was stopped by adding internal standard and the amount of metabolites formed were measured by HPLC as described above.
For all inhibition assays, samples were prepared in duplicate, (+)-M5 formation rates were averaged, and then expressed as a percentage of control incubations that lacked inhibitor.
Canine P-glycoprotein substrate assessment
A cell-based competitive efflux assay was used to determine whether tramadol, M1, M2, or M5 are substrates for canine P-glycoprotein as previously described (Mealey, 2017). Briefly, MDCK-PGP cells (a canine kidney cell line that overexpresses canine P-glycoprotein) were co-incubated with the test compound and the fluorescent P-glycoprotein substrate rhodamine 123, and the effect on rhodamine 123 efflux from the cells assessed by flow cytometry. Cells from the parental MDCK cell line were also tested as negative controls since they lack significant P-gp expression. The ratios of the mean fluorescence intensity of cells incubated with rhodamine 123 and an experimental compound to that of cells treated with rhodamine 123 alone were determined. These ratios were compared to ratios determined for a known canine P-glycoprotein substrate loperamide (1 μM concentration as a positive control) and a non-P-glycoprotein substrate carboplatin (1 μM concentration as a negative control) to determine whether each experimental compound could compete with efflux of rhodamine 123 (at 1 μM concentration). Test compounds evaluated were 1 μM concentration for (+)-M1, (+)-M2, and (+)-M5, while (+)-tramadol was evaluated at concentrations of 0.5 μM, 5 μM, and 50 μM. Experiments were performed in triplicate and repeated on three separate days.
Enzyme kinetic and statistical analyses
Kinetic and statistical analyses were performed using Sigmaplot 12 software (Systat, San Jose, CA). For enzyme kinetic analysis, enzyme kinetics parameters (Km and Vmax) were determined using the one enzyme Michaelis-Menten model using non-linear regression analysis. The model of best fit was evaluated based upon plots of fitted versus observed data. Enzyme kinetic analyses were performed using pooled DLMs (n = 59 of various breeds and sexes) and DLMs from 3 different dogs chosen at random from our liver bank (Dog 10 – female Greyhound; Dog 31 – male Beagle; Dog 46 – male Beagle).
RESULTS
Species differences in (+)-M5 formation rates from (+)-M1 and (+)-M2
The formation rates of (+)-M5 from (+)-M1 at 10 μM concentration (Fig. 1A) and from (+)-M2 at 0.5 μM concentration (Fig. 1B) were then compared using pooled liver microsomes from dogs (n = 59), humans (n = 48) and cats (n = 16). These substrate concentrations were chosen to approximate Km values for these activities based on preliminary studies using pooled DLMs. Pooled DLMs demonstrated the highest activities (by 3- to 19-fold) for both reactions compared with cat and human liver microsomes. Human and cat liver microsomes both displayed low activities with (+)-M1 as substrate, while cat liver microsomes were intermediate between human and DLMs with (+)-M2 as substrate.
Figure 1.
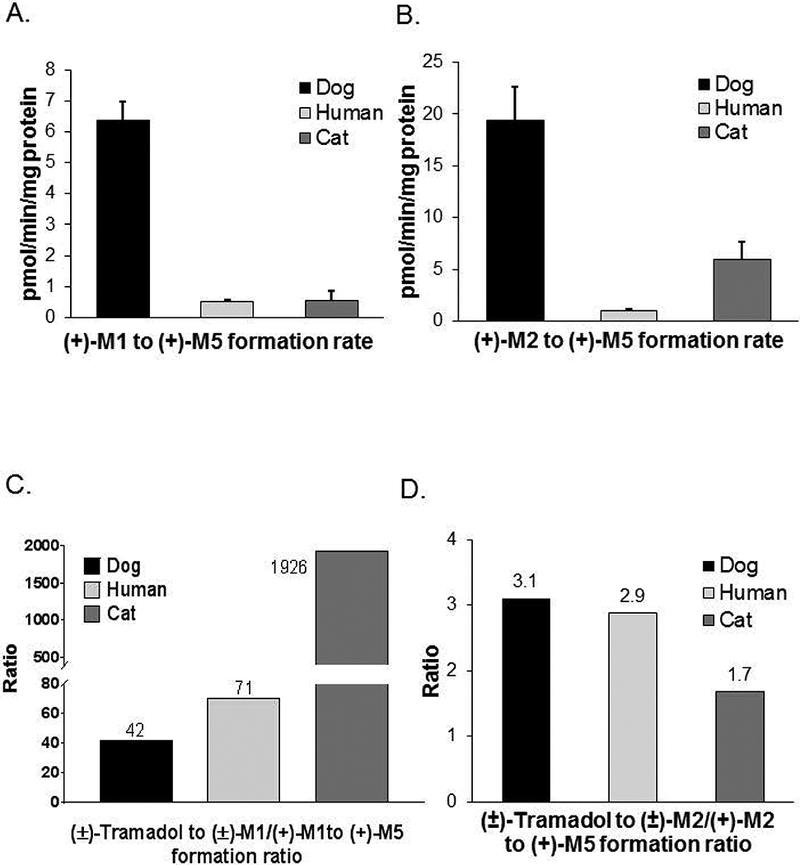
Species differences in the rates of (+)-M5 formation rates from (+)-M1 at 10 μM concentration (panel A) and from (+)-M2 at 0.5 μM concentration (panel B) by pooled dog (n = 59), human (n = 48), and cat (n = 16) liver microsomes. Bars represent the mean (± SD) of three independent determinations performed in triplicate. Also shown for each species are the ratios of the mean formation rate of (±)-M1 from (±)-tramadol (reported previously in Perez Jimenez, 2016) to the mean formation rate of (+)-M5 formation from (+)-M1 (panel C); as well as the ratios of the mean formation rate of (±)-M2 from (±)-tramadol (reported previously in Perez Jimenez, 2016) to the mean formation rate of (+)-M5 formation from (+)-M2 (panel D).
We then compared previously published results (Perez Jimenez, 2016) for formation rates of (±)-M1 and (±)-M2 from (±)-tramadol to the current results for the metabolism of (+)-M1 and (+)-M2 to (+)-M5 determined using the same pooled dog, human and cat liver microsomes. As shown in Fig. 1C, feline liver microsomes showed an M1 formation to metabolism ratio of 1926 that was much higher than ratios for DLMs (42) and human liver microsomes (71). On the other hand (Fig. 1D), feline liver microsomes showed an M2 formation to metabolism ratio of 1.7 that was slightly lower than ratios for DLMs (3.1) and human liver microsomes (2.9).
Enzyme kinetics of (+)-M5 formation rates from (+)-M1 and (+)-M2 in DLMs
Shown in Fig. 2 are Michaelis-Menten and Eadie-Hofstee plots (measured data and fitted curves) of (+)-M5 formation rate from (+)-M1 (Panels A and B) and (+)-M2 (Panels C and D) using pooled DLMs. Fitted kinetic parameters including Km and Vmax, and the calculated intrinsic clearance (Vmax/Km) for pooled DLMs and DLMs prepared individually from 3 different dogs are presented in Table 1. Eadie-Hofstee plots showed a monophasic tendency for the formation of (+)-M5 from both (+)-M1 and (+)-M2 in all DLMs. Intrinsic clearance estimates for the formation of (+)-M5 from (+)-M2 were consistently higher than from (+)-M1 for the pooled and individual DLMs by over 50 times. Much lower Km values were observed for (+)-M2 as substrate (0.38 to 0.56 μM) compared with (+)-M1 as substrate (64 to 158 μM).
Figure 2.

Michaelis-Menten enzyme kinetic plots of (+)-M5 formation rates from (+)-M1 (panel A) and (+)-M5 formation from (+)-M2 (panel C) by pooled (n = 59) dog liver microsomes. Also shown are Eadie-Hofstee plots of these same data (panels B and D, respectively). Each data point represents the mean of two independent determinations performed in duplicate, and the curves represent the model of best fit to the data.
Table 1.
Enzyme kinetic parameters determined by nonlinear regression for formation rate of (+)-M5 from (+)-M1 and (+)-M2 by liver microsomes pooled from 59 dogs (pDLMs) and liver microsomes prepared individually from three dogs (Dogs 10, 31, and 46). The data points used for fitting were the average of two independent experiments performed in duplicate (data points are shown in Figure 1 with the curves of best fit). Fitted parameters included Km and Vmax, while intrinsic clearance (Vmax/Km) values were calculated.
| Substrate | Liver ID | Kma | Vmaxb | Vmax/Kmc |
|---|---|---|---|---|
| (+) M1 | pDLM | 112 | 61 | 0.55 |
| Dog 10 | 158 | 63 | 0.40 | |
| Dog 31 | 64 | 67 | 1.05 | |
| Dog 46 | 108 | 94 | 0.88 | |
| (+) M2 | pDLM | 0.56 | 50 | 90 |
| Dog 10 | 0.46 | 27 | 59 | |
| Dog 31 | 0.39 | 23 | 58 | |
| Dog 46 | 0.38 | 39 | 102 |
μM
pmol/min/mg protein
mL/min/g protein
(+)-M5 formation rate from (+)-M1 and (+)-M2 by recombinant dog CYPs
(+)-M1 and (+)-M2 at 10 and 0.5 μM concentration were incubated with all commercially available dog recombinant CYPs to identify and compare CYPs capable of forming (+)-M5 from these substrates. These substrate concentrations were chosen because they approximated (or were below) the Km values for the reaction by DLMs to ensure that the enzymes were not saturated. As shown in Fig. 3A, formation rate of (+)-M5 from (+)-M1 was highest for CYP2C21 with somewhat lower activities for CYP2C41 and CYP2B11, while only very low activities were detected for the other CYPs tested including CYP3A12, CYP2D15, CYP1A1, CYP1A2, and CYP3A26. On the other hand, the formation rate of (+)-M5 from (+)-M2 was only detected for CYP2D15 as seen in Fig. 3B.
Figure 3.
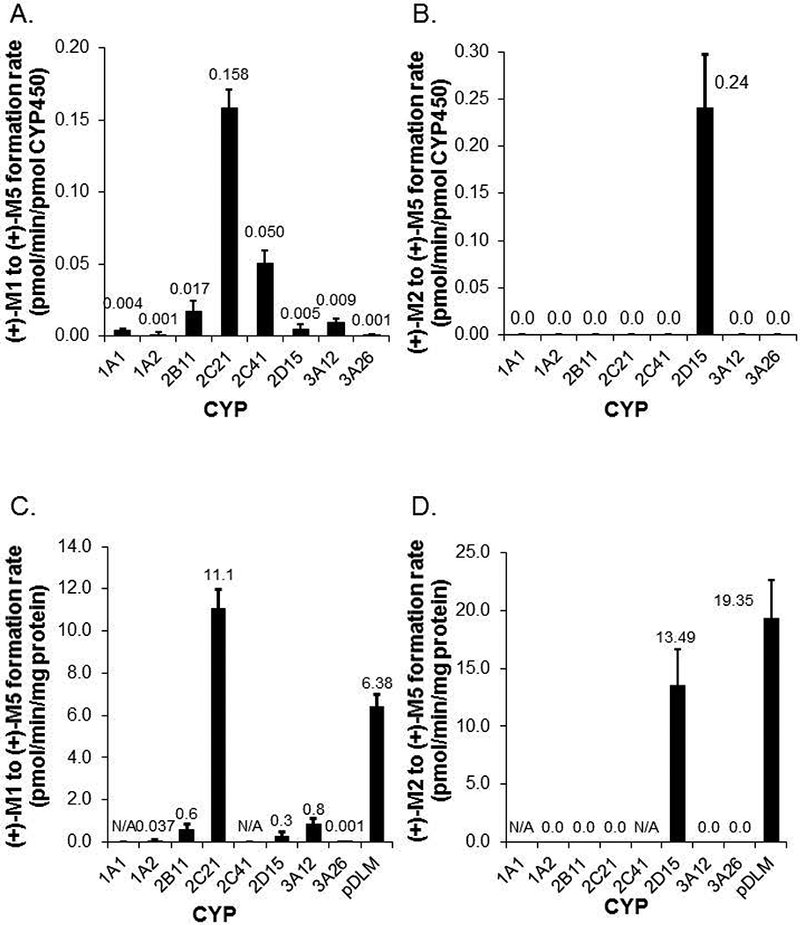
Formation rates of (+)-M5 from (+)-M1 (panel A) and (+)-M5 from (+)-M2 (panel B) by recombinant canine CYPs measured at 10 and 2 μM substrate concentration respectively. Also shown are formation rates of (+)-M5 from (+)-M1 (panel C) and (+)-M5 from (+)-M2 (panel D) corrected for typical canine liver microsome CYP isoform abundance as reported by Heikkinen (2015) except for CYP1A1 and CYP2C41 where abundance values are not currently available (N/A). Pooled dog liver microsome activities measured at the same substrate concentrations are also shown for comparison in panels C and D. Bars represent the mean (± SD) of three independent determinations performed in triplicate.
Since the abundance of different CYPs is known to differ within dog liver, these specific activities were also adjusted for reported typical abundance values (Heikkinen, 2015) for each CYP (except for CYP1A1 and CYP2C41 which were not available) and compared with pooled DLM activities measure at the same substrate concentration (Heikkinen, 2015). As shown in Fig. 3C, CYP2C21 was the predominant CYP mediating formation of (+)-M5 from (+)-M1 with similar activities to pooled DLMs. Liver abundance adjusted CYP2D15 activities were also similar to pooled DLMs for (+)-M5 formation from (+)-M2 (Fig. 3D).
Effect of CYP selective inhibitors on (+)-M5 formation rate from (+)-M1 and (+)-M2
The effects of CYP selective inhibitors on (+)-M5 formation rate from (+)-M1 and (+)-M2 were evaluated using pooled DLMs and recombinant enzymes. Inhibitors included quinidine at 10 μM as a CYP2D15 inhibitor (Roussel, 1998), chloramphenicol at 10 μM as a CYP2B11 inhibitor (Hay Kraus, 2000) and sulfaphenazole at 100 μM as a CYP2C inhibitor (Baldwin, 1995). As shown in Figs. 4A and 4B, sulfaphenazole inhibited (+)-M5 formation rate from (+)-M1 by >50% in both DLMs and CYP2C21, while chloramphenicol inhibited this reaction by >60% in DLMs but by <40% in CYP2C21. Quinidine did not inhibit (+)-M5 formation from (+)-M1 in DLMs or CYP2C21 at all. On the other hand (Figs. 4C and 4D), quinidine inhibited the formation of (+)-M5 from (+)-M2 by >70% in both DLMs and CYP2D15, while chloramphenicol showed <20% and sulfaphenazole showed <50% inhibition of this reaction in both DLMs and CYP2D15.
Figure 4.
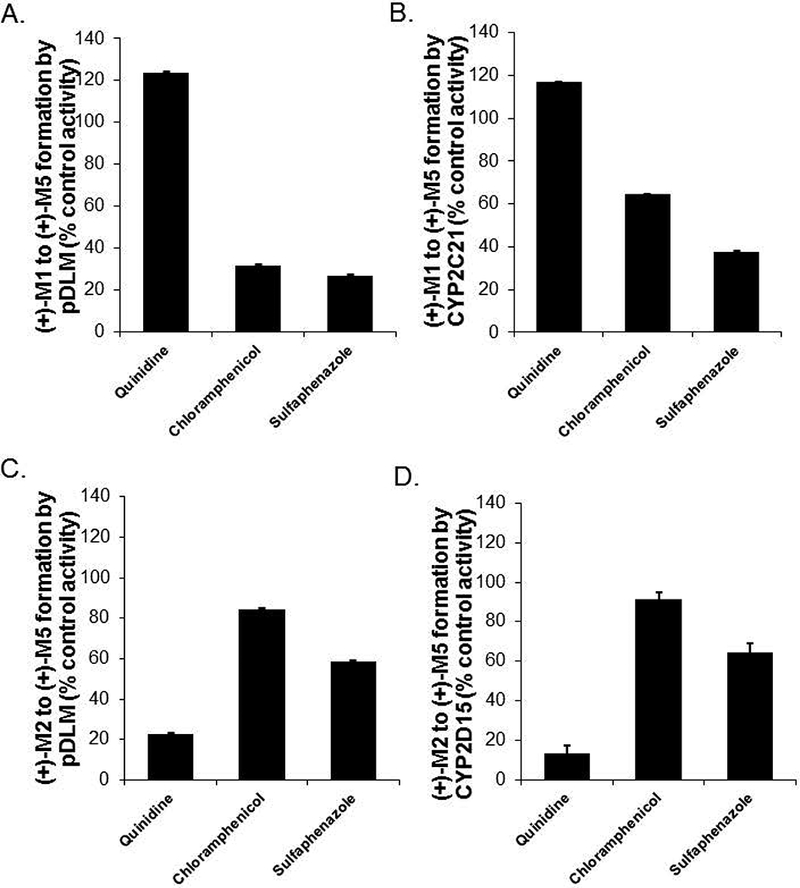
Selective inhibition of (+)-M5 formation rate from (+)-M1 (panel A) and from (+)-M2 (panel C) by quinidine, chloramphenicol and sulfaphenazole in pooled (n = 59) dog liver microsomes, and (+)-M5 formation from (+)-M1 (panel B) and from (+)-M2 (panel D) by quinidine, chloramphenicol and sulfaphenazole in CYP2D15 and CYP2C21 respectively. Shown are the metabolite formation rates in the presence of inhibitor (quinidine 10 μM, chloramphenicol 10 μM, sulfaphenazole 100 μM) expressed as a percentage of the formation rate without inhibitor (control activity). Bars represent the mean (± SD) of three independent determinations performed in triplicate.
Effect of CYP selective inducers on (+)-M5 formation rate from (+)-M1 and (+)-M2
The effects of selective inducers including β-naphthoflavone (CYP1A), phenobarbital (CYP2B and CYP2C), rifampin (CYP3A), and clofibric acid (CYP4A) on the formation of (+)-M5 from (+)-M1 and (+)-M2 were evaluated using pooled liver microsomes from male Beagle dogs (2 per treatment) that had been treated with each of these inducers. Results were compared to vehicle treated liver microsomes. Vehicles included corn oil for rifampin and ß-naphthoflavone, and saline for phenobarbital and clofibric acid. As shown in Fig. 5A, the formation of (+)-M5 from (+)-M1 was substantially increased by phenobarbital with mean ± SD activity that was 27 ± 0.1 times the control activity. Other inducers tested had less than 1.5-fold average difference compared with control for (+)-M5 formation from (+)-M1. On the other hand, the formation of (+)-M5 from (+)-M2 (Fig. 5B) was not substantially affected by any of the inducers tested, with less than 2.5-fold average difference from the activities of the respective vehicle controls.
Figure 5.
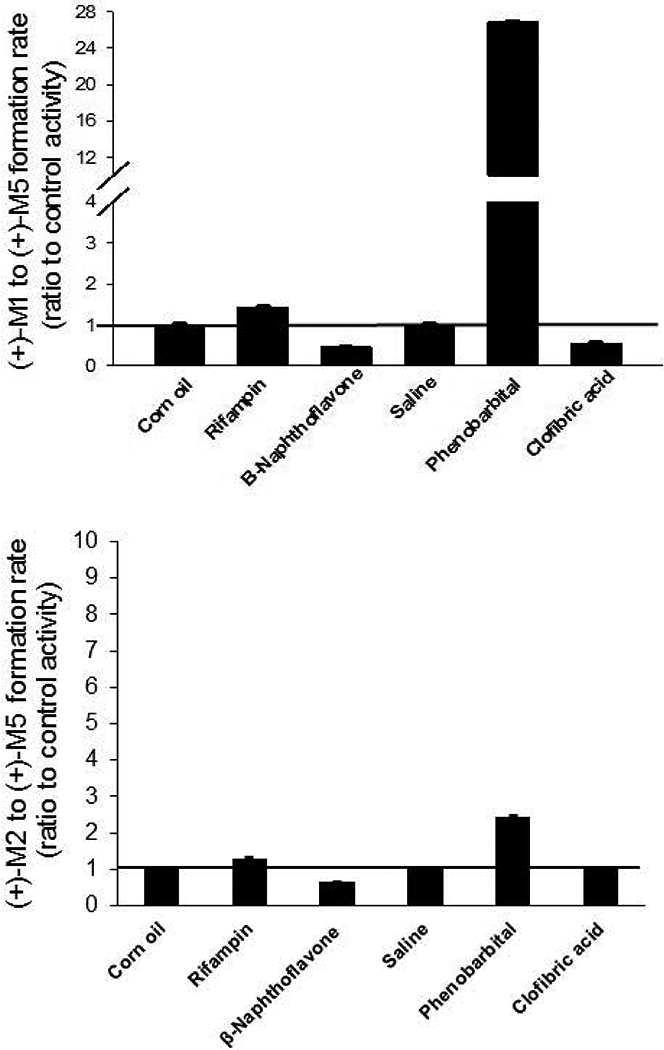
Effect of CYP inducers on the rate of (+)-M5 formation rate from (+)-M1 (panel A) and (+)-M5 formation rate from (+)-M2 (panel B) in pooled liver microsomes from dogs treated with rifampin, ß-naphthoflavone, phenobarbital and clofibric acid. Shown are metabolite formation rates measured using microsomes prepared from inducer treated male Beagle dogs (pooled from 2 dogs per treatment) expressed as a ratio of the formation rates measured in microsomes from the respective vehicle treated dogs (control activity). Vehicles were corn oil for rifampin and ß-naphthoflavone and saline for phenobarbital and clofibric acid. Bars represent the mean (± SD) of three independent determinations performed in triplicate.
(+)-M1, (+)-M2, (+)-M5 and (+)-tramadol as canine P-glycoprotein substrates
The mean fluorescence intensity ratios (experimental drug + 1 μM rhodamine treated cells: 1 μM rhodamine only treated cells) were 10.3 for loperamide (1 μM; positive control) and 1.1 for carboplatin (1 μM; negative control). The mean fluorescence intensity ratios for (+)-M1, (+)-M2, (+)-M5, each at 1 μM concentration, and for (+)-tramadol at 0.5 to 50 μM concentration, ranged from 1.1 to 1.3.
DISCUSSION
The results of this study substantially enhance our understanding of the complex pathways involved in tramadol metabolism in dogs (Fig. 6). Based on recombinant enzyme data adjusted for hepatic abundance, we determined that (+)-M1 is metabolized in dog liver to (+)-M5 primarily by CYP2C21 with much smaller contributions from CYP2C41 and CYP2B11. This evidence was supported by showing inhibition of DLM activity by sulfaphenazole (CYP2C inhibitor) and chloramphenicol (CYP2B inhibitor) and induction by pre-treatment of dogs with phenobarbital (CYP2B and CYP2C inducer) but not with other inducers. Conversely, (+)-M2 metabolism to (+)-M5 is catalysed solely by CYP2D15 recombinant enzyme, and this result was supported by showing selective inhibition of this activity in DLMs by quinidine. None of the inducers tested substantially affected (+)-M5 formation rate from (+)-M2. This is consistent with our previous work that showed no induction with the same inducers of (+)-M1 formation rate from (+)-tramadol, which is also selectively mediated by CYP2D15 (Perez Jimenez, 2016). CYP2D enzymes (in dogs or other species) are generally considered to be unaffected by typical CYP inducers (Benedetti, 2000; Martignoni, 2006; Parkinson, 2004; Pelkonen, 1998).
Figure 6.
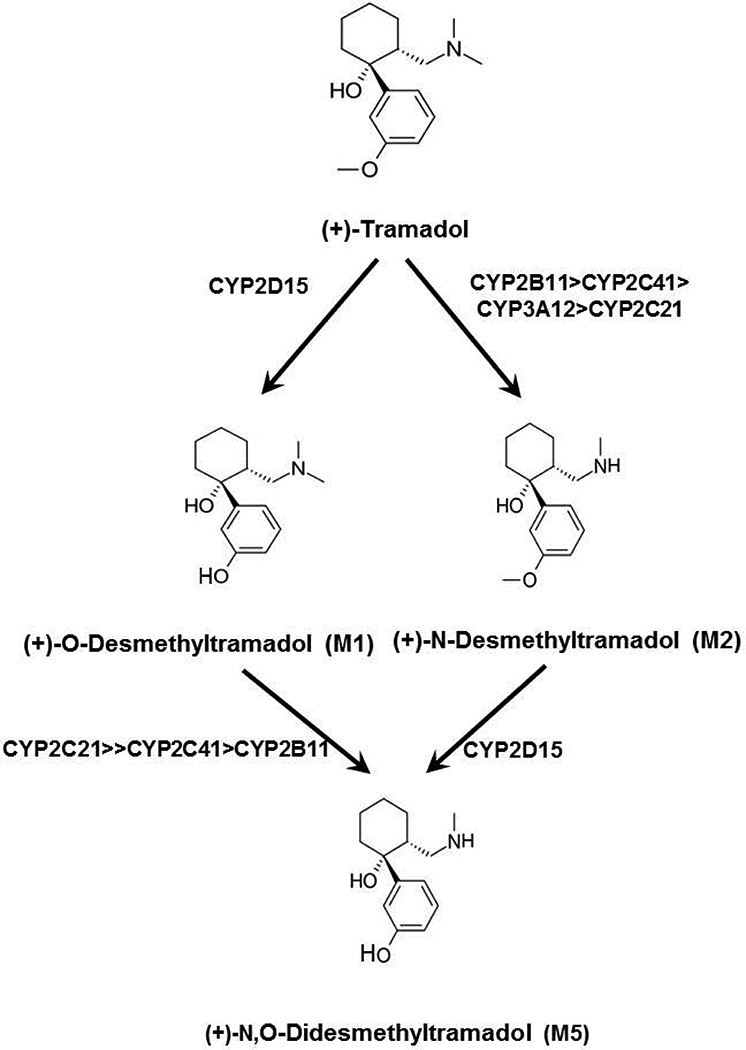
Primary and secondary CYP-dependent pathways of (+)-tramadol metabolism that have been phenotyped in dog liver. A previous study (Perez-Jimenez et al, 2016) showed that (+)-tramadol is O-demethylated to (+)-M1 exclusively by CYP2D15, while (+)-tramadol is N-demethylated to (+)-M2 primarily by CYP2B11 with lesser contributions from CYP2C41, CYP3A12 and CYP2C21. The results of this study indicate that (+)-M1 is further N-demethylated to (+)-M5 primarily by CYP2C21 with lesser contributions from CYP2C41 and CYP2B11, while (+)-M2 is O-demethylated to (+)-M5 exclusively by CYP2D15.
Similar to the results of our previous study that showed involvement of both CYP2C21 and CYP2C41 in (±)-M2 formation rate from (±)-tramadol, we also showed that both enzymes could also metabolize (+)-M1 to (+)-M5. Overlap of substrate preference between CYP2C21 and CYP2C41 is not surprising given the high sequence similarity (70% amino acid identity) between these two enzymes (Blaisdell, 1998). CYP2C41 is of interest since it is affected by a gene deletion polymorphism (Blaisdell, 1998). The prevalence of this gene among dogs does not appear to be high at least based on available published data, which showed that only 4 out of 25 (16%) research Beagle dogs tested had the gene (Blaisdell, 1998). It is also unclear at present how much CYP2C41 enzyme is expressed in the livers of dogs that possess the CYP2C41 gene relative to the enzyme content of CYP2C21 and other CYPs. The importance of CYP2C41 for (+)-M1 oxidation could be evaluated by comparing (+)-M5 formation from (+)-M1 in livers from dogs that express the CYP2C41 gene with those that lack the gene.
Previous studies in rats indicated that M5 has lower brain permeability than tramadol or the other major metabolites (Sheikholeslami, 2016). One possible cause of poor brain penetration is significant efflux by the P-glycoprotein transporter located at the blood-brain barrier. Transwell experiments using human intestinal Caco-2 cell line monolayers previously demonstrated that both tramadol and M1 were not substrates of human P-glycoprotein (Kanaan, 2009). However, it is currently unknown whether M2 and M5 are P-glycoprotein substrates. In this study, we used a validated canine P-glycoprotein efflux competition assay (Mealey, 2017) and so the results should be of direct relevance to the pharmacokinetics of tramadol and metabolites in dogs. The results showed fluorescence intensity ratios for (+)-tramadol, (+)-M1, (+)-M2, and (+)-M5 that were indistinguishable from the negative control and much lower than the positive control indicating that these compounds are not substrates for canine P-glycoprotein. Consequently, the poor brain penetration of M5 compared with tramadol and M1 may be a consequence of the higher polarity of this metabolite rather than efflux by P-glycoprotein from the CNS. Alternatively, M5 might be a substrate for a different efflux transporter such as BCRP. There is also some evidence that tramadol and M1 may be substrates for brain uptake transporters (Kanaan, 2009; Kitamura, 2014), and so a lack of uptake transport of M5 might explain the observed differential blood-brain barrier permeability of these compounds.
Our results showed that (+)-M5 is formed from (+)-M1 and (+)-M2 more rapidly in dog livers compared with human and cat livers (Fig. 1A and 1B.). This difference could contribute to the higher proportion of M5 and M5 conjugates as a percentage of total metabolites found in dog urine (43%) compared with human urine (12 – 28%) (Lintz, 1981). Although relatively high M1 plasma concentrations (similar to tramadol concentrations) have been reported after intravenous tramadol administration to cats (Pypendop, 2009; Cagnardi, 2011), the presence or concentrations of other metabolites have not yet been reported.
Using our previously published data, we also compared the ratios of formation of M1 (and M2) from tramadol to the oxidation of M1 (and M2) to M5 (respectively) between species. Although M1 and M2 formation/oxidation ratios were mostly similar between species, the formation of M1 from tramadol relative to the oxidation of M1 to M5 was much higher for cat liver compared with human and dog liver microsomes (Fig. 1C). This difference may contribute to the relatively high circulating M1 concentrations reported in cats (Pypendop, 2009; Cagnardi, 2011). It is also possible that higher M1 concentrations may result from slower conjugation of M1 in cats compared with other species, given the known propensity of cats to glucuronidate many drugs relatively slowly (Court, 2000). However, additional studies are needed to confirm this hypothesis.
A recent study failed to detect M5 in dog plasma after intravenous M1 administration (KuKanich, 2017), which might indicate that M1 conjugation is a more important clearance mechanism in dogs compared with M1 oxidation to M5. While this may be true, M5 is also extensively conjugated in dogs (Giorgi, 2009; Lintz, 1981), and since plasma samples in that study were not deconjugated before analysis conjugated M5 would not have been detected.
Although this study was limited to liver and recombinant enzymes, some CYPs occur in substantial amounts in the small intestinal mucosa and can contribute to first pass metabolism after oral drug administration. A previous study (Heikkinen, 2015) showed that CYP3A12 and CYP2B11 proteins are highly expressed in canine intestinal mucosa, while CYP2C21 and CYP2D15 were not detected. Based on the results of our previous work (Perez Jimenez, 2016) and the current study we would predict that dog intestinal mucosa could form M2 but not M1 from tramadol. However, there would not be further metabolism of M2 to M5, at least until M2 reaches the liver.
Oral co-administration of tramadol with CYP inhibitors could potentially increase bioavailability by reducing first-pass metabolism, and selectively decrease formation of certain metabolites. Kukanich et al (2017) showed increased oral bioavailability of tramadol when co-administered with the CYP3A inhibitors ketoconazole and cimetidine. This is consistent with the known role of CYP3A12 in metabolism of tramadol to M2 (Perez Jimenez, 2016) and the high expression of CYP3A12 in intestinal mucosa and liver (Heikkinen, 2015). They also observed slight increases in M1 and M2 concentrations in plasma, which probably resulted from the overall increase in tramadol systemic availability. Interestingly, although M5 concentrations were increased with cimetidine, M5 concentrations were substantially decreased with ketoconazole suggesting inhibition of M5 formation by CYP2D15. This is supported by a previous study that showed relatively potent inhibition (IC50 = 0.47 μM) of CYP2D15 mediated dextromethorphan o-demethylation in DLMs (Aidasani, 2008).
The results of the present study predict that oral co-administration of tramadol with a CYP2B11 and CYP2C21 inhibitor would enhance systemic availability by reducing M2 formation from tramadol and increase plasma M1 concentrations by inhibiting M5 formation from M1. Conversely, induction of these enzymes such as by co-treatment with phenobarbital would reduce tramadol systemic availability and limit plasma M1 concentrations. However, it should be noted that M1 conjugation by sulfation and glucuronidation may be an important determinant of M1 concentrations in the dog and so future in vitro and in vivo work is needed to understand the impact of inhibitors, inducers, and genetic polymorphisms on these pathways.
A limitation of the present study is that we did not evaluate the metabolism of (−)-stereoisomers which would be generated with clinical use of racemic (±)-tramadol. In our previous study of N- and O-demethylation of (+)-tramadol, (−)-tramadol and (±)-tramadol (Perez Jimenez, 2016), we only found small quantitative differences between stereoisomers without significant differences in CYP selectivity. Consequently, we speculate that our results with the (+)-steroisomers would be generalizable to the (−)-steroisomers, but this needs to be experimentally confirmed.
In summary, we have determined that (+)-M5 is formed from (+)-M2 by CYP2C21 and from (+)-M1 by CYP2D15 in DLMs. The results of this study have enabled a more complete picture of the major CYP-dependent pathways involved in tramadol metabolism in dog liver.
ACKNOWLEDGEMENTS
Dr. Perez was supported in these studies by a Morris Animal Foundation Fellowship Training Grant [D16CA-401]. Dr. Court was supported by the US National Institutes of Health grant [GM102130] and the William R. Jones endowment to Washington State University College of Veterinary Medicine.
Footnotes
CONFLICT OF INTEREST: All authors have no conflict of interest to report.
REFERENCES
- Aidasani D, Zaya MJ, Malpas PB, & Locuson CW (2008). In vitro drug-drug interaction screens for canine veterinary medicines: evaluation of cytochrome P450 reversible inhibition. Drug Metab Dispos, 36(8), 1512–1518. doi: 10.1124/dmd.108.021196. [DOI] [PubMed] [Google Scholar]
- Ardakani YH, & Rouini MR (2007). Pharmacokinetics of tramadol and its three main metabolites in healthy male and female volunteers. Biopharm Drug Dispos, 28(9), 527–534. [DOI] [PubMed] [Google Scholar]
- Baldwin SJ, Bloomer JC, Smith GJ, Ayrton AD, Clarke SE, & Chenery RJ (1995). Ketoconazole and sulphaphenazole as the respective selective inhibitors of P4503A and 2C9. Xenobiotica, 25(3), 261–270. [DOI] [PubMed] [Google Scholar]
- Benedetti MS (2000). Enzyme induction and inhibition by new antiepileptic drugs: a review of human studies. Fundam Clin Pharmacol, 14(4), 301–319. [DOI] [PubMed] [Google Scholar]
- Blaisdell J, Goldstein JA, & Bai SA (1998). Isolation of a new canine cytochrome P450 cDNA from the cytochrome P450 2C subfamily (CYP2C41) and evidence for polymorphic differences in its expression. Drug Metab Dispos, 26(3), 278–283. [PubMed] [Google Scholar]
- Cagnardi P, Villa R, Zonca A, Gallo M, Beccaglia M, Luvoni GC, … Ravasio G. (2011). Pharmacokinetics, intraoperative effect and postoperative analgesia of tramadol in cats. Res Vet Sci, 90(3), 503–509. [DOI] [PubMed] [Google Scholar]
- Cardozo L, Cotes L, Kahvegian M, Rizzo MF, Otsuki DA, Ferrigno C, Fantoni D (2014). Evaluation of the effects of methadone and tramadol on postoperative analgesia and serum interleukin-6 in dogs undergoing orthopaedic surgery. BMC Veterinary Research, 10(194), 1–7. [DOI] [PMC free article] [PubMed] [Google Scholar]
- Court MH, Von Moltke LL, Shader RI, & Greenblatt DJ (1997). Biotransformation of chlorzoxazone by hepatic microsomes from humans and ten other mammalian species. Biopharm Drug Dispos, 18(3), 213–226. [DOI] [PubMed] [Google Scholar]
- Court MH, & Greenblatt DJ (2000). Molecular genetic basis for deficient acetaminophen glucuronidation by cats: UGT1A6 is a pseudogene, and evidence for reduced diversity of expressed hepatic UGT1A isoforms. Pharmacogenetics, 10(4), 355–369. doi: 10.1097/00008571-200006000-00009 [DOI] [PubMed] [Google Scholar]
- Delgado C, Bentley E, Hetzel S, & Smith LJ (2014). Comparison of carprofen and tramadol for postoperative analgesia in dogs undergoing enucleation. J Am Vet Med Assoc, 245(12), 1375–1381. [DOI] [PMC free article] [PubMed] [Google Scholar]
- Garcia Quetglas E, Azanza JR, Cardenas E, Sadaba B, & Campanero MA (2007). Stereoselective pharmacokinetic analysis of tramadol and its main phase I metabolites in healthy subjects after intravenous and oral administration of racemic tramadol. Biopharm Drug Dispos, 28(1), 19–33. [DOI] [PubMed] [Google Scholar]
- Gillen C, Haurand M, Kobelt DJ, & Wnendt S (2000). Affinity, potency and efficacy of tramadol and its metabolites at the cloned human μ-opioid receptor. Naunyn-Schmiedeberg’s Archives of Pharmacology, 362(2), 116–121. [DOI] [PubMed] [Google Scholar]
- Giorgi M, Del Carlo S, Saccomanni G, Lebkowska-Wieruszewska B, & Kowalski CJ (2009). Pharmacokinetic and urine profile of tramadol and its major metabolites following oral immediate release capsules administration in dogs. Vet Res Commun, 33(8), 875–885. [DOI] [PubMed] [Google Scholar]
- Giorgi M, Saccomanni G, Lebkowska-Wieruszewska B, & Kowalski C (2009). Pharmacokinetic evaluation of tramadol and its major metabolites after single oral sustained tablet administration in the dog: a pilot study. Vet J, 180(2), 253–255. [DOI] [PubMed] [Google Scholar]
- Grond S, Meuser T, Uragg H, Stahlberg HJ, & Lehmann KA (1999). Serum concentrations of tramadol enantiomers during patient-controlled analgesia. Br J Clin Pharmacol, 48(2), 254–257 [DOI] [PMC free article] [PubMed] [Google Scholar]
- Hay Kraus BLG, Greenblatt DJ, Venkatakrishnan K, Court MH (2000). Evidence for propofol hydroxylation by CYP450 2B11 in canine liver microsomes: breed and gender differences. Xenobiotica, 30(6), 575–588. [DOI] [PubMed] [Google Scholar]
- Heikkinen AT LF, Cutler P, Parrott N. (2015). The role of quantitative ADME proteomics to support construction of physiologically based pharmacokinetic models for use in small molecule drug development. Proteomics Clin Appl. doi: 10.1002/prca.201400147 [DOI] [PubMed] [Google Scholar]
- Itami T, Kawase K, Tamaru N, Ishizuka T, Tamura J, Miyoshi K, Yamashita K (2013). Effects of a single bolus intravenous dose of tramadol on minimum alveolar concentration (MAC) of sevoflurane in dogs. Journal of Veterinary Medical Science, 75(5), 613–618. [DOI] [PubMed] [Google Scholar]
- Kanaan M, Daali Y, Dayer P, & Desmeules J (2009). Uptake/efflux transport of tramadol enantiomers and O-desmethyl-tramadol: focus on P-glycoprotein. Basic Clin Pharmacol Toxicol, 105(3), 199–206. doi: 10.1111/j.1742-7843.2009.00428.x [DOI] [PMC free article] [PubMed] [Google Scholar]
- Kitamura A, Higuchi K, Okura T, & Deguchi Y (2014). Transport characteristics of tramadol in the blood-brain barrier. J Pharm Sci, 103(10), 3335–3341. doi: 10.1002/jps.24129 [DOI] [PubMed] [Google Scholar]
- Kogel B, Terlinden R, & Schneider J (2014). Characterisation of tramadol, morphine and tapentadol in an acute pain model in Beagle dogs. Vet Anaesth Analg, 41(3), 297–304. [DOI] [PubMed] [Google Scholar]
- Kongara K, Chambers JP, Johnson CB, & Dukkipati VS (2013). Effects of tramadol or morphine in dogs undergoing castration on intra-operative electroencephalogram responses and post-operative pain. N Z Vet J, 61(6), 349–353. doi: 10.1080/00480169.2013.780280 [DOI] [PubMed] [Google Scholar]
- Kukanich B, & Papich MG (2011). Pharmacokinetics and antinociceptive effects of oral tramadol hydrochloride administration in Greyhounds. Am J Vet Res, 72(2), 256–262. doi: 10.2460/ajvr.72.2.256 [DOI] [PubMed] [Google Scholar]
- KuKanich B, KuKanich K, & Black J (2017). The effects of ketoconazole and cimetidine on the pharmacokinetics of oral tramadol in greyhound dogs. Journal of Veterinary Pharmacology and Therapeutics, 40(6), e54–e61. doi: 10.1111/jvp.12424. [DOI] [PubMed] [Google Scholar]
- Lintz W, Erlaçin S, Frankus E, & Uragg H (1981). Biotransformation of tramadol in man and animal. Arzneimittelforschung, 31(11), 1932–1943. [PubMed] [Google Scholar]
- Martignoni M, Groothuis GMM, & de Kanter R (2006). Species differences between mouse, rat, dog, monkey and human CYP-mediated drug metabolism, inhibition and induction. Expert Opinion on Drug Metabolism & Toxicology, 2(6), 875–894. doi: 10.1517/17425255.2.6.875 [DOI] [PubMed] [Google Scholar]
- Mealey KL, Dassanayake S, & Burke NS (2017). Establishment of a cell line for assessing drugs as canine P-glycoprotein substrates: proof of principle. J Vet Pharmacol Ther, 40(5), 545–551. doi: 10.1111/jvp.12390 [DOI] [PubMed] [Google Scholar]
- Parkinson A, Mudra DR, Johnson C, Dwyer A, & Carroll KM (2004). The effects of gender, age, ethnicity, and liver cirrhosis on cytochrome P450 enzyme activity in human liver microsomes and inducibility in cultured human hepatocytes. Toxicol Appl Pharmacol, 199(3), 193–209. doi: 10.1016/j.taap.2004.01.010 [DOI] [PubMed] [Google Scholar]
- Pelkonen O, Maenpaa J, Taavitsainen P, Rautio A, & Raunio H (1998). Inhibition and induction of human cytochrome P450 (CYP) enzymes. Xenobiotica, 28(12), 1203–1253. doi: 10.1080/004982598238886 [DOI] [PubMed] [Google Scholar]
- Perez Jimenez TE, Mealey KL, Grubb TL, Greene SA, & Court MH (2016). Tramadol metabolism to O-desmethyl tramadol (M1) and N-desmethyl tramadol (M2) by dog liver microsomes: Species comparison and identification of responsible canine cytochrome P-450s (CYPs). Drug Metab Dispos. doi: 10.1124/dmd.116.071902 [DOI] [PMC free article] [PubMed] [Google Scholar]
- Pypendop BH, & Ilkiw JE (2008). Pharmacokinetics of tramadol, and its metabolite O-desmethyl-tramadol, in cats. J Vet Pharmacol Ther, 31(1), 52–59. doi: 10.1111/j.1365-2885.2007.00921.x [DOI] [PubMed] [Google Scholar]
- Pypendop BH, Siao KT, & Ilkiw JE (2009). Effects of tramadol hydrochloride on the thermal threshold in cats. Am J Vet Res, 70(12), 1465–1470. doi: 10.2460/ajvr.70.12.1465 [DOI] [PubMed] [Google Scholar]
- Raffa RB, Friderichs E, Reimann W, Shank RP, Codd EE, Vaught JL (1992). Opioid and Nonopioid Components Independently Contribute to the Mechanism of Action of Tramadol, an ‘Atypical’ Opioid Analgesic. J pharmacol Exp Ther, 260(1). [PubMed] [Google Scholar]
- Roussel F, Duignan DB, Lawton MP, Obach RS, Strick CA, & Tweedie DJ (1998). Expression and characterization of canine cytochrome P450 2D15. Arch Biochem Biophys, 357(1), 27–36. doi: 10.1006/abbi.1998.0801 [DOI] [PubMed] [Google Scholar]
- Scott LJ, & Perry CM (2000). Tramadol: a review of its use in perioperative pain. Drugs, 60(1), 139–176. [DOI] [PubMed] [Google Scholar]
- Sheikholeslami B, Gholami M, Lavasani H, & Rouini M (2016). Evaluation of the route dependency of the pharmacokinetics and neuro-pharmacokinetics of tramadol and its main metabolites in rats. Eur J Pharm Sci, 92, 55–63. doi: 10.1016/j.ejps.2016.06.021 [DOI] [PubMed] [Google Scholar]