

Abstract
Background:
There is evidence that low-level alcohol use, drinking 1–2 drinks on occasion, is protective for cardiovascular disease, but increases the risk of cancer. Synthesizing the overall impact of low-level alcohol use on health is therefore complex. The objective of this paper is to examine the association between frequency of low-level drinking and mortality.
Methods:
Two datasets with self-reported alcohol use and mortality follow-up were analyzed: N=340,668 individuals from the National Health Interview Survey (NHIS); and N=93,653 individuals from the Veterans Health Administration (VA) outpatient medical records. Survival analyses were conducted to evaluate the association between low-level drinking frequency and mortality.
Results:
The minimum risk drinking frequency among those who drink 1–2 drinks per occasion was found to be 3.2 times weekly in the NHIS data, based on a continuous measure of drinking frequency, and 2–3 times weekly in the VA data. Relative to these individuals with minimum risk, individuals who drink 7 times weekly had an adjusted hazard ratio (HR) of all-cause mortality of 1.23 (p<0.0001) in the NHIS data, and individuals who drink 4–7 times weekly in the VA data also had an adjusted HR of 1.23 (p=0.01). Secondary analyses in the NHIS data showed that the minimum risk was drinking 4 times weekly for cardiovascular mortality, and drinking monthly or less for cancer mortality. The associations were consistent in stratified analyses of men, women, and never-smokers.
Conclusion:
The minimum risk of low-level drinking frequency for all-cause mortality appears to be approximately 3 occasions weekly. The robustness of this finding is highlighted in two distinctly different datasets: a large epidemiological dataset, and a dataset of veterans sampled from an outpatient clinic. Daily drinking, even at low-levels, is detrimental to one’s health.
Keywords: alcohol use, mortality, cancer mortality, cardiovascular mortality
Introduction
Excessive alcohol use accounts for 9.8% of deaths among working-age adults in the United States and continues to be a leading cause of premature mortality (Stahre, Roeber, Kanny et al. 2014). The threshold for safe levels of alcohol use has been discussed since the mid-19th century (Anstie 1870). Currently, the National Institute of Alcohol Abuse and Alcoholism (NIAAA) and the Centers for Disease Control (CDC) set the threshold at up to one drink daily for women and up to two drinks daily for men as within the U.S. Dietary guidelines (Division of Population Health ; U.S. Department of Health and Human Services and U.S. Department of Agriculture 2015; National Institute on Alcohol Abuse and Alcoholism 2016). Because of the complexity of drinking behavior itself, defining these guidelines is difficult, and therefore these recommendations have evolved over time (Stockwell and Room 2012). Research on multiple components of drinking behavior, including number of drinking days per week, average drinks per day, and binge drinking, has informed the development of these recommendations.
There is an expansive body of literature on the relationship between alcohol use and health. Investigators have examined the impact of alcohol use on health conditions such as bodyweight, blood pressure, and stroke, as well as diseases including diabetes and multiple types of cancer (Foster and Marriott 2006). The association between alcohol use and cardiovascular health has been researched extensively, with many studies finding evidence of a J-shaped curve (Costanzo, Di Castelnuovo, Donati et al. 2010): low-level drinkers, defined as drinking 1–2 drinks per day, have a reduced risk for cardiovascular mortality compared to either abstainers or heavier drinkers.
A prospective study conducted by Mukamal and colleagues (2003) examined alcohol consumption and the risk of myocardial infarction among men over a 12-year period in the Health Professionals Follow-up Study. Both quantity and frequency of drinking were analyzed, along with type of alcohol consumed and changes in consumption over time. Alcohol consumption was associated with decreased risk of myocardial infarction, regardless of alcohol type, and those who reported drinking 3–4 days per week or 5–7 days per week had decreased risk compared to those who drank less than once a week. Several other studies investigating alcohol use and cardiovascular health outcomes have also reported a protective effect for low-level drinking as measured by quantity and frequency in both men and women (Britton and Marmot 2004; Mukamal, Jensen, Grønbæk et al. 2005; Tolstrup, Jensen, Tjonneland et al. 2006; Mukamal, Chen, Rao et al. 2010), and this protective effect has been corroborated by meta-analyses (Costanzo, Di Castelnuovo, Donati et al. 2010; Ronksley, Brien, Turner et al. 2011; Larsson, Orsini and Wolk 2015; Mostofsky, Mukamal, Giovannucci et al. 2016).
More recently, however, several studies have challenged the benefits of alcohol for cardiovascular health. A prospective study of nearly 600,000 drinkers showed that for cardiovascular disease subtypes other than myocardial infarction, lower alcohol consumption was associated with lower risk of disease (Wood, Kaptoge, Butterworth et al. 2018). Analysis of individuals from this cohort without baseline cardiovascular disease found that alcohol intake was associated with increased risk of non-fatal coronary heart disease, but associated with decreased risk of stroke (Ricci, Wood, Muller et al. 2018). In a Mendelian randomization study by Holmes et al. (2014), individuals with decreased genetic risk for consuming alcohol and alcohol use disorder, based on the presence of a genetic variant that alters alcohol metabolism, were compared to individuals with typical genetic risk. The authors found that individuals with the genetic variant associated with non-drinking and lower alcohol consumption had a more favorable cardiovascular profile and reduced risk of coronary heart disease than those without the genetic variant. This finding supports the beneficial effect of reduced alcohol consumption for cardiovascular health.
In contrast to the inconsistent findings regarding alcohol use and cardiovascular health, there is a consensus that alcohol use is associated with increased cancer incidence (Trichopoulou, Bamia, Lagiou et al. 2010; Chen, Rosner, Hankinson et al. 2011; Cao, Willett, Rimm et al. 2015; World Cancer Research Fund and American Institute for Cancer Research 2018). Because of the strong association between cigarette smoking and cancer, and the confounding between smoking and alcohol use, teasing apart the relationship between low-level alcohol use and cancer has been particularly difficult. A recent study of two large U.S. cohorts found an association between low-level drinking (1–2 drinks/day) with minimally increased risk of any type of cancer (excluding non-advanced prostate cancer) in both men and women, regardless of smoking history (Cao, Willett, Rimm et al. 2015).
Investigators have also extended the examination of the association between alcohol use and all-cause mortality. Historically, studies of all-cause mortality have replicated the J shaped curve evident with cardiovascular outcomes (Di Castelnuovo, Costanzo, Bagnardi et al. 2006; Klatsky and Udaltsova 2007; Costanzo, Di Castelnuovo, Donati et al. 2010; Ronksley, Brien, Turner et al. 2011; Xi, Veeranki, Zhao et al. 2017), but recent studies using updated methodologies and data have found no evidence for a protective effect of low-level drinking on all-cause mortality (Goulden 2016; Stockwell, Zhao, Panwar et al. 2016; GBD 2016 Alcohol Collaborators 2018; Wood, Kaptoge, Butterworth et al. 2018).
To further complicate matters, gender and race differences have also been reported. Sempos et al. (2003) analyzed a sample of African Americans who were followed for 19 years as part of the National Health and Nutritional Examination Survey Epidemiologic Follow-Up Study and found no protective effect for low-level drinking on all-cause mortality. Likewise, Kerr and colleagues (2011) found no protective effect of low-level drinking on all-cause mortality for African Americans when analyzing data from the National Alcohol Surveys, but a protective effect was found for Whites in the same sample. With respect to gender, Klatsky and Udaltsova (2007) reported that the protective effect of low-level drinking on all-cause mortality was stronger in women compared to men, whereas a recent meta-analysis found no protective effect at all of low-level drinking for women (Zheng, Lian, Shi et al. 2015).
In synthesizing these studies, it has been argued that protective effects of alcohol on health have been overestimated and that the association, instead of being causal, is due to the methodological limitations of observational studies. Chikritzhs and colleagues (2015) contend that no protective effects should be assumed in future estimates of alcohol-related burden of disease or in national drinking guidelines. Several areas of potential bias have been identified that could lead to spurious associations, including misclassifying former drinkers as abstainers, residual or unmeasured confounding, and selection biases (Naimi, Brown, Brewer et al. 2005; Fillmore, Stockwell, Chikritzhs et al. 2007; Chikritzhs, Fillmore and Stockwell 2009; Klatsky and Udaltsova 2013; Goulden 2016; Naimi, Stockwell, Zhao et al. 2017). Whether moderate alcohol consumption confers health benefits to current drinkers continues to be a topic of strong debate in the scientific literature (Chikritzhs, Stockwell, Naimi et al. 2015; Mukamal, Clowry, Murray et al. 2016; Britton and Bell 2017; Naimi, Stockwell, Saitz et al. 2017; Rabin 2018).
With the advent of large-scale databases, a more thorough examination of alcohol consumption and mortality can be conducted. This current study analyzes the association between alcohol use patterns (quantity and frequency) and risk for mortality by using two large datasets to determine the nadir of risk: the quantity and frequency of alcohol use associated with the lowest mortality and to identify where risk begins to increase.
Materials and Methods
Two large datasets were used in this study: the National Health Interview Survey (NHIS), and outpatient medical records from Veterans Health Administration clinics (VA). Because the structure of the two datasets differs, the data and analysis are described individually for each dataset.
NHIS
Data:
The National Health Interview Survey (NHIS) is an ongoing annual survey, representative of the civilian, noninstitutionalized, household population of the United States (Minnesota Population Center and State Health Access Data Assistance Center 2016). Data from the 1997 to 2009 administrations of the NHIS were merged to examine the relationship of drinking pattern variables with mortality data (https://ihis.ipums.org/ihis/). NHIS data were collected via computer assisted personal interviews administered by interviewers employed and trained by the U.S. Census Bureau. Included in these analyses were N=340,668 individuals who were followed for at least two years (i.e. did not die in the first two years) and had mortality follow-up in the fourth quarter of 2011 based on linkage constructed by the National Center for Health Statistics between surveyed individuals and death certificate records from the National Death Index (National Center for Health Statistics. Office of Analysis and Epidemiology 2015). All individuals included were surveyed only once.
Coding of alcohol use:
Since 1997 the NHIS has included three questions to assess typical quantity of drinking, frequency of drinking, and binge drinking over the past year, as well as two questions about lifetime alcohol use (Box 1). Respondents are instructed to include all types of alcoholic beverages, including liquor such as whiskey or gin, beer, wine and wine coolers. The definition of a standard drink was not provided.
Box 1: Alcohol surveys.
NHIS alcohol survey
In any one year, have you had at least 12 drinks of any type of alcoholic beverage?
In your entire life have you had at least 12 drinks of any type of alcoholic beverage?
In the past year, how often did you drink any type of alcoholic beverage? (0–365 days)
In the past year, on those days that you drank alcoholic beverages, on the average, how many drinks did you have? (1–90 drinks)
In the past year, how many days did you have 5 or more drinks of any alcoholic beverage (0–365 days)
VA alcohol survey (AUDIT-C)
How often did you have a drink containing alcohol in the past year? (never, ≤ monthly, 2–4x/month, 2–3x/week, ≥ 4x/week)
How many standard drinks containing alcohol did you have on a typical day when you were drinking in the past year? (1–2, 3–4, 5–6, 7–9, ≥10)
How often did you have six or more drinks on one occasion in the past year? (never, < monthly, monthly, weekly, daily or almost daily)
Never drinkers were defined as those who had never had 12 drinks or more in their lifetime. Former drinkers were defined as those who had 12 drinks or more in their lifetime, but had not consumed alcohol in the past year. Current drinkers were defined as those who had consumed alcohol on at least 1 day in the past year. Annual drinking frequency was converted to weekly drinking frequency by dividing by 52. For the purposes of this study, we defined binge drinking as consuming 5 or more drinks on an occasion for both men and women. We dropped N=990 individuals (0.3% of total) from the analysis due to missing alcohol-related data.
Outcomes:
The primary outcome analyzed was all-cause mortality. For secondary analyses, cancer mortality and cardiovascular mortality were evaluated using the available causes of death. Cancer mortality was coded by the NHIS, and we defined cardiovascular mortality as mortality due to either (1) diseases of the heart or (2) cerebrovascular diseases.
Covariates:
All analyses included self-reported gender, race, and age at time of survey in 5-year bins, region of country, survey administration year, health and wellness factors, and socioeconomic factors. Health and wellness factors included current smoking status (never smoker, former smoker, and current smoker categorized into cigarettes smoked per day (CPD) ≤ 10, CPD 11–20, CPD 21–30, CPD > 30), perceived health status (on a 4-level scale), exercise level (quartiles), and medical comorbidities (indicator variables for self-reported history of each of the following: AIDS, cancer, chronic obstructive pulmonary disease (COPD), diabetes mellitus, heart failure, liver disease, myocardial infarction, peripheral vascular disease, peptic ulcer disease, and rheumatoid arthritis). These comorbidities were chosen based on their inclusion in a clinical comorbidity index (Deyo, Cherkin and Ciol 1992). Socioeconomic factors included educational category (no degree, high school degree, some college, bachelor’s degree or higher), current employment status (never worked, worked in the last week, didn’t work in the past 12 months, didn’t work in the last week but worked in the past 12 months), and whether the household received food stamps in the last calendar year.
Data analysis:
Proportional hazard analyses were completed using SAS 9.4 (SAS Institute Inc. (c) 2000–2008) proc surveyphreg using the NHIS adult-sample weight from the pooled surveys adjusted for ineligible respondents. Survey adjustments include design, cluster, primary sampling units (PSU), ratio non-response and post-stratification adjustments for sample adults. The outcome variable was time between the alcohol survey and either mortality or censoring of the data (fourth quarter of 2011). In addition to the drinking pattern variables (current non-drinker, quantity, non-binge frequency, and binge frequency), models included gender, race, birth cohort (classified as a categorical variable corresponding to 5-year bins), year of survey (as a fixed effect), exercise, comorbidity, and socioeconomic factors listed above.
Because prior literature indicated that the association between alcohol use patterns and morbidity/mortality may be different for men and women (Klatsky and Udaltsova 2007), secondary analyses included stratification by gender. To minimize the effect of comorbid smoking on mortality, secondary analyses were run on the subset of individuals who were never smokers, defined by smoking fewer than 100 cigarettes in their lifetime. Secondary analyses stratified by gender and smoking status were run by using the domain statement in proc surveyphreg. Finally, to ensure observed associations were not due to survey year, we ran stratified analyses for each survey year and meta-analyzed the results.
VA
Data:
Outpatient medical records were extracted from the VA Corporate Data Warehouse (CDW) through the VA Informatics and Computing Infrastructure (VINCI). Data were extracted from the Alcohol Use Disorders Identification Test-Consumption (AUDIT-C), a brief validated screen for alcohol use disorders consisting of three items to assess typical quantity of drinking and frequency of drinking and binge drinking over the past year (Box 1) (Bush, Kivlahan, McDonell et al. 1998; Bradley, Bush, Epler et al. 2003; Bradley, DeBenedetti, Volk et al. 2007; Frank, DeBenedetti, Volk et al. 2008). The definition of a standard drink was not specified.
Inclusion criteria were date of birth between January 1, 1948 and December 31, 1968 and completing an alcohol survey in 2008 (the first full year after the survey was introduced). This resulted in a total sample size of 93,653. If a veteran completed more than one alcohol survey in 2008, the first administration was used for analysis.
Coding of alcohol use:
Patterns of alcohol use were separated into drinking quantity when not binge drinking, frequency of non-binge drinking, and frequency of binge drinking. Drinking quantity on typical drinking days was categorized into three levels: 1–2 (low-level drinking), 3–4, and 5 or more (binge drinking). Overall drinking frequency (binge drinking and non-binge drinking) and binge drinking frequency are defined in the assessment. The frequency of non-binge drinking was computed by taking the overall drinking frequency and subtracting the binge drinking frequency. Non-binge drinking was further categorized into five levels: none, monthly or less, 2–4 times monthly (reference category), 2–3 times weekly, and 4 or more times weekly (see Supplementary table S1). Binge drinking frequency was categorized into four levels: none, monthly or less, 2–3 times monthly, and weekly or more.
Outcomes:
All-cause mortality was censored at June 30, 2016. We were not able to examine cardiovascular mortality or cancer mortality because cause of death was not available.
Covariates:
Covariates included age, gender, race, and comorbidity. Comorbidity was coded as individual indicator variables for ICD-9 diagnoses corresponding to AIDS, COPD, dementia, hypertension, diabetes mellitus, liver disease, peripheral vascular disease, rheumatic disease, and peptic ulcer disease. These comorbidities were chosen based on their inclusion in a clinical comorbidity index (Deyo, Cherkin and Ciol 1992). Smoking behavior, educational attainment, and employment status were not available in this database.
The sample was divided into current non-drinkers (those who reported never having an alcoholic drink in the past year) and current drinkers (those who reported having an alcoholic drink in the past year). No information was available regarding drinking history prior to the past year. Thus, we were not able to distinguish lifetime never drinkers from former drinkers.
Data analysis:
Proportional hazard analyses were completed using SAS 9.4 (SAS Institute Inc. (c) 2000–2008). The outcome variable was time between the alcohol survey and either mortality or censoring of the data (June 30, 2016). In addition to the drinking pattern variables (current non-drinker, quantity, non-binge frequency, and binge frequency), models included gender, race, birth cohort (classified as a categorical variable corresponding to 5-year bins), and comorbidity.
Results
The characteristics of the samples are given in Table 1. Relative to the NHIS sample, the VA sample had a higher mortality rate, and more individuals with medical comorbidity. This is consistent with what would be expected for the difference between an epidemiological sample (NHIS) and a clinic-based sample (VA). In addition, the VA sample had a shorter follow-up period with less variability, more men, more African Americans, and fewer Hispanics. Of note, the VA sample had a lower proportion of current drinkers, which would be expected for an older sample with increased medical comorbidity.
Table 1:
Characteristics of samples
| NHIS | VA | |
|---|---|---|
| N | 340,668 | 93,653 |
| Sample type | epidemiological | outpatient clinic |
| Year of survey | 1997–2009 | 2008 |
| Average Age at survey (SD) | 47 (11.2) | 53 (5.1) |
| Average number of years observed among non- deceased individuals (SD) |
10.4 (3.8) | 7.7 (0.22) |
| Person-years followed*** | 2,156,198 | 704,354 |
| Mortality rate (deaths per 1000 person years)*** | 5 | 13 |
| Women*** | 55% | 11% |
| Men*** | 45% | 89% |
| African American, non-Hispanic*** | 14% | 27% |
| European American, non-Hispanic*** | 66% | 52% |
| Hispanic*** | 16% | 5% |
| Other race*** | 4% | 16% |
| Current drinkers*** | 64% | 45% |
| Current non-drinkers*** | 36% | 55% |
| Never smokers | 56% | N/A |
| Current smokers | 22% | N/A |
| Former smokers | 22% | N/A |
| Presence of significant medical comorbidity*** | 49% | 54% |
NHIS: National Health Interview Survey
VA: Veteran’s Health Administration clinics
SD: standard deviation
N/A: not available
p<0.0001 for difference between NHIS and VA
In both datasets, non-drinkers was the largest category. Most current drinkers reported drinking monthly or less, typically drinking 1–2 drinks per drinking day, and never binge drinking (Figure 1). As the frequency of non-binge drinking increased, a higher proportion of individuals reported drinking 3–4 drinks per drinking day and were categorized as binge drinkers.
Figure 1:
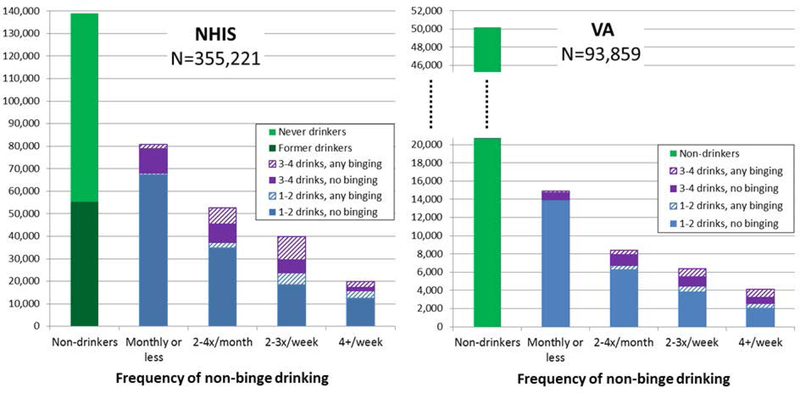
Patterns of alcohol use for each sample.
We determined the adjusted hazard ratios (HR) for all-cause mortality based on frequency of drinking for drinkers of 1–2 drinks per day in both the NHIS data and in the VA data. Frequency of low-level drinking is modeled as a continuous variable in the NHIS dataset and as a discrete variable in the VA dataset. Although our primary variable of interest was frequency of low-level drinking, all statistical models were also adjusted for typical drinking quantity and frequency of binge drinking. Fractional polynomial modeling was used in the NHIS dataset to allow for flexible parameterization of non-linear associations. Using a stepwise approach, frequency of low-level drinking in the NHIS resulted in a model containing terms for frequency and frequency cubed. Other polynomial terms, including (frequency)2, log(frequency), (frequency)−1, and (frequency)−2, were not statistically significant. Estimated hazard ratios for alcohol-related variables are given in supplementary Supplementary table S2, and are plotted in Figure 2.
Figure 2:
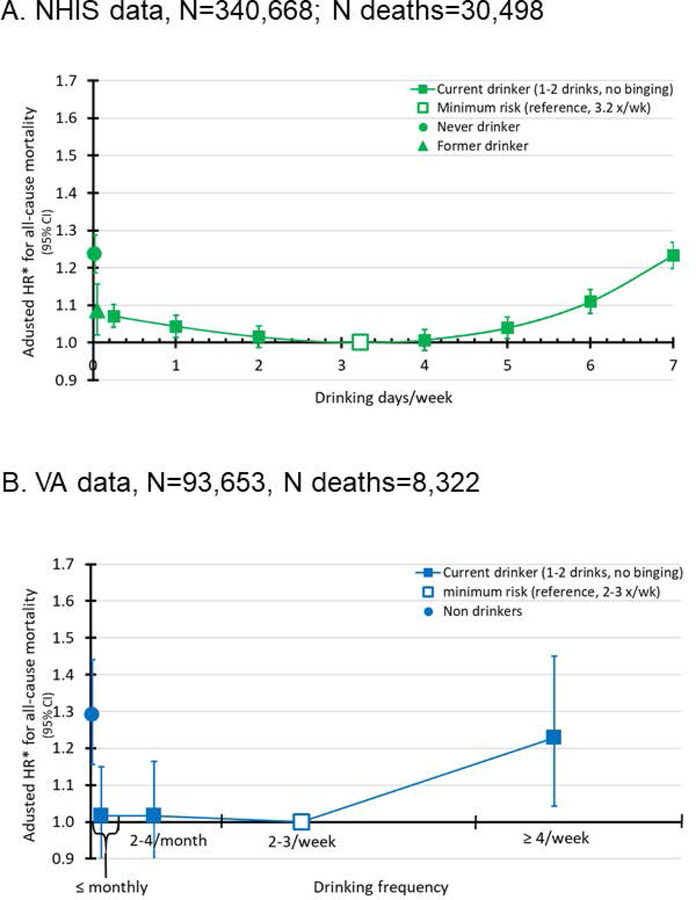
Adjusted hazard ratios* of all-cause mortality by drinking frequency for individuals who drink 1–2 drinks on occasion and never binge drink.
2A. NHIS data, N=340,668; N deaths=30,498
*NHIS hazard ratios are adjusted for birth cohort, gender, race, typical drinking quantity when not binge drinking, frequency of binge drinking, health and wellness factors (current smoking status, perceived health status, exercise level, and medical comorbidities), socioeconomic factors (educational attainment, employment status, and whether the household received food stamps in the last calendar year), region of country, and year of survey.
2B. VA data, N=93,653; N deaths=8,322
*VA hazard ratios are adjusted for birth cohort, gender, race, typical drinking quantity when not binge drinking, frequency of binge drinking, and medical comorbidities.
In both datasets, the reference group was defined as the frequency of non-binge drinking associated with the lowest risk of all-cause mortality: 3.2 times weekly for the NHIS sample and 2–3 times weekly for the VA sample. Despite the differences between the two datasets, the trends are the same. The minimum risk for all-cause mortality is estimated to be drinking 1–2 drinks approximately 2–3 times weekly, and risk of all-cause mortality increased as the number of drinking occasions increased. In the NHIS sample, using drinking 1–2 drinks 3.2 times weekly as the reference group, all-cause mortality is increased in a stepwise fashion to HR=1.05 (p=0.003) for drinking 1–2 drinks 5 times weekly, HR=1.12 (p<0.0001) for drinking 1–2 drinks 6 times weekly, and HR=1.26 (p<0.0001) for drinking 1–2 drinks 7 times weekly. In the VA data drinking 1–2 drinks 4 or more times weekly is associated with an HR=1.23 (p=0.01) when compared to drinking 1–2 drinks 2–3 times weekly (the reference).
Relative to the reference, drinking less frequently also showed increased risk for all-cause mortality in the NHIS data, but not in the VA data. Specifically, in the NHIS data relative to drinking 3.2 times weekly, the increased risk in all-cause mortality was HR=1.04 (p=0.05) for individuals who drank once weekly, and HR=1.06 (p<0.01) for individuals who drank once monthly. In the VA data, relative to drinking 2–3 times weekly, drinking 1–2 drinks 2–4 times monthly (HR=1.02, p=0.8) or less than monthly (HR=1.02, p=0.8) did not have a statistically significant increased risk of all-cause mortality.
Because unmeasured confounders may be different between current drinkers and non-drinkers, non-drinkers were evaluated separately and were found to have increased risk of mortality relative to current drinkers who drink 1–2 drinks per occasion and never binge. In the NHIS data, increased risk for all-cause mortality was seen in never-drinkers (HR=1.24, p<0.0001) and in former drinkers (HR=1.14, p<0.0001) relative to drinking 1–2 drinks 3.2 times weekly. In the VA dataset, increased risk for all-cause mortality was seen in non-drinkers (HR=1.29, p<0.0001), relative to drinking 1–2 drinks 2–3 times weekly. There was no variable in the VA data to distinguish between never drinkers and former drinkers.
Using the causes of mortality available in the NHIS data, we evaluated the association between the frequency of non-binge drinking with risk of cardiovascular mortality and risk of cancer-related mortality (Figure 3). A J-shaped relationship was seen between frequency of non-binge drinking and risk of cardiovascular mortality: the minimum risk was seen in individuals who drank 1–2 drinks 4 times weekly. In contrast, the risk of cancer-related mortality increased linearly with frequency of non-binge drinking (i.e. the minimum risk was in individuals who drank 1–2 drinks once monthly, and in former drinkers).
Figure 3:
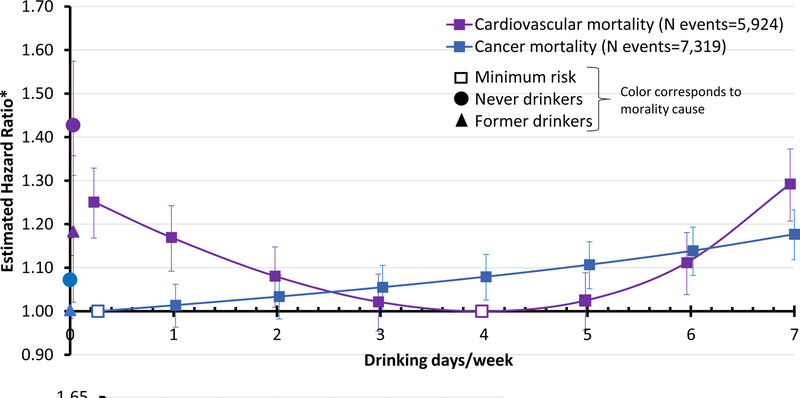
Estimated hazard ratios for mortality due to cardiovascular disease and cancer based on the frequency of non-binge drinking. Curves correspond to risk for individuals who typically drink 1–2 drinks per occasion and never binge in the NHIS dataset.
*Hazard ratios are adjusted for birth cohort, gender, race, typical drinking quantity when not binge drinking, frequency of binge drinking, health and wellness factors (current smoking status, perceived health status, exercise level, and medical comorbidities), socioeconomic factors (educational attainment, employment status, and whether the household received food stamps in the last calendar year), region of country, and year of survey.
There is strong evidence that alcohol-related health effects differ between men and women (Klatsky and Udaltsova 2007; Zheng, Erzurumluoglu, Elsworth et al. 2017), therefore stratified analyses were run in the NHIS data (Figure 4) and in the VA data. The results from the stratified analysis in the VA data are not shown because extremely wide confidence intervals in women suggest lack of power. Increased mortality risk was seen with daily or near daily non-binge drinking in both men and women, although men and women differed with respect to the non-binge drinking frequency at which all-cause and cardiovascular mortality risks were minimized: for all-cause mortality the minimum risk for women was at a lower frequency of drinking (1–2 drinks 2.7 times weekly) compared to men (1–2 drinks 3.4 times weekly). For cardiovascular mortality, the gender differences were reversed, with the minimum risk for women being 1–2 drinks 4.3 times weekly and for men 1–2 drinks 4.0 times weekly. With respect to cancer mortality, minimum risk was drinking 1–2 drinks once monthly for both women and men, the minimum frequency for current drinkers. In the VA dataset, there were no statistically significant interactions between gender and drinking patterns in terms of all-cause mortality (the VA dataset did not have causes of death to partition this by cardiovascular and cancer mortality).
Figure 4:
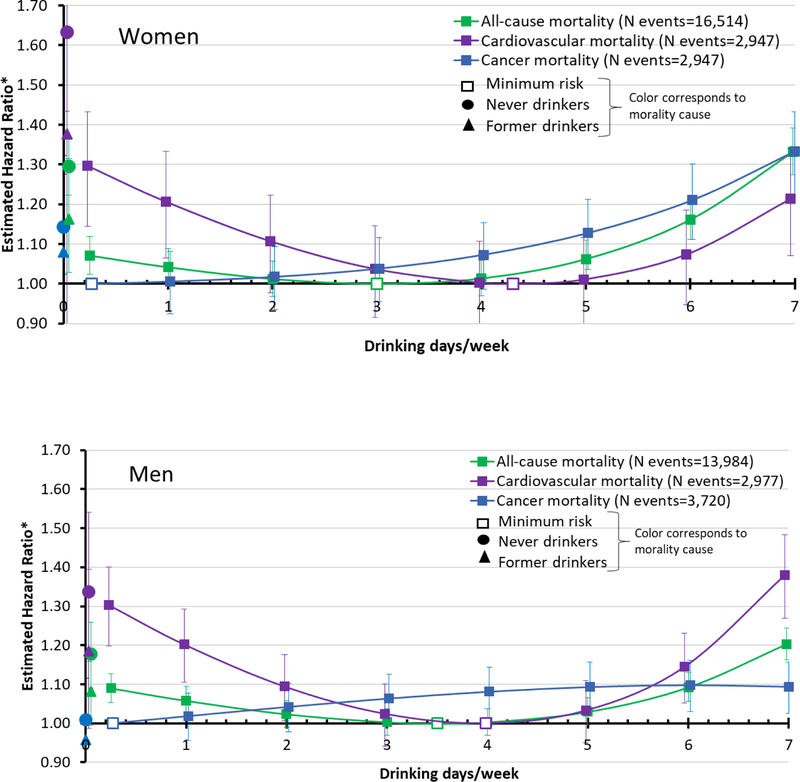
Gender-stratified hazard ratios for mortality based on frequency of non-binge drinking. Curves correspond to risk for individuals who typically drink 1–2 drinks per occasion and never binge in the NHIS dataset.
*Hazard ratios are adjusted for birth cohort, gender, race, typical drinking quantity when not binge drinking, frequency of binge drinking, health and wellness factors (current smoking status, perceived health status, exercise level, and medical comorbidities), socioeconomic factors (educational attainment, employment status, and whether the household received food stamps in the last calendar year), region of country, and year of survey.
Smoking behavior is confounded with alcohol use and increases the risk of mortality. Although all analyses were adjusted for smoking behavior in the NHIS sample, we also specifically evaluated the association between frequency of non-binge drinking and mortality in the NHIS subsample of individuals who never smoked 100 cigarettes in their lifetime (N=155,308). Consistent with the overall dataset, among never smokers who typically drank 1–2 drinks at a time and never binged, increased all-cause mortality was seen with daily or near-daily drinking (Supplementary Figure s1) relative to the never smokers who drank the same amount, but only 3–4 days per week.
Discussion
Using two large, independent datasets, this study identified an increased risk in mortality among individuals who drink 1–2 drinks 4 or more times weekly compared to individuals who drink 1–2 drinks 3 times weekly, despite the fact that both groups may be drinking within the current U.S. dietary guidelines of up to 1 drink daily for women and up to 2 drinks daily for men (Division of Population Health ; U.S. Department of Health and Human Services and U.S. Department of Agriculture 2015; National Institute on Alcohol Abuse and Alcoholism 2016). Although other studies have evaluated the association between drinking frequency and mortality (2003; Foster and Marriott 2006; Costanzo, Di Castelnuovo, Donati et al. 2010), the unique aspect of our study is in identifying the nadir of all-cause mortality associated with the frequency of low level drinking and using that nadir as the reference category for comparison, rather than using non-drinkers as the reference category.
In both the NHIS dataset, an epidemiologic sample, and VA dataset, a clinical sample, the nadir of all-cause mortality is drinking 1–2 drinks approximately 3 times weekly, and drinking 1–2 drinks more frequently increases the risk of all-cause mortality. In our analyses of the NHIS and VA data, drinking daily does not show increased risk of all-cause mortality relative to non-drinkers, which is consistent with previously published studies, and is the reason for the J or U-shaped curve often discussed in the literature (Costanzo, Di Castelnuovo, Donati et al. 2010). However, the reference category with the lowest risk level of alcohol consumption is essential for making recommendations regarding alcohol use. For example, the current U.S. dietary guidelines recommend that non-drinkers remain abstinent from alcohol (Division of Population Health; U.S. Department of Health and Human Services and U.S. Department of Agriculture 2015; National Institute on Alcohol Abuse and Alcoholism 2016), and it is appropriate to guide current drinkers based on the minimum all-cause mortality seen based on drinking patterns among those who drink.
In addition to analyzing all-cause mortality, we examined cardiovascular and cancer mortality in the NHIS dataset. Cardiovascular mortality is U-shaped with a nadir of drinking 3–4 days per week, however cancer-related mortality is minimized at the lowest level of alcohol consumption ,and risk linearly increases with frequency of drinking, even at low levels of drinking. This differential effect of drinking on causes of mortality highlights an opportunity for precision prevention: individuals with a strong family history of cardiovascular disease may reduce risk by drinking a few days per week whereas individuals with a strong family history of cancer may be cautioned not to drink at all to minimize risk.
A study was recently published by Xi and colleagues that analyzed the same NHIS data included here (Xi, Veeranki, Zhao et al. 2017). Using the reference group of never-drinkers, the study reported decreased risk of all-cause mortality with both light drinking (12 drinks yearly to less than 3 drinks weekly), and low-level drinking (3 to 14 drinks weekly for men, and 3 to 7 drinks weekly for women). In addition to differing categories of alcohol use, Xi et al. used slightly different covariates (a detailed comparison of the two studies is given in the appendix). The current study extends their findings by examining the relative effect of frequency of alcohol use within a set of light and moderate drinkers.
Our analytic strategy sought to minimize the possibility that the observed effects of alcohol on mortality are due to confounding. All analyses were adjusted for age, gender, race, comorbidity, drinking quantity, and binge drinking frequency. In addition, we adjusted for smoking status in the NHIS sample (smoking status was not available in the VA sample). Finally, we repeated the analyses in the NHIS subset of never smokers. Because the findings were robust across analyses, the observed associations are unlikely to be due to these potential confounders. However, other unmeasured confounders may have influenced the results. For example, psychosocial stressors that may disproportionately and adversely affect individuals of low socioeconomic status may negatively affect health outcomes. Therefore, the inability to adjust for these factors may bias the results. In addition, the VA sample had a higher proportion of individuals with comorbidities, and because some of them may have reduced drinking after development of certain illnesses, the inability to differentiate former drinkers from lifetime abstainers is important to note.
The datasets used in this study are large and have complementary designs, but there are potential limitations. First, both studies relied on in-person measurements of self-reported alcohol use, rather than anonymous reports. This is of concern because when comparing alcohol use from in-person surveys to anonymous surveys, the in-person surveys show under-reporting of alcohol use (Polich 1982; Del Boca and Darkes 2003). In addition, although outcomes were measured at the end of the study period, alcohol use patterns were measured once. This likely resulted in higher variance than if repeated measures of use were available.
In summary this report demonstrates an association between increased mortality and drinking behaviors that falls within the current U.S. dietary guidelines for “healthy” alcohol use. Consuming 1–2 drinks at a time on five or more occasions weekly was associated with elevated risk of all-cause mortality, relative to drinking less frequently. This finding was observed in both a large epidemiological sample and a large clinic population and suggests that the guidelines for “healthy” alcohol use should be lowered.
Supplementary Material
Acknowledgments
FUNDING:
This research was funded by grants from the National Institutes of Health: K08DA032680 and R21 AA024888 to SMH, R01DA036583 and U10AA008401 to LJB, R21AA025689 and R01DA042195 to RAG, R21DA033827 to RCC, and UL1RR024992 to BE. In addition, SMH was funded by grant 2015215 from the Doris Duke Charitable Foundation. This research is the result of work supported with resources and the use of facilities at the VA Eastern Kansas Healthcare System (Leavenworth, Kansas campus).
Footnotes
CONFLICTS OF INTEREST
Dr. Bierut is listed as an inventor on Issued U.S. Patent 8,080,371, “Markers for Addiction” covering the use of certain SNPs in determining the diagnosis, prognosis, and treatment of addiction.
References
- Anstie FE (1870). On the use of wines in health and disease New York, J. S. Redfield. [Google Scholar]
- Bradley KA, Bush KR, et al. (2003). “Two brief alcohol-screening tests From the Alcohol Use Disorders Identification Test (AUDIT): validation in a female Veterans Affairs patient population.” Arch Intern Med 163(7): 821–829. [DOI] [PubMed] [Google Scholar]
- Bradley KA, DeBenedetti AF, et al. (2007). “AUDIT-C as a brief screen for alcohol misuse in primary care.” Alcohol Clin Exp Res 31(7): 1208–1217. [DOI] [PubMed] [Google Scholar]
- Britton A and Bell S (2017). “The protective effects of moderate drinking: lies, damned lies, and… selection biases?” Addiction 112(2): 218–219. [DOI] [PubMed] [Google Scholar]
- Britton A and Marmot M (2004). “Different measures of alcohol consumption and risk of coronary heart disease and all-cause mortality: 11-year follow-up of the Whitehall II Cohort Study.” Addiction 99(1): 109–116. [DOI] [PubMed] [Google Scholar]
- Bush K, Kivlahan DR, et al. (1998). “The AUDIT alcohol consumption questions (AUDIT-C): an effective brief screening test for problem drinking. Ambulatory Care Quality Improvement Project (ACQUIP). Alcohol Use Disorders Identification Test.” Arch Intern Med 158(16): 1789–1795. [DOI] [PubMed] [Google Scholar]
- Cao Y, Willett WC, et al. (2015). “Light to moderate intake of alcohol, drinking patterns, and risk of cancer: results from two prospective US cohort studies.” Bmj 351: h4238. [DOI] [PMC free article] [PubMed] [Google Scholar]
- Chen WY, Rosner B, et al. (2011). “Moderate alcohol consumption during adult life, drinking patterns, and breast cancer risk.” JAMA : the journal of the American Medical Association 306(17): 1884–1890. [DOI] [PMC free article] [PubMed] [Google Scholar]
- Chikritzhs T, Fillmore K, et al. (2009). “A healthy dose of scepticism: four good reasons to think again about protective effects of alcohol on coronary heart disease.” Drug Alcohol Rev 28(4): 441–444. [DOI] [PubMed] [Google Scholar]
- Chikritzhs T, Stockwell T, et al. (2015). “Has the leaning tower of presumed health benefits from ‘moderate’ alcohol use finally collapsed?” Addiction 110(5): 726–727. [DOI] [PubMed] [Google Scholar]
- Costanzo S, Di Castelnuovo A, et al. (2010). “Alcohol consumption and mortality in patients with cardiovascular disease: a meta-analysis.” J Am Coll Cardiol 55(13): 1339–1347. [DOI] [PubMed] [Google Scholar]
- Costanzo S, Di Castelnuovo A, et al. (2010). “Cardiovascular and overall mortality risk in relation to alcohol consumption in patients with cardiovascular disease.” Circulation 121(17): 1951–1959. [DOI] [PubMed] [Google Scholar]
- Del Boca FK and Darkes J (2003). “The validity of self-reports of alcohol consumption: state of the science and challenges for research.” Addiction 98 Suppl 2: 1–12. [DOI] [PubMed] [Google Scholar]
- Deyo RA, Cherkin DC, et al. (1992). “Adapting a clinical comorbidity index for use with ICD-9-CM administrative databases.” J Clin Epidemiol 45(6): 613–619. [DOI] [PubMed] [Google Scholar]
- Di Castelnuovo A, Costanzo S, et al. (2006). “Alcohol dosing and total mortality in men and women: an updated meta-analysis of 34 prospective studies.” Arch Intern Med 166(22): 2437–2445. [DOI] [PubMed] [Google Scholar]
- Division of Population Health. (July 25, 2016). “Alcohol Use and Your Health.” Retrieved September 20, 2016, from http://www.cdc.gov/alcohol/fact-sheets/alcohol-use.htm.
- Fillmore KM, Stockwell T, et al. (2007). “Moderate alcohol use and reduced mortality risk: systematic error in prospective studies and new hypotheses.” Ann Epidemiol 17(5 Suppl): S16–23. [DOI] [PubMed] [Google Scholar]
- Foster RK and Marriott HE (2006). “Alcohol consumption in the new millennium - weighing up the risks and benefits for our health.” Nutrition Bulletin 31: 286–331. [Google Scholar]
- Frank D, DeBenedetti AF, et al. (2008). “Effectiveness of the AUDIT-C as a screening test for alcohol misuse in three race/ethnic groups.” J Gen Intern Med 23(6): 781–787. [DOI] [PMC free article] [PubMed] [Google Scholar]
- GBD 2016 Alcohol Collaborators (2018). “Alcohol use and burden for 195 countries and territories, 1990–2016: a systematic analysis for the Global Burden of Disease Study 2016.” Lancet [DOI] [PMC free article] [PubMed]
- Goulden R (2016). “Moderate Alcohol Consumption Is Not Associated with Reduced All-cause Mortality.” Am J Med 129(2): 180–186 e184. [DOI] [PubMed] [Google Scholar]
- Holmes MV, Dale CE, et al. (2014). “Association between alcohol and cardiovascular disease: Mendelian randomisation analysis based on individual participant data.” Bmj 349: g4164. [DOI] [PMC free article] [PubMed] [Google Scholar]
- Kerr WC, Greenfield TK, et al. (2011). “Racial and ethnic differences in all-cause mortality risk according to alcohol consumption patterns in the national alcohol surveys.” Am J Epidemiol 174(7): 769–778. [DOI] [PMC free article] [PubMed] [Google Scholar]
- Klatsky AL and Udaltsova N (2007). “Alcohol Drinking and Total Mortality Risk.” Ann Epidemiol 17(5, Supplement): S63–S67. [Google Scholar]
- Klatsky AL and Udaltsova N (2007). “Alcohol drinking and total mortality risk.” Ann Epidemiol 17: S63–S67. [Google Scholar]
- Klatsky AL and Udaltsova N (2013). “Abounding confounding: sick quitters and healthy drinkers.” Addiction 108(9): 1549–1552. [DOI] [PubMed] [Google Scholar]
- Larsson SC, Orsini N, et al. (2015). “Alcohol consumption and risk of heart failure: a dose-response meta-analysis of prospective studies.” Eur J Heart Fail 17(4): 367–373. [DOI] [PubMed] [Google Scholar]
- Minnesota Population Center and State Health Access Data Assistance Center (2016). Integrated Health Interview Series: Version 6.21 Minneapolis, University of Minnesota. [Google Scholar]
- Mostofsky E, Mukamal KJ, et al. (2016). “Key Findings on Alcohol Consumption and a Variety of Health Outcomes From the Nurses’ Health Study.” Am J Public Health 106(9): 1586–1591. [DOI] [PMC free article] [PubMed] [Google Scholar]
- Mukamal KJ, Chen CM, et al. (2010). “Alcohol consumption and cardiovascular mortality among U.S. adults, 1987 to 2002.” J Am Coll Cardiol 55(13): 1328–1335. [DOI] [PMC free article] [PubMed] [Google Scholar]
- Mukamal KJ, Clowry CM, et al. (2016). “Moderate Alcohol Consumption and Chronic Disease: The Case for a Long-Term Trial.” Alcohol Clin Exp Res 40(11): 2283–2291. [DOI] [PMC free article] [PubMed] [Google Scholar]
- Mukamal KJ, Conigrave KM, et al. (2003). “Roles of drinking pattern and type of alcohol consumed in coronary heart disease in men.” N Engl J Med 348(2): 109–118. [DOI] [PubMed] [Google Scholar]
- Mukamal KJ, Jensen MK, et al. (2005). “Drinking Frequency, Mediating Biomarkers, and Risk of Myocardial Infarction in Women and Men.” Circulation 112(10): 1406–1413. [DOI] [PubMed] [Google Scholar]
- Naimi TS, Brown DW, et al. (2005). “Cardiovascular risk factors and confounders among nondrinking and moderate-drinking U.S. adults.” Am J Prev Med 28(4): 369–373. [DOI] [PubMed] [Google Scholar]
- Naimi TS, Stockwell T, et al. (2017). “Selection bias and relationships between alcohol consumption and mortality.” Addiction 112(2): 220–221. [DOI] [PubMed] [Google Scholar]
- Naimi TS, Stockwell T, et al. (2017). “Selection biases in observational studies affect associations between ‘moderate’ alcohol consumption and mortality.” Addiction 112(2): 207–214. [DOI] [PubMed] [Google Scholar]
- National Center for Health Statistics. Office of Analysis and Epidemiology (2015). Public-use Linked Mortality File Hyattsville, Maryland. [Google Scholar]
- National Institute on Alcohol Abuse and Alcoholism (2016). Rethinking Drinking N. I. o. Health, U.S. Department of Health and Human Services; NIH Publication Number 15–3770. [Google Scholar]
- Polich JM (1982). “The validity of self-reports in alcoholism research.” Addict Behav 7(2): 123–132. [DOI] [PubMed] [Google Scholar]
- Rabin RC (2018). N.I.H. Lobbied Industry to Fund Study of Alcohol’s Effect New York Times; New York, NY. [Google Scholar]
- Ricci C, Wood A, et al. (2018). “Alcohol intake in relation to non-fatal and fatal coronary heart disease and stroke: EPIC-CVD case-cohort study.” BMJ 361. [DOI] [PMC free article] [PubMed] [Google Scholar]
- Ronksley PE, Brien SE, et al. (2011). “Association of alcohol consumption with selected cardiovascular disease outcomes: a systematic review and meta-analysis.” Bmj 342: d671. [DOI] [PMC free article] [PubMed] [Google Scholar]
- SAS Institute Inc. ( (c) 2000–2008). SAS 9.4 Cary, NC. [Google Scholar]
- Sempos CT, Rehm J, et al. (2003). “Average volume of alcohol consumption and all-cause mortality in African Americans: the NHEFS cohort.” Alcohol Clin Exp Res 27(1): 88–92. [DOI] [PubMed] [Google Scholar]
- Stahre M, Roeber J, et al. (2014). “Contribution of excessive alcohol consumption to deaths and years of potential life lost in the United States.” Prev Chronic Dis 11: 130293. [DOI] [PMC free article] [PubMed] [Google Scholar]
- Stockwell T and Room R (2012). “Constructing and responding to low-risk drinking guidelines: conceptualisation, evidence and reception.” Drug Alcohol Rev 31(2): 121–125. [DOI] [PubMed] [Google Scholar]
- Stockwell T, Zhao J, et al. (2016). “Do “Moderate” Drinkers Have Reduced Mortality Risk? A Systematic Review and Meta-Analysis of Alcohol Consumption and All-Cause Mortality.” J Stud Alcohol Drugs 77(2): 185–198. [DOI] [PMC free article] [PubMed] [Google Scholar]
- Tolstrup J, Jensen MK, et al. (2006). “Prospective study of alcohol drinking patterns and coronary heart disease in women and men.” Bmj 332(7552): 1244–1248. [DOI] [PMC free article] [PubMed] [Google Scholar]
- Trichopoulou A, Bamia C, et al. (2010). “Conformity to traditional Mediterranean diet and breast cancer risk in the Greek EPIC (European Prospective Investigation into Cancer and Nutrition) cohort.” Am J Clin Nutr 92(3): 620–625. [DOI] [PubMed] [Google Scholar]
- U.S. Department of Health and Human Services and U.S. Department of Agriculture (2015). 2015 – 2020 Dietary Guidelines for Americans
- Wood AM, Kaptoge S, et al. (2018). “Risk thresholds for alcohol consumption: combined analysis of individual-participant data for 599 912 current drinkers in 83 prospective studies.” Lancet 391(10129): 1513–1523. [DOI] [PMC free article] [PubMed] [Google Scholar]
- Wood AM, Kaptoge S, et al. (2018). “Risk thresholds for alcohol consumption: combined analysis of individual-participant data for 599 912 current drinkers in 83 prospective studies.” The Lancet 391(10129): 1513–1523. [DOI] [PMC free article] [PubMed] [Google Scholar]
- World Cancer Research Fund and American Institute for Cancer Research (2018). Alcoholic drinks and the risk of cancer
- Xi B, Veeranki SP, et al. (2017). “Relationship of Alcohol Consumption to All-Cause, Cardiovascular, and Cancer-Related Mortality in U.S. Adults.” J Am Coll Cardiol 70(8): 913–922. [DOI] [PubMed] [Google Scholar]
- Xi B, Veeranki SP, et al. (2017). “Relationship of Alcohol Consumption to All-Cause, Cardiovascular, and Cancer-Related Mortality in U.S. Adults.” Journal of the American College of Cardiology 70(8): 913–922. [DOI] [PubMed] [Google Scholar]
- Zheng J, Erzurumluoglu AM, et al. (2017). “LD Hub: a centralized database and web interface to perform LD score regression that maximizes the potential of summary level GWAS data for SNP heritability and genetic correlation analysis.” Bioinformatics 33(2): 272–279. [DOI] [PMC free article] [PubMed] [Google Scholar]
- Zheng YL, Lian F, et al. (2015). “Alcohol intake and associated risk of major cardiovascular outcomes in women compared with men: a systematic review and meta-analysis of prospective observational studies.” BMC Public Health 15: 773. [DOI] [PMC free article] [PubMed] [Google Scholar]
Associated Data
This section collects any data citations, data availability statements, or supplementary materials included in this article.