

Abstract
PURPOSE:
To compare measurements of papilledema using fundus photography, optical coherence tomography (OCT), and Frisén score in patients with idiopathic intracranial hypertension (IIH).
DESIGN:
Retrospective, non-comparative analysis of RCT data.
METHODS:
The Idiopathic Intracranial Hypertension Treatment Trial (IIHTT) evaluated weight-management and treatment with acetazolamide compared with placebo in patients with IIH and mild visual loss. Among the 126 subjects in the IIHTT OCT sub-study, fundus photographs and OCT scans of the optic disc were taken at baseline and at 6 and 12 months after enrollment. Trained readers scored each eye using a modified Frisén scale and measured the area of disc elevation. OCT scans assessed optic nerve head (ONH) volume. Correlations between volume and area were computed for both study and non-study eyes.
RESULTS:
Disc area and ONH volume were positively correlated at baseline (R2=0.77 in study eyes, p<0.001). Correlations between area and volume were similar in the treatment groups at baseline, but were weaker in the acetazolamide group compared with the placebo group at 6 months (R2=0.25 vs 0.76 in study eyes) and 12 months (R2=0.19 vs 0.65 in study eyes). At 6 and 12 months after enrollment, there was no consistent relationship between Frisén score, disc area and ONH volumes in the acetazolamide group.
CONCLUSION:
Frisén score fails to reflect the photographic area and OCT volume of papilledema after treatment with acetazolamide. Clinicians should use caution when using the Frisén scale to monitor the effect of treatment on papilledema over time.
INTRODUCTION
Idiopathic Intracranial Hypertension (IIH) is a disease typically affecting obese women of childbearing age, characterized by the signs and symptoms of raised intracranial pressure including papilledema, pulsatile tinnitus and headache, an absence of focal neurologic deficits, and normal imaging and cerebrospinal fluid analysis.1–3 Untreated, it may lead to irreversible vision loss.4 The Frisén scale is a clinical tool used to evaluate papilledema in patients with IIH, using characteristics of the optic nerve head appearance including the degree of blurred disc margins and obscuration of vessels on the disc.5 However, there are shortcomings to the Frisén scale, including the variability of assessments among observers, the poor sensitivity to small changes in papilledema, and the fact that it is an ordinal, non-continuous measurement.6 Alternative methods such as optical coherence tomography (OCT) and fundus photography have been investigated as potential tools to quantify papilledema and monitor the response to therapy.7 Using data collected during the Idiopathic Intracranial Hypertension Treatment Trial (IIHTT), both the volume of optic nerve head swelling assessed via OCT with 3D segmentation and the area of disc swelling measured in fundus photographs were shown to highly correlate with Frisén score in patients newly diagnosed with IIH.8,9
While the reliability of these quantitative assessments of papilledema has been demonstrated, the relationship between these two parameters – disc volume and disc area —has not been explored over time and with treatment. Whether each parameter captures unique information about the degree of optic nerve swelling, or if the information captured through these modalities is highly correlated and thus redundant, is unknown. How pharmacologic or weight management treatment of IIH may potentially alter the relationship between optic nerve volume by OCT and optic disc area has not been studied. Finally, the relationship of Frisén score to physical alterations in the disc which evolve over time is unknown.
With new quantitative methods available to assess and quantify papilledema, it is important to understand whether such novel modalities are interchangeable or should be used in conjunction with one another to guide clinical assessment of papilledema and inform clinical management. The objectives of this study are: (1) to evaluate the correlation between optic disc volume and area in patients with IIH; (2) to assess whether pharmacologic treatment of IIH alters the relationship between disc volume and area compared to weight loss alone; and (3) to assess the correlation between Frisén score, disc area and optic nerve head volume at several time points following diagnosis of IIH.
METHODS
Data sources:
Data was collected during the baseline and follow up periods of the Idiopathic Intracranial Hypertension Treatment Trial (IIHTT), the details and study design of which have been previously published.10,11 The IIHTT was a multicenter, double-blind, randomized, placebo-controlled study of acetazolamide in subjects with IIH and mild visual loss who received a low-sodium weight-reduction diet. The clinical etrials identifier for the IIHTT is NCT01003639. Selection criteria for inclusion in the IIHTT have been detailed elsewhere.11 Briefly, participants were ages 18–60, had reproducible mild visual field loss, had bilateral papilledema and elevated CSF opening pressure, were previously untreated for IIH, and had no secondary cause of raised ICP. They were enrolled in the IIHTT through 38 North American sites from March 2010 to November 2012. The study was approved by the institutional review board at each site and individual written informed consent was obtained. The tenets of the Declaration of Helsinki were followed.
There were 165 subjects enrolled in the IIHTT. Due to the availability of the study specific OCT, 126 subjects at 24 sites were included in the OCT sub-study at baseline.9,10,12 At baseline, there were 124 subjects with valid measurements of optic nerve head (ONH) volume. Of these subjects, 118 had measured fundus disc areas and were included in our analysis. At 6 months, of the 88 subjects with valid OCT data, 84 had disc areas and were included in our analysis. At 12 months, of the 67 subjects with valid OCT data, 66 had disc areas and were included in our analysis. Reasons for non-valid OCT measurements of ONH volume included the retinal pigment epithelium being out of the boundary of the scan, and poor image quality, in total affecting 5 eyes (5 subjects) at baseline and 3 eyes (2 subjects) at 6 months. Reasons for exclusion of measured fundus disc areas included a history of refractive surgery affecting 2 subjects, one study site with a photography calibration issue affecting 3 subjects, photos being taken by a non-certified photographer affecting 1 subject, and incorrect designation of camera type (ie, Topcon versus Zeiss) affecting 1 subject.
Variables:
Patients enrolled in the IIHTT underwent automated perimetry in both eyes, and the eye with the most severe visual loss at baseline was designated as the study eye, and the contralateral eye was designated as the non-study eye.11 Standardized fundus photos were taken of the study eye and the non-study eye at sites at baseline, 6 months, and 12 months after enrollment.8 Trained readers at the Photographic Reading Center (PRC) measured the area of total disc elevation using an electronic ruler tool. Measurements of total disc area include both the highly reflective central component (“white” elevation) and a less reflective peripheral component still appearing elevated and disappearing into the plane of the retina (“dark” elevation), as previously detailed.8 A modified Frisén Scale was used to clinically grade each eye using a scale from 0 (normal) to 5 (severe papilledema).5,8 Follow-up subjects with Frisén grades 0–2 were rescored based upon a consensus of the IIHTT Steering Committee that 9 clock hours of halo were required to earn a grade of 1.
Assessment of the volume of optic nerve head (ONH) swelling and other OCT measurements of the ONH and macula were conducted at the OCT Reading Center and the bioengineering group at the University of Iowa.9 The image acquisition protocol has been previously detailed.9 Briefly, calculations of ONH volume were abstracted from three-dimensional segmentation analysis of scans centered on the optic disc (using Cirrus, spectral domain OCT machines, Zeiss-Meditec, Inc, Dublin, CA), measuring the volume between the internal limiting membrane and the retinal pigment epithelium.9 The scans from the baseline, 6 month, and 12 month follow up periods were used in our analyses. Two scans were performed per eye and the average ONH volume of the two scans was calculated and used in our analyses, except when only one value was available due to technical error in a small number of cases.
Intervention:
This was a double masked study with randomization to treatment group with either acetazolamide or placebo, and both groups were offered voluntary weight managment.11 At the 6 month visit, subjects were transitioned to open label acetazolamide without being told which study drug they had been previously taking, and using the same increasing dosage schedule used at the onset of the IIHTT.13 The majority of subjects in the placebo group were transitioned to open label acetazolamide at the 6 month visit (25 of 33; 76%), and the majority of subjects in the acetazolamide group continued to take acetazolamide at the 6 month visit (21 of 33; 64%).13 Therefore, in our 12 month analyses, patients in the original placebo treatment group are renamed the post-placebo treatment group, and patients in the original acetazolamide group continue as the acetazolamide group.
Outcomes:
Correlation between OCT ONH volume and photographic disc areas was assessed at baseline, 6 months, and 12 month follow up periods using Pearson correlation coefficients (R) and R2 values. Subjects were then separated into acetazolamide and placebo treatment groups, and correlations were re-calculated and compared.
Analysis:
Two-tailed student’s T-Tests assuming unequal variances were performed to evaluate differences in disc volumes and areas between patients in the acetazolamide and placebo groups at 6 months and acetazolamide and post-placebo groups at 12 months. Pearson’s correlation coefficients were performed to evaluate the correlation between disc volume and area at all visits. Correlations were calculated separately for the acetazolamide and placebo groups at 6 months and the acetazolamide and post-placebo groups at 12 months. In all analyses, study eyes and non-study eyes were analyzed separately in order to ensure independence of the variables. The p-value significance level was set at α ≤ 0.05.
RESULTS
A description of the study eyes and non-study eyes included in the analysis is shown in Table 1. Among study eyes, the mean ONH volume and disc areas did not differ between treatment groups at baseline. However, at 6 months, the mean ONH volume of study eyes was less in the acetazolamide group than in the placebo group (11.74 mm3 vs 13.84 mm3; p<0.001). Likewise, at 6 months, the disc areas were smaller in the acetazolamide group compared to the placebo group (5.05 mm2 vs 8.15 mm2, p<0.001). Similarly, in the non-study eyes, the mean ONH volume and disc areas did not significantly differ between treatment groups at baseline. However, at 6 months of follow up, the mean ONH volumes and disc areas were significantly smaller among the acetazolamide group when compared to the placebo group (11.67 mm3 vs 13.23 mm3; 5.02 mm2 vs 7.52 mm2, respectively; p≤0.001). At 12 months, in both study eyes and non-study eyes, ONH volume and disc areas of both treatment groups decreased relative to the 6 month measurements. The disc areas and mean ONH volumes were smaller in the acetazolamide group compared to the post-placebo group, however, these differences did not reach statistical significance.
Table 1.
Characteristics of Study Eyes and Non-Study Eyes in Subjects with Idiopathic Intracranial Hypertension. Optic nerve head (ONH) volume and disc area in study eyes (top) and non-study eyes (bottom) are shown at baseline, 6 months, and 12 months. Statistically significant (p≤0.001) differences in mean volumes and areas between the acetazolamide and placebo groups are noted with an asterix (*); at 6 months, in comparisons of both study eyes and non-study eyes, subjects in the acetazolamide group had statistically smaller ONH volumes and disc areas compared to the placebo group.
| Study Eye | ONH Volume (mm3) | Disc Area (mm2) | |||
|---|---|---|---|---|---|
| n | mean | sd | mean | sd | |
| Baseline | 114 | 16.51 | 3.72 | 12.00 | 4.80 |
| Placebo | 57 | 16.49 | 3.68 | 12.34 | 4.99 |
| Acetazolamide | 57 | 16.53 | 3.80 | 11.66 | 4.62 |
| 6 months | 83 | 12.70 | 2.16 | 6.47 | 3.64 |
| Placebo | 38 | 13.84* | 2.58 | 8.15* | 4.16 |
| Acetazolamide | 45 | 11.74* | 1.01 | 5.05* | 2.36 |
| 12 months | 66 | 11.75 | 1.35 | 4.40 | 2.21 |
| Post-Placebo | 33 | 12.03 | 1.36 | 4.82 | 2.25 |
| Acetazolamide | 33 | 11.47 | 1.29 | 3.99 | 2.12 |
| Non-Study Eye | ONH Volume (mm3) | Disc Area (mm2) | |||
| n | mean | sd | mean | sd | |
| Baseline | 117 | 15.63 | 3.46 | 10.87 | 4.79 |
| Placebo | 59 | 15.50 | 3.34 | 10.96 | 4.57 |
| Acetazolamide | 58 | 15.77 | 3.60 | 10.78 | 5.05 |
| 6 months | 84 | 12.39 | 1.75 | 6.18 | 3.31 |
| Placebo | 39 | 13.23* | 2.07 | 7.52* | 3.83 |
| Acetazolamide | 45 | 11.67* | 0.96 | 5.02* | 2.24 |
| 12 months | 66 | 11.69 | 1.27 | 4.16 | 2.21 |
| Post-Placebo | 33 | 11.87 | 1.32 | 4.36 | 2.26 |
| Acetazolamide | 33 | 11.51 | 1.22 | 3.96 | 2.17 |
Correlation Between Optic Nerve Head Volume and Disc Area
The treatment groups were combined for an analysis of the relationship between optic nerve head volume and disc area using Pearson correlation coefficients (Figure 1). There was a strong positive correlation between ONH volume and disc area for both study eyes and non-study eyes at baseline, 6 months, and 12 months (p<0.001 for all Pearson correlation coefficients). The correlation was strongest at baseline in both study and non-study eyes (R2=0.77 and 0.77, respectively). The correlation was less strong at 6 months (R2 = 0.68 and 0.66), and weakest but still significant at 12 months (R2= 0.42 and 0.47).
Figure 1.
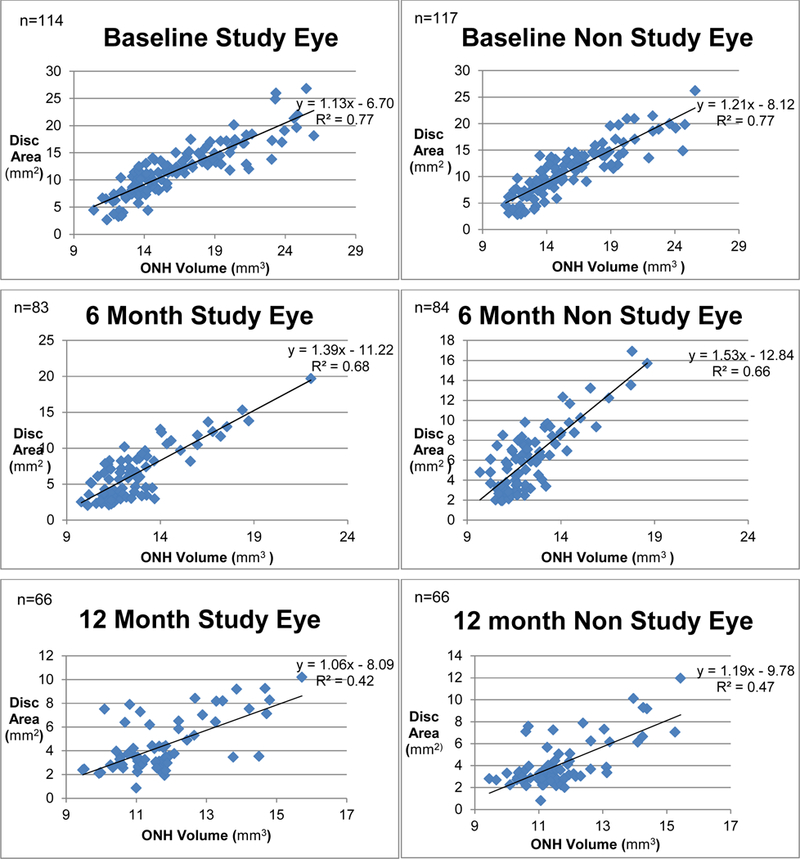
Disc Area and Volume Correlations in Subjects with Idiopathic Intracranial Hypertension. Correlation between disc area and ONH volume at baseline, 6 months, and 12 months in both study eyes and non-study eyes, independent of treatment group assignment. The correlation between area and volume was strongest at baseline, but remained positive and significant throughout the follow-up period (p<0.001 for all Pearson correlation coefficients).
Impact of Treatment Group on Relationship Between ONH Volume and Disc Area
At baseline, the correlation between ONH volume and disc area was similar in the placebo group and the acetazolamide group. In study eyes, R2 was 0.80 in the placebo group and 0.75 in the acetazolamide group. In non-study eyes, R2 was 0.78 in the placebo group and 0.77 in the acetazolamide group. Figure 2 demonstrates the divergence in the relationship between ONH volume and disc area for eyes in the placebo group compared with eyes in the acetazolamide group at 6 months, and the post-placebo and acetazolamide groups at 12 months. At 6 months, in both study eyes and non-study eyes, the correlation between ONH volume and disc area was weaker in the acetazolamide group (R2=0.25, 0.21) when compared to the placebo group (R2=0.76, 0.77). Similarly, at 12 months, in both study eyes and non-study eyes, the correlation between ONH volume and disc area was again weaker in the acetazolamide group (R2=0.19, 0.32) compared to the post-placebo group (R2= 0.65, 0.63).
Figure 2.
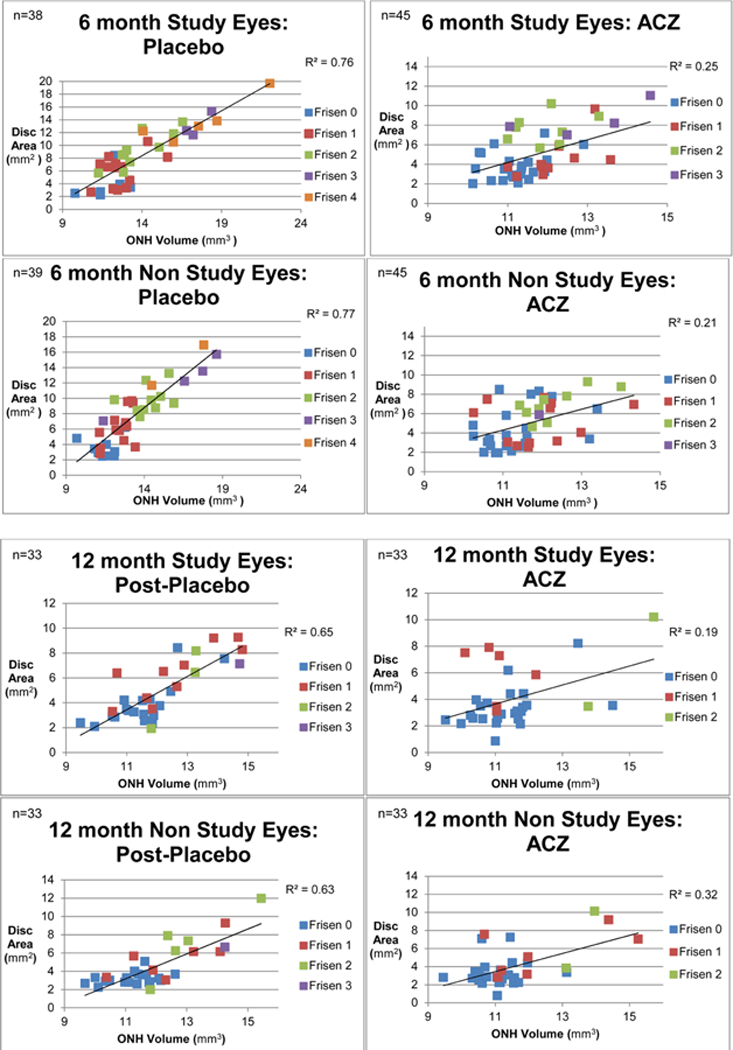
Disc Area and Volume Correlations in Subjects Receiving Acetazolamide Versus Placebo with Idiopathic Intracranial Hypertension. Among the placebo group at 6 months, there remained a strong positive correlation between disc area and ONH volume (R2=0.76, 0.77 in study and non-study eyes, respectively), and Frisén score appeared to correlate with these morphometric features. However, in the acetazolamide group, there was poor correlation between disc area and ONH volume (R2=0.25, 0.21 in study and non-study eyes, respectively), and Frisén score appeared to correlate weakly with these morphometric features. At 12 months, there was again a stronger correlation between ONH volume, disc areas, and Frisén score in the post-placebo group (R2= 0.65, 0.63) when compared to the acetazolamide group (R2= 0.19, 0.32).
Analyses of baseline, 6 month and 12 month data were repeated including only the 66 subjects for whom 12 month data was available in order to provide a longitudinal analysis. The same relationships held true; at baseline, in study eyes, R2 was 0.84 in the placebo group and 0.71 in the acetazolamide group. In non-study eyes, R2 was 0.80 in the placebo group and 0.74 in the acetazolamide group. At 6 months, in both study eyes and non-study eyes, the correlation between ONH volume and disc area was weaker in the acetazolamide group (R2=0.06, 0.16) compared to the placebo group (R2=0.86, 0.78). Tables depicting the analyses from this cohort are provided as Supplemental Material at AJO.com.
Relationship of ONH Volume and Disc Area to Frisén Score
The relationship of ONH volume and disc area to Frisén score in the treatment groups at 6 and 12 months is depicted using the color-coded scheme in Figure 2. At 6 months, in the placebo group, in both study eyes and non-study eyes, Frisén score appears to increase linearly with disc area and ONH volume. There is a clustering of lower Frisén scores at smaller disc areas and ONH volumes and higher Frisén scores at greater disc areas and ONH volumes. However, in the acetazolamide group, there appears to be no consistent relationship between Frisén score, disc areas and ONH volumes. At 12 months, in both the post-placebo and acetazolamide subgroups, there does not appear to be a consistent relationship between Frisén score, disc area and ONH volumes. The relationship between Frisén score, disc area, ONH volume, and treatment group is further examined in Figure 3. In the placebo group at 6 months, both disc area and ONH volume increase in a positive linear relationship with Frisén score. However, in the acetazolamide group eyes, there is a weaker relationship between disc area and Frisén score, and ONH volume does not increase in a linear relationship to Frisén score. At 12 months, ONH volumes and disc areas do not increase in a linear relationship to Frisén Score in either treatment group.
Figure 3.
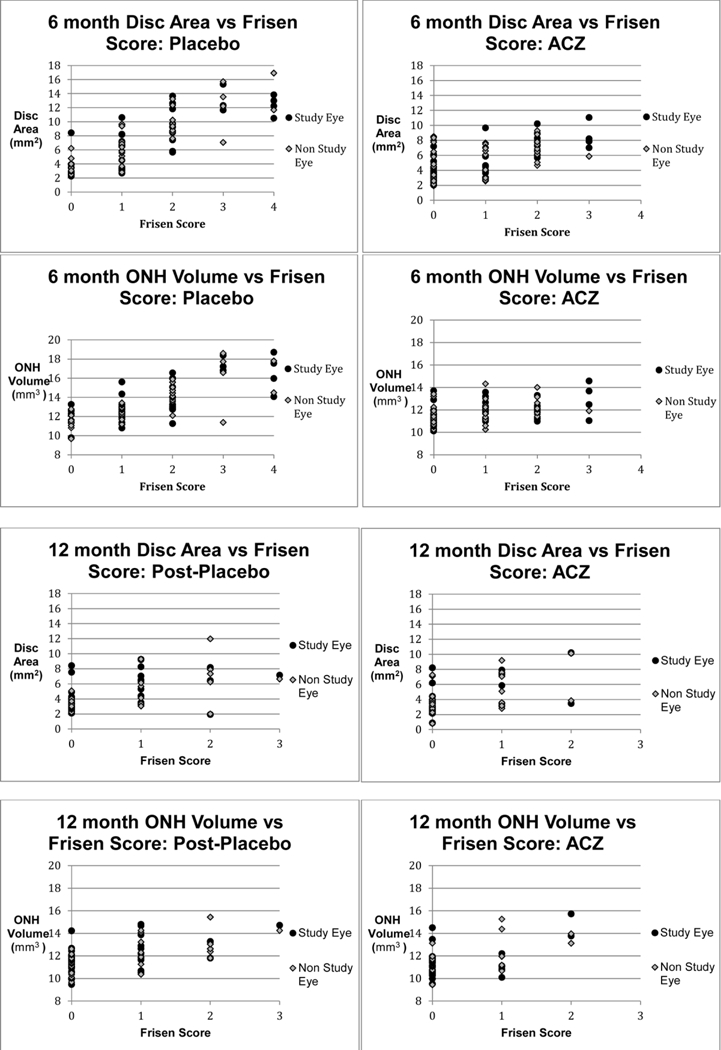
Relationship Between Frisén Score, Disc Area and Volume in Subjects Receiving Acetazolamide Versus Placebo with Idiopathic Intracranial Hypertension. Both study eyes and non-study eyes are included in each graph. In the placebo group at 6 months, eyes graded with higher Frisén scores had greater disc areas and ONH volumes. However, this relationship is weaker in the acetazolamide group at 6 months. At 12-months, there appears to be no clear association between Frisén score, ONH volume, and disc area in both the post-placebo and acetazolamide groups.
DISCUSSION
While the Frisén score is the primary clinical tool used to assess papilledema in patients with IIH, its shortcomings include inter-observer variability and poor sensitivity to small changes in papilledema in part due to its ordinal nature.6 Previous studies have shown that measurements of papilledema using newer technologies including OCT and fundus photography reliably correlate with Frisén score in patients newly diagnosed with IIH. However, how these assessments of disc area and OCT volume relate to one another, and how their relationship to Frisén score changes as the disease evolves, had not been evaluated until now. Our study confirms that while, overall, photographic disc area correlated with ONH volume by OCT over time, this relationship was driven by a strong positive correlation among placebo-treated eyes. In contrast, eyes in subjects treated with acetazolamide had a weak correlation between disc area and volume of ONH swelling. Furthermore, while Frisén score correlated linearly to disc area and volume in eyes of placebo group subjects, the eyes of subjects treated with acetazolamide did not demonstrate a consistent relationship between Frisén score, disc areas and ONH volumes.
Although OCT is commonly used in clinical practice to evaluate thinning of the retinal nerve fiber layer (RNFL) due to optic nerve injury from a variety of causes, using OCT to quantify papilledema is relatively new.7 Studies have shown that the current algorithms employed by commercially available OCT may be useful for quantifying papilledema through measurement of RNFL swelling or total retinal thickness, but only at lower degrees of papilledema.7,9 To quantify more severe degrees of papilledema, researchers have investigated novel three-dimensional segmentation analysis which may provide reliable continuous measurements of optic nerve head volume and other structural alterations of the nerve and peripapillary retina.9,14 Standardized stereo fundus photographs have also been investigated as a low cost, reliable alternative to assess papilledema.8,15 Our study found that while OCT ONH volume and photographic disc areas correlate at baseline, the correlation diverges over the follow up period, conditional on the treatment status of the patient. The correlation between disc area and volume was markedly weaker in the acetazolamide group, both at 6 months and 12 months after diagnosis, when compared to placebo and post-placebo groups. The mechanisms through which treatment with acetazolamide leads to a breakdown in correlation between disc area and optic nerve head volume are not known. Previous analyses have shown that the majority of improvement in OCT measurements of papilledema effected by acetazolamide occurs within the first 3 months of treatment.10 By contrast, treatment with placebo leads to a slower, more gradual resolution of papilledema.10 Perhaps the more rapid resolution of papilledema induces structural changes in the optic disc and peripapillary retina, through mechanisms such as nerve gliosis, atrophy, or, more likely, fluid shifts between the intra and extra axonal spaces. These changes may account for the dissociation between area and volume seen in the acetazolamide group.
Our results at 12 months follow up also suggest that the timing of treatment with acetazolamide influences the relationship between volume and area. Although a majority of subjects in the placebo group were transitioned to open label acetazolamide at 6 months, the correlation between disc area and volume remained stronger in the post-placebo group compared to the acetazolamide group at 12 months. As previously reported, acetazolamide maximally reduces quantitative measurements of papilledema including ONH volume, RNFL thickness and total retinal thickness during the first three months after initiation of treatment, with diminishing improvements after the first three months.10 Furthermore, treatment with placebo and weight loss alone has been shown to result in some improvement in OCT measurements of papilledema between baseline and 6 months.10 Our findings indicate that delayed initiation of acetazolamide until 6 months after diagnosis, when some resolution of papilledema has already occurred, appears to disturb the positive linear area-volume association less than does early treatment with acetazolamide.
Previous studies of the IIHTT data have shown Frisén score to be highly correlated with both disc area and ONH volume at time of initial diagnosis with IIH.8,12 However, the strength of this relationship has been shown to decrease with time. The OCT substudy committee of the IIHTT previously found only moderate correlations between OCT measures and Frisén score at 6 months, in contrast to the strong correlations at baseline.10 Our analyses suggest that the weak correlation between Frisén score and OCT volume among eyes treated with acetazolamide may account for the diminished overall correlation in all eyes at 6 months. In support of this suggestion, among subjects treated with weight loss and placebo alone, we found a robust correlation between Frisén score, ONH volume and area at 6 months, with a clustering of low Frisén scores at lower disc areas and volumes. By contrast, among acetazolamide treated eyes, Frisén scores corresponded only modestly to disc areas, and corresponded even less to ONH volume. For example, in our analysis at 6 months, eyes scored as a Frisén 1, 2, or 3 demonstrated no difference in the volume of ONH swelling. These findings indicate that the qualitative characteristics of the disc reflected in Frisén score do not correlate well with quantitative assessments of papilledema in eyes of subjects treated with acetazolamide.
Limitations
Our results should be interpreted in light of several limitations. First, not all subjects recruited into the IIHTT were evaluated by OCT, so there may have been inadvertent sampling bias. Second, as previously reported, 58% of subjects remained in the study at 12 months.13 The characteristics of these subjects were comparable to those who remained in the study with regards to baseline demographics, neuro-ophthalmologic and vision related characteristics, and the reasons for dropping out were similar in the acetazolamide and placebo/post-placebo groups.13 Therefore, we expect little effect of excluding those patients on our analysis. Finally, at 6 months, the majority of subjects in the placebo group were transitioned to acetazolamide, and as such were renamed the post-placebo group. Therefore, our 12-month analysis does not benefit from comparison of treatment with acetazolamide to a true control group representing the natural history of IIH.
Implications
There are several implications of these findings. First, as Frisén score fails to reflect quantitative measures of disc swelling including disc area and volume after early treatment with acetazolamide, clinicians should use caution when using Frisén scoring to monitor the effect of treatment on papilledema over time. As an alternative, clinicians may consider using a continuous, quantitative assessment such as OCT to monitor response to treatment; regardless, they should continue to measure visual function through serial visual field assessments. Additionally, our findings suggest that the volume of papilledema may not be readily predicted from two-dimensional disc photographs in pharmacologically treated eyes, which complicates efforts to estimate ONH shape from fundus photography in telemedicine settings.15 Finally, there is uncertainty as to whether the morphologic (ie, Frisén score) or morphometric (ie, disc volume and area) characteristics of papilledema are most clinically meaningful. We are hopeful that future studies will identify both the quantitative and qualitative features of papilledema that are most closely associated with visual field deficits and prognosis. In particular, the upcoming Surgical IIH Trial (SIGHT) will be an opportunity to examine the impact of surgical therapy on optic disc shape and visual function.
Conclusion
There is a strong positive correlation between volume of optic nerve head swelling and disc area in untreated patients newly diagnosed with IIH. However, eyes treated pharmacologically with acetazolamide showed a markedly diminished correlation between area and volume of disc swelling. Frisén score correlated well with disc area and volume in eyes treated with placebo and weight loss alone, but eyes treated with acetazolamide had no consistent relationship between Frisén score, disc area and volume during follow up. These findings suggest that Frisén score fails to reflect quantitative changes in the degree of papilledema in patients pharmacologically treated for IIH.
Supplementary Material
ACKNOWLEDGMENTS
a) Funding/Support: National Institutes of Health Grants 1U10EY017281–01A1 (NORDIC), 1U10EY017387–01A1 (Data Coordination and Biostatistics Center), 3U10EY017281–01A1S1 (American Recovery and Reinvestment Act for NORDIC), 1U10EY017387–01A1S1 (Data Coordination and Biostatistics Center), and 3U10EY017281–01A1S2 (supplements for NORDIC), and in part by an unrestricted grant from Research to Prevent Blindness, New York, New York to the Department of Ophthalmology at the University of Rochester.
b) Financial Disclosures: CRS: no financial disclosures; WSF: no financial disclosures; RAH: no financial disclosures; LMB: no financial disclosures; SEF: consultant to Association of University Professors of Ophthalmology, Trustee of Doheny Eye Institute
c) Other acknowledgements: The authors thank Dr. Mark Kupersmith (Icahn School of Medicine at Mount Sinai) for his review of the manuscript. See the appendix for the members of the NORDIC Idiopathic Intracranial Hypertension Study Group.
Footnotes
Publisher's Disclaimer: This is a PDF file of an unedited manuscript that has been accepted for publication. As a service to our customers we are providing this early version of the manuscript. The manuscript will undergo copyediting, typesetting, and review of the resulting proof before it is published in its final citable form. Please note that during the production process errors may be discovered which could affect the content, and all legal disclaimers that apply to the journal pertain.
Contributor Information
Catherine R Sheils, University of Rochester School of Medicine & Dentistry, Department of Ophthalmology, David & Ilene Flaum Eye Institute, Rochester, NY.
William S Fischer, University of Rochester School of Medicine & Dentistry, Department of Ophthalmology, David & Ilene Flaum Eye Institute, Rochester, NY.
Rachel A Hollar, University of Rochester School of Medicine & Dentistry, Department of Ophthalmology, David & Ilene Flaum Eye Institute, Rochester, NY.
Lisa M Blanchard, University of Rochester School of Medicine & Dentistry, Department of Ophthalmology, David & Ilene Flaum Eye Institute, Rochester, NY.
Steven E Feldon, University of Rochester School of Medicine & Dentistry, Department of Ophthalmology, David & Ilene Flaum Eye Institute, Rochester, NYthe NORDIC Idiopathic Intracranial Hypertension Study Group.
REFERENCES
- 1.Dandy WE. Intracranial Pressure Without Brain Tumor: Diagnosis and Treatment. Ann Surg 1937;106(4):492–513. [DOI] [PMC free article] [PubMed] [Google Scholar]
- 2.Friedman DI, Jacobson DM. Diagnostic criteria for idiopathic intracranial hypertension. Neurology 2002;59(10):1492–1495. [DOI] [PubMed] [Google Scholar]
- 3.Smith JL. Whence pseudotumor cerebri? J Clin Neuroophthalmol 1985;5(1):55–56. [PubMed] [Google Scholar]
- 4.Wall M, George D. Idiopathic intracranial hypertension. A prospective study of 50 patients. Brain 1991;114 ( Pt 1A):155–180. [PubMed] [Google Scholar]
- 5.Frisen L Swelling of the optic nerve head: a staging scheme. J Neurol Neurosurg Psychiatry 1982;45(1):13–18. [DOI] [PMC free article] [PubMed] [Google Scholar]
- 6.Sinclair AJ, Burdon MA, Nightingale PG, et al. Rating papilloedema: an evaluation of the Frisen classification in idiopathic intracranial hypertension. J Neurol 2012;259(7):1406–1412. [DOI] [PubMed] [Google Scholar]
- 7.Scott CJ, Kardon RH, Lee AG, Frisen L, Wall M. Diagnosis and grading of papilledema in patients with raised intracranial pressure using optical coherence tomography vs clinical expert assessment using a clinical staging scale. Arch Ophthalmol 2010;128(6):705–711. [DOI] [PubMed] [Google Scholar]
- 8.Fischer WS, Wall M, McDermott MP, Kupersmith MJ, Feldon SE. Photographic Reading Center of the Idiopathic Intracranial Hypertension Treatment Trial (IIHTT): Methods and Baseline Results. Invest Ophthalmol Vis Sci 2015;56(5):3292–3303. [DOI] [PMC free article] [PubMed] [Google Scholar]
- 9.O. C. T. Sub-Study Committee for NORDIC Idiopathic Intracranial Hypertension Study Group, Auinger P, Durbin M, et al. Baseline OCT measurements in the idiopathic intracranial hypertension treatment trial, part I: quality control, comparisons, and variability. Invest Ophthalmol Vis Sci 2014;55(12):8180–8188. [DOI] [PMC free article] [PubMed] [Google Scholar]
- 10.The Optical Coherence Tomography Substudy Committee and the NORDIC Idiopathic Intracranial Hypertension Study Group. Papilledema Outcomes from the Optical Coherence Tomography Substudy of the Idiopathic Intracranial Hypertension Treatment Trial. Ophthalmology 2015;122(9):1939–1945.e1932. [DOI] [PMC free article] [PubMed] [Google Scholar]
- 11.Nordic Idiopathic Intracranial Hypertension Study Group Writing Committee, Wall M, McDermott MP, et al. Effect of acetazolamide on visual function in patients with idiopathic intracranial hypertension and mild visual loss: the idiopathic intracranial hypertension treatment trial. JAMA 2014;311(16):1641–1651. [DOI] [PMC free article] [PubMed] [Google Scholar]
- 12.Sub-Study OCT Committee for NORDIC Idiopathic Intracranial Hypertension Study Group, Auinger P, Durbin M, et al. Baseline OCT measurements in the idiopathic intracranial hypertension treatment trial, part II: correlations and relationship to clinical features. Invest Ophthalmol Vis Sci 2014;55(12):8173–8179. [DOI] [PMC free article] [PubMed] [Google Scholar]
- 13.Wall M, Kupersmith MJ, Thurtell MJ, et al. The Longitudinal Idiopathic Intracranial Hypertension Trial: Outcomes From Months 6–12. Am J Ophthalmol 2017;176:102–107. [DOI] [PMC free article] [PubMed] [Google Scholar]
- 14.Wang JK, Kardon RH, Kupersmith MJ, Garvin MK. Automated quantification of volumetric optic disc swelling in papilledema using spectral-domain optical coherence tomography. Invest Ophthalmol Vis Sci 2012;53(7):4069–4075. [DOI] [PMC free article] [PubMed] [Google Scholar]
- 15.Tang L, Kardon RH, Wang JK, Garvin MK, Lee K, Abramoff MD. Quantitative evaluation of papilledema from stereoscopic color fundus photographs. Invest Ophthalmol Vis Sci 2012;53(8):4490–4497. [DOI] [PMC free article] [PubMed] [Google Scholar]
Associated Data
This section collects any data citations, data availability statements, or supplementary materials included in this article.