Abstract
Background and aim
Ursodeoxycholic acid (UDCA) is used to treat biliary disorders; and, bile acids alter mast cell (MC) histamine release. MCs infiltrate Mdr2−/− mice liver (model of Primary Sclerosing Cholangitis (PSC)). MC-derived histamine increases inflammation, hepatic stellate cell (HSC) activation and fibrosis. The objective was to determine the effects of UDCA treatment on MC infiltration, biliary damage, inflammation and fibrosis in Mdr2−/− mice and human PSC.
Design
Wild-type and Mdr2−/− mice were fed bile acid control diet or UDCA (0.5% wt/wt). Human samples were collected from control and PSC patients treated with placebo or UDCA (15mg/Kg/BW). MC infiltration was measured by immunhistochemistry and qPCR for c-Kit, chymase and tryptase. The HDC/histamine/HR axis was evaluated by EIA and qPCR. Intrahepatic bile duct mass (IBDM) and biliary proliferation was evaluated by CK-19 and Ki67 staining. Fibrosis was detected by immunostaining and qPCR for fibrotic markers. Inflammatory components were measured by qPCR. HSC activation was measured by SYP-9 staining. Inflammation was detected by qPCR for CD68. In vitro, MCs were treated with UDCA (40 μM) prior to HA secretion evaluation and coculturing with cholangiocytes or HSCs. BrDU incorporation and fibrosis by qPCR was performed.
Results
UDCA reduced MC number, the HDC/histamine/HR axis, IBDM, HSC activation, inflammation, and fibrosis in Mdr2−/− mice and PSC patients. In vitro, UDCA decreases MC-histamine release, which was restored by blocking ASBT and FXRβ. Proliferation and fibrosis decreased after treatment with UDCA-treated MCs.
Conclusion
UDCA acts on MCs reducing histamine levels and decreases the inflammatory/hyperplastic/fibrotic reaction seen in PSC.
Keywords: mast cells, fibrosis, UDCA, PSC
Introduction
Primary Sclerosing Cholangitis (PSC) is a chronic cholestatic disease that damages bile ducts inside and outside the liver. During PSC, bile ducts are inflamed, which leads to scarring and narrowing resulting in fibrosis and cirrhosis of the liver and, eventually, liver failure1. The only definitive treatment to date is liver transplantation1,2. Multidrug resistance-2 gene knockout mice (Mdr2−/−) develop spontaneous liver fibrosis and mimic some features of human PSC3,4. Mdr2−/− mice have enhanced intrahepatic bile duct mass (IBDM), biliary proliferation and hepatic fibrosis between 4 and 12 weeks of age4,5.
Within mast cells are intact granules that carry inflammatory mediators like histamine and various cytokines and chemokines6–8. Mast cells infiltrate the liver upon damage, surround bile ducts increasing local histamine levels and enhance biliary mass, proliferation and hepatic fibrosis5,9. In our previous work, we demonstrated that, in bile duct ligated (BDL) rats and Mdr2−/− mice treated with the mast cell stabilizer, cromolyn sodium, there is reduced biliary damage and liver fibrosis5,9. In mast cell-deficient mice, IBDM and hepatic fibrosis are reduced following BDL compared to WT BDL mice10. In addition, when mast cell-deficient mice were injected with cultured mast cells, these parameters increased demonstrating that mast cells regulate biliary injury and hepatic fibrosis10.
Ursodeoxycholic acid (UDCA) is a natural bile acid that forms about 1-3% of total bile acids in human bile11. To date, UDCA (13 - 15 mg/kg/day) is the choice treatment for Primary Biliary Cholangitis (PBC) patients that have abnormal liver enzymes; however, the role of UDCA in PSC has remained elusive and conflicting11. In fact, at high doses (28 - 30 mg/kg/day) UDCA can be harmful to PSC patients and studies to demonstrate effectiveness at lower doses are inconclusive1. UDCA exerts its anticholestatic effects by lowering serum liver enzymes, improving histology and increasing non-toxic bile acid pools, thus delaying the progression to liver transplant2,12,13. UDCA has been shown to regulate inflammatory cytokine release during cholestatic liver injury 14. According to the 2009 European Association for the Study of Liver Disease (EASL), UDCA is an approved therapy for PSC patients and numerous patients are prescribed UDCA to ameliorate uncomfortable side effects15. The purpose of our study is to understand if UDCA acts on mast cells or induces a synergistic interaction between mast cells, cholangiocytes and hepatic stellate cells. Since it is unknown if UDCA interacts with mast cells to alter PSC progression, we aimed to studied these parameters in both Mdr2−/− mice and human PSC.
Method and Materials
Reagents and other materials
Chemical grade reagents were purchased from Sigma-Aldrich Co (St. Louis, MO) unless stated otherwise. All mouse and human primers and real-time PCR materials were obtained from Qiagen (Fredrick, MD). Antibodies for immunohistochemistry and immunofluorescence were purchased from Abcam (Cambridge, MA) or Santa Cruz (Dallas, TX). Histamine EIA kits were purchased from Cayman Chemical (An Arbor, MI)5,9,10. The apical sodium-bile acid transporter (ASBT) inhibitor was obtained from Tocris Bioscience (Minneapolis, MN) and the farnesoid X receptor (FXRβ) inhibitor was obtained from Sigma-Aldrich Co (St. Louis, MO). Kits to measure total bile acids (TBAs) were purchased from Crystal Chemical, Inc (Downers Grove, IL) 5.
In vivo models
We used the genetically modified mouse model of PSC, Mdr2−/− mice on FVB/NJ background (wild-type, WT)3,5. All mice were housed in the Baylor Scott and White Health Animal Facility and given free access to drinking water and standard chow. All animals were kept in a temperature-controlled environment with a 12:12 light/dark cycle, and all protocols strictly adhered to regulations as set forth by the local IACUC committee. Male mice (9-11 weeks of age) were fed a bile acid control diet (BAC, which contains the same components as the UDCA chow minus the bile acids)- or UDCA- enriched diet (0.5% wt/wt)16 for one week (10-12 mice per group). Diets were obtained from Dyets, Inc (Bethlehem, PA) and from all animals we collected serum, isolated cholangiocytes (as previously described5,10,17) and supernatants (collected after 4-6 hours of incubation at 37°5,9,10) and liver blocks (frozen and paraffin-embedded). We performed hematoxylin and eosin (H&E) staining in livers to evaluate lobular damage, hepatic necrosis and inflammation. TBAs were measured in serum and/or snap liver as previously described5.
Human PSC sampling
Human liver sections from normal controls (collected as part of liver cholangiocarcinoma resection and considered non-diseased areas) and PSC patients treated with placebo or UDCA (15mg/kg/BW) were utilized (Supplemental Table 1). PSC patients presented with a range of early to late PSC as described in our previous work5. Liver sections (4-5 μm thick) obtained by needle biopsies from three control patients, three early stage PSC (with or without cirrhosis) and three early stage PSC patients treated with UDCA (with or without cirrhosis). The de-identified samples were provided by Dr. Pietro Invernizzi under a protocol approved by Humanitas Research Hospital; the protocol was approved by the Central Texas Veteran’s Health Care System Institutional Review Board and Research Development Committee. Using acquired human tissue, H&E was performed to assess liver damage that was evaluated by a blinded pathologist; patient serum ALT levels were assessed via colorimetric analysis with an AbCam ALT kit (ab105134).
Detection of mast cells, mast cell markers, histamine receptors and histamine secretion
In all mice, mast cell presence was detected by immunohistochemistry in liver sections (4-5 μM thick) for mouse mast cell protease-1 (mMCP-1) and mast cell markers were measured in total liver by real-time PCR9,18. The HDC/HR/HA axis was measured by real-time PCR and by EIA from all groups of mice17. We measured mast cell number by toluidine blue staining in liver from normal rats fed either taurocholate (TC) or taurolithocholate (TLC)19,20 and in BDL rats fed UDCA21.
We measured the expression of mast cell presence by immunohistochemistry for tryptase in human liver sections from control and PSC patients treated with placebo or UDCA. The gene expression of mast cell markers was also measured in these livers. H1-H4HR expression was measured by real-time PCR and histamine secretion was evaluated by EIA in serum from all patient groups.
Evaluation of biliary damage in Mdr2−/− mice and hepatic fibrosis/HSC activation in mice and human PSC
In liver sections from all mice, we performed immunohistochemistry for the biliary marker, CK-199,17 to measure IBDM and Ki-675 to detect the percentage of proliferating cholangiocytes as previously described by us. We measured fibrosis and HSC activation from all mice and human tissues as previously described by us5,9,10.
Fibrosis was assessed by Masson’s Trichrome and Fast Green/Sirius Red (along with semi-quantification)17. In total liver, we measured the following fibrotic markers by real-time PCR: collagen type-1a and fibronectin-117. TGF-β1 is a known regulator of HSC-driven fibrosis5,13; therefore, we measured TGF-β1 expression by real-time PCR in all groups of mice. To evaluate HSC activation, synaptophysin 9 (SYP-9) was measured by immunofluorescence in all mice groups co-stained with CK-19 to detect bile ducts5,10. In human tissues, we measured the gene expression of fibronectin-122,23 and performed Masson’s Trichrome.
Measurement of the effects of UDCA treatment on inflammation and extracellular matrix proteins
We measured CD68 in our mouse tissues as an indicator of inflammatory response by real-time PCR. TNF-α is released from degranulated mast cells18; therefore, we evaluated the expression of TNF-α in total liver from all mice by real-time PCR. We measured MMP-2, -3 and -9 by real-time PCR in total liver from WT, Mdr2−/− + BAC and Mdr2−/− + UDCA.
In vitro evaluation of mast cell/cholangiocyte/HSC interactions
To determine the direct effects of UDCA on (i) mast cell-derived histamine release and (ii) biliary and HSC response, we utilized cultured mast cells, cholangiocytes, and human HSCs (hHSCs).
Cultured mast cells were obtained from ATCC (Manassas, VA) and human HSCs from ScienCell, Carlsbad, CA. Murine cholangiocytes have previously been used by us and all cells were cultured according to previous protocols5,9,10,17.
To determine how bile acids interact with mast cells, we measured the expression of ASBT and FXRβ by immunofluorescence in cultured mast cells. The ASBT antibody was a kind gift from Dr. Paul Dawson (Emory University School of Medicine) and FXRβ antibodies were purchased from Santa Cruz Biotechnology (Dallas, TX).
To demonstrate that bile acid treatment alters mast cell histamine release, mast cells were treated with UDCA (40 μM, 30 - 120 minutes) in the absence or presence of specific antagonists, guggulsterone (FXRβ inhibitor, 10 μM) and SC-435 (ASBT inhibitor, 100 nM) and histamine release was measured by EIA10. In separate experiments, mast cells were treated with different bile acids including TC (40 μM, 24 hrs) and TLC (40 μM, 24 hrs) as well as UDCA (40 μM, 120 minutes); mast cell activation, MMP-2, -3, and -9 and TNF-α levels were evaluated by real-time PCR.
Next, cultured cholangiocytes or hHSCs were treated with 0.1% BSA (basal), mast cell supernatants (basal treated) and mast cell supernatants collected following treatment with UDCA (40 μM, 120 min). Biliary proliferation was evaluated by BrDU staining and fibronectin-1 was measured by real-time PCR in treated HSCs5,10. Biliary inflammation was measured by real-time PCR in treated cells for TNF-α, CCL-3 and IL-6.
In our final experiments, hHSCs were treated with 0.1% BSA (basal) or cholangiocyte supernatants collected from WT, Mdr2−/− + BAC and Mdr2−/− mice treated with UDCA. Following stimulation for 24 hours, the expression of fibrosis markers including, TGF-β1, collagen type-1a and fibronectin-1 were evaluated by real-time PCR.
Statistical Methods
All data is expressed as mean ± SEM. Groups were analyzed by the Student unpaired t test when two groups are analyzed or a two-way ANOVA when more than two groups are analyzed, followed by an appropriate post hoc test. p<0.05 was considered significant.
Results
UDCA feeding ameliorates liver injury in Mdr2−/− mice and human PSC
Extensive inflammation was found around bile ducts, which was ameliorated in Mdr2−/− mice fed UDCA, which were similar to WT (Figure 1A). In Mdr2−/− mice fed UDCA, total bile acid serum content decreased (Figure 1B). According to pathology reports, the WT mouse liver has no significant histopathological findings; however the Mdr2−/− mouse fed BAC displays moderate to severe cholangitis with prominent duct obliteration and bridging fibrosis that is consistent with human PSC. Some bridging fibrosis and inactive hepatitis was also noted in the Mdr2−/− mouse fed BAC. Finally, in the Mdr2−/− mouse fed UDCA mild portal inflammation was detected along with minimal bridging fibrosis and mild cholangitis.
Figure 1.
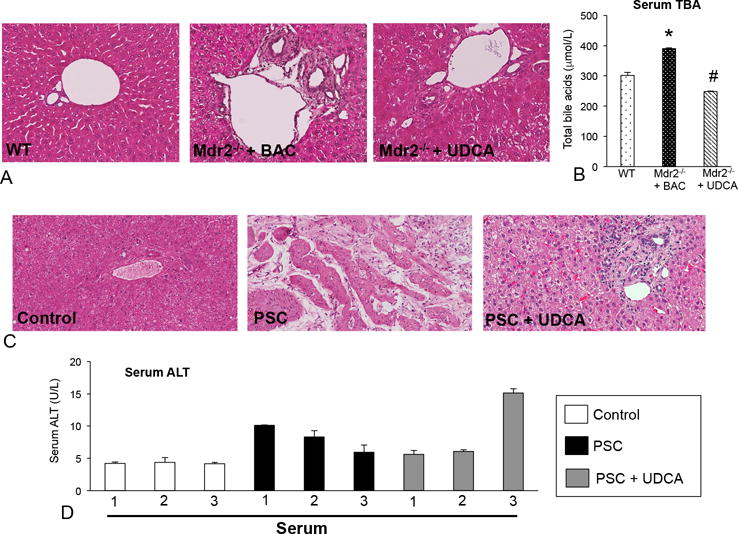
(A) Mdr2−/− mice fed BAC displayed increased portal area damage including inflammation, necrosis and increased ductular reaction compared to WT mice. (B) Total bile acids (TBAs) were increased in serum in Mdr2−/− mice fed BAC compared to WT and feeding with UDCA decreased TBAs in serum. (C) H&E in human biopsies reveal increased inflammation and necrosis in PSC patients compared to control, which are reduced in PSC patients treated with UDCA. (D) Serum ALT levels are increased in patients with PSC compared to control and ALT levels are decreased in two patients treated with UDCA. Data are expressed as mean ± SEM of at least 8 experiments for TBA. *p<0.05 versus WT mice; #p<0.05 versus Mdr2−/− mice fed BAC. Images are 20× magnification.
In human PSC, focal necrosis and inflammation increased compared to controls, which were decreased in PSC patients treated with UDCA (Figure 1C). Further, serum ALT levels increased in PSC patients compared to controls and several patients treated with UDCA had decreased ALT levels, although not all patients responded to UDCA (Figure 1D). For H&E staining, the pathology reports indicate that there is mild steatohepatitis with limited fibrosis in the human control sample, whereas the PSC liver displays bile duct sclerosing cholangitis with bridging fibrosis and potential bile duct obstruction. The PSC patient treated with UDCA also displays mild sclerosing cholangitis; however, no evidence of obstruction was noted.
To correlate our findings with human dosing, we estimate that mice consumed a relative dose of 20 - 23mg/kg BW per day. This calculation was based on the amount of UDCA in the diet, average weight of the mice, and average chow consumed per day. As stated, normal/low dose treatment is indicated at 13-15mg/kg BW per day and higher doses are 28-30mg/kg BW per day. Therefore, we are slightly over the range of the lower human dose, but we also recognize that there are multiple considerations that might alter our calculations including changes in appetite, which would influence the intake of the mouse.
UDCA treatment decreases mast cell presence/activation and inhibits the HDC/histamine/HR axis in Mdr2−/− mice and human PSC
In Mdr2−/− mice, increased numbers of mast cells (marked by red arrows) are found in close proximity to bile ducts. Further, UDCA treatment decreased mast cell number (Figure 2A). Semi-quantification of the average number of mast cells is also shown. c-Kit, chymase and tryptase decreased in Mdr2−/− mice fed UDCA (Supplemental Figure 2A). In contrast, TC and TLC feeding increased mast cell number (marked by red arrows) in normal rats; whereas UDCA decreased mast cell number in rats subjected to BDL (Supplemental Figure 1A).
Figure 2.
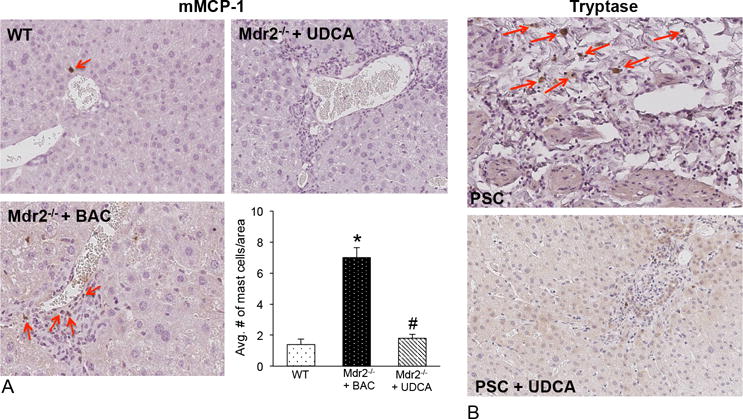
(A) Mast cell numbers are increased in Mdr2−/− mice fed BAC compared to WT and UDCA feeding decreases the presence of mast cells shown by immunohistochemistry for mMCP-1 (marked by red arrows). Semi-quantification demonstrates a significant increase in mast cell number in Mdr2−/− mice fed BAC that is reduced in Mdr2−/− mice fed UDCA. (B) By immunohistochemistry for tryptase there is an infiltration of mast cells found surrounding bile ducts in PSC patients treated with placebo compared to normal tissue that were void of mast cells (data not shown). In PSC patients treated with UDCA there were no visible mast cells surrounding the ducts. Images are 20× magnification.
Patients with advanced PSC display a robust infiltration of mast cells (marked by red arrows) compared to control (similar to our previous work no mast cells were detected in control5, data not shown) and, in patients with PSC treated with UDCA, there is a marked decrease in mast cell presence (Figure 2B). There is an upregulation of mast cell markers in livers from PSC patients treated with placebo, which are decreased in PSC patients treated with UDCA (Supplemental Figure 1B).
In Mdr2−/− mice fed UDCA, the HDC/HR/HA axis decreases (Figure 3A and 4B). The expression of H1-H4HR was upregulated in patients with PSC and treatment with UDCA decreased H2, H3 and H4HR (Figure 3C). We found increased serum histamine levels in PSC patients, whereas UDCA-treated PSC patients had reduced histamine levels (Figure 3D).
Figure 3.
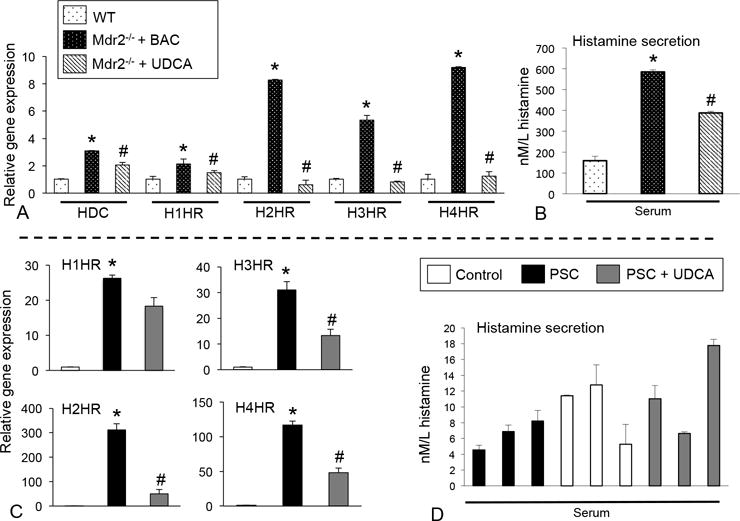
(A) HDC, H1-H4HR expression increased in Mdr2−/− mice fed BAC compared to WT, whereas Mdr2−/− mice fed UDCA had decreased levels compared to Mdr2−/− mice fed BAC. (B) Histamine secretion significantly increased in Mdr2−/− mice fed BAC and secretion diminished in Mdr2−/− mice fed UDCA compared to BAC fed Mdr2−/− mice. (C) In human patients with PSC, H1-H4HR expression increased compared to controls and in PSC patients treated with UDCA, there was a decrease in the expression of H2HR, H3HR and H4HR. (D) Histamine serum levels were increased in some patients with PSC and levels were decreased in 1 patient treated with UDCA. Data are expressed as mean ± SEM of at least 12 experiments for real-time PCR and at least 15 experiments for EIA. *p<0.05 versus WT mice or control patients; #p<0.05 versus Mdr2−/− mice fed BAC.
Figure 4.
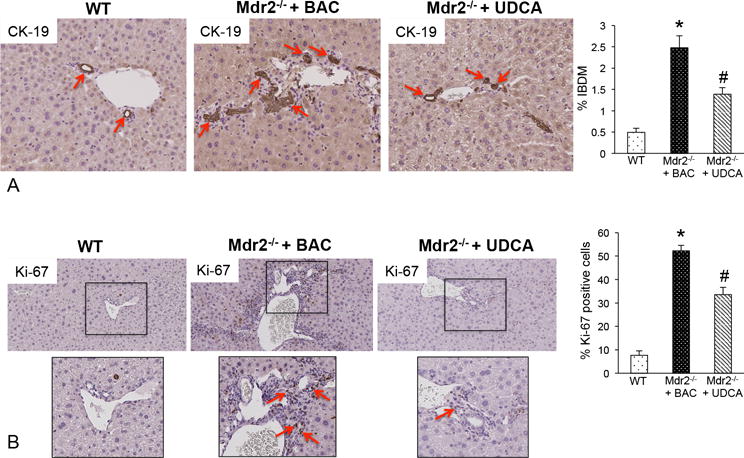
(A) Bile duct mass and (B) Ki-67 were evaluated in liver sections from WT, Mdr2−/− mice + BAC and Mdr2−/− mice fed UDCA. We found that bile duct mass (CK-19 staining, red arrows) and Ki-67 increased in Mdr2−/− mice fed BAC compared to WT mice, whereas in Mdr2−/− mice fed UDCA, there was decreased bile duct mass (red arrows) and a lower number of proliferating cholangiocytes (red arrows). Data has been semi-quantified and are expressed as mean ± SEM of at least 10 experiments. *p<0.05 versus WT mice; #p<0.05 versus Mdr2−/− mice fed BAC diet. Images are 20× magnification (inserts are 40× magnification).
UDCA feeding ameliorates biliary hyperplasia, proliferation, hepatic fibrosis, inflammation and HSC activation in Mdr2−/− mice and human PSC
We found that Mdr2−/− mice fed UDCA have decreased IBDM (Figure 4A), biliary proliferation (Figure 4B), and collagen deposition/fibrosis (Figures 5A and 5B) compared to Mdr2−/− mice fed BAC. Bridging fibrosis was increased in the Mdr2−/− mouse fed BAC compared to WT and this was not as prominent in the Mdr2−/− mouse fed UDCA. Activation of HSCs was determined by SYP-9 staining and we found an increase in qualitative SYP-9 expression in Mdr2−/− mice fed BAC that was reduced in Mdr2−/− mice fed UDCA (Figure 5C). Further, the expression of collagen type-1a, fibronectin-1 (Figure 6A) and SYP-9 (Figure 5C) significantly decreased in Mdr2−/− mice fed UDCA.
Figure 5.
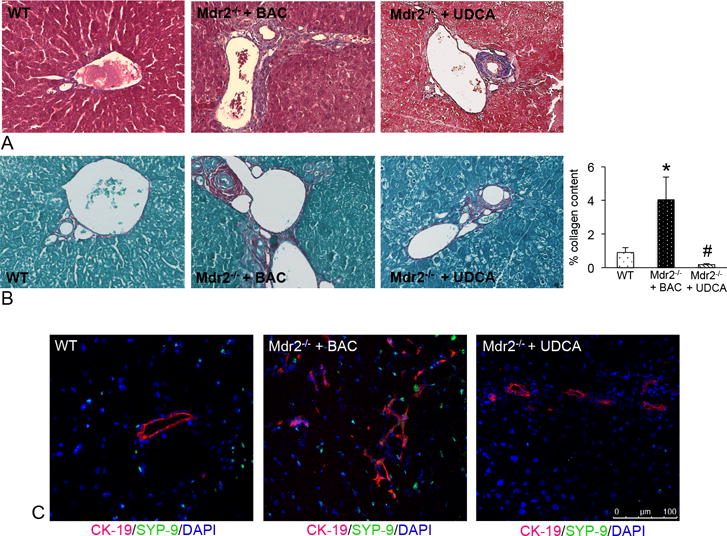
(A) Staining for Masson’s Trichrome and (B) Fast Green/Sirius Red demonstrate an increase in collagen content in Mdr2−/− mice fed BAC compared to WT. UDCA feeding decreased collagen content as shown by semi-quantification of Fast Green/Sirius Red staining (B). (C) Qualitative expression of SYP-9 (green staining) increased in Mdr2−/− mice fed BAC compared to WT; whereas, treatment with UDCA decreased qualitative SYP-9 expression (bile ducts are depicted by red staining). Data are expressed as mean ± SEM of at least 9 experiments. *p<0.05 versus WT mice; #p<0.05 versus Mdr2−/− mice fed BAC diet. Images are 40× magnification.
Figure 6.
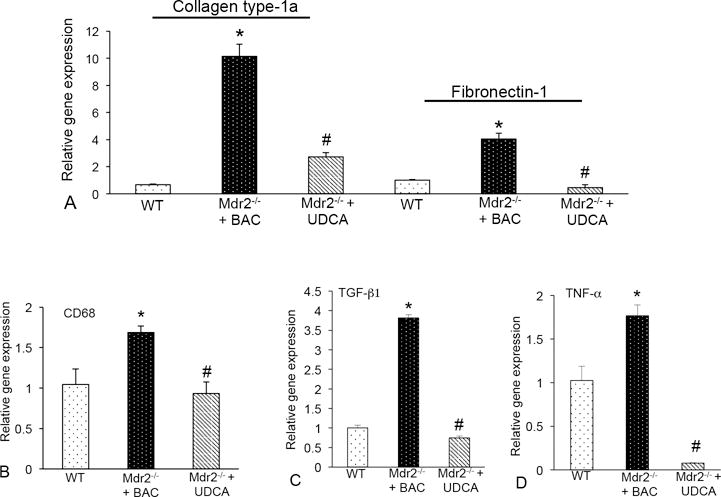
(A) The expression of collagen type-1a and fibronectin-1 were increased in total liver mRNA from Mdr2−/− mice fed BAC compared to WT and UDCA feeding decreased these fibrotic genes. (B) Real-time PCR for CD68 shows increased expression in Mdr2−/− mice fed BAC compared to WT, which is reduced in Mdr2−/− mice fed UDCA. (C) The expression of TGF-β1 and (D) TNF-α increased in Mdr2−/− mice + BAC compared to WT and was significantly reduced in Mdr2−/− mice treated with UDCA. Data are expressed as mean ± SEM of at least 9 experiments for real-time PCR. *p<0.05 versus WT mice; #p<0.05 versus Mdr2−/− mice fed BAC.
CD68 expression increased in Mdr2−/− mice fed BAC compared to WT and Mdr2−/− mice fed UDCA had decreased expression (Figure 6B). TGF-β1 and TNF-α gene expression increased in Mdr2−/− + BAC mice compared to WT; and, when Mdr2−/− mice were fed UDCA, TGF-β1 and TNF-α expression decreased (Figure 6C and 6D). Finally, we found that UDCA feeding decreased MMP-2, -3 and -9 in Mdr2−/− mice compared to BAC feeding (Supplemental Figure 3A).
In human liver tissue fibronectin-1 expression increased in patients with PSC compared to control. UDCA treatment decreased this marker (Figure 7A). Further, Masson’s Trichrome staining revealed increased collagen deposition in PSC patients compared to control; that decreased in PSC patients treated with UDCA (Figure 7B).
Figure 7.
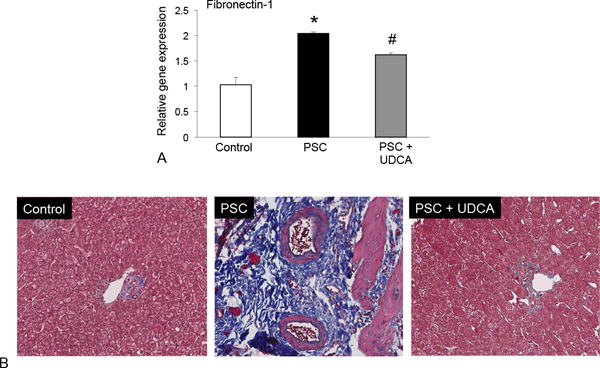
(A) The expression of fibronectin-1 was increased in total liver mRNA PSC patients compared to control and UDCA treatment decreased these fibrotic genes in PSC patients. (B) Masson’s Trichrome staining revealed increased collagen deposition in PSC patients compared to control and this was reduced in PSC patients treated with UDCA. Data are expressed as mean ± SEM of at least 12 experiments for PCR. *p<0.05 versus control. Images are 20× magnification.
UDCA acts on mast cells and alters biliary proliferation and HSC activation, in vitro
Cultured mast cells express ASBT and FXRβ (Figure 8A). When mast cells were treated with UDCA, histamine secretion significantly decreased and treatment with SC-435 (blocks ASBT) or gugglesterone (inhibits FXRβ) returned histamine secretion to normal levels (Figure 8B).
Figure 8.
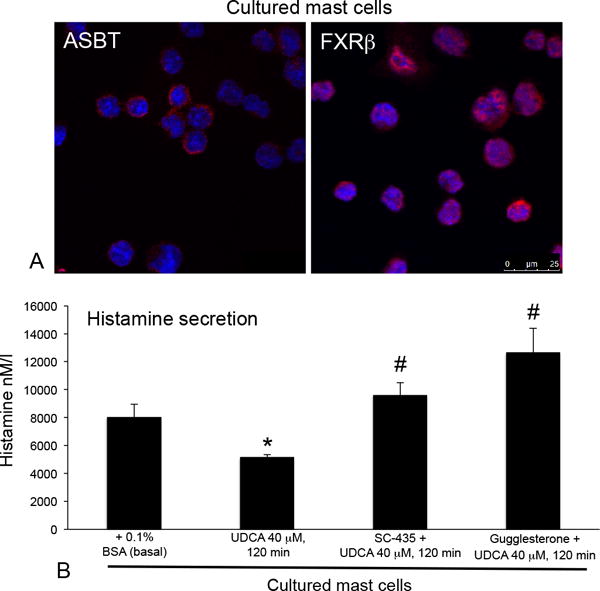
(A) Cultured mast cells express ASBT and FXRβ as shown by immunofluorescence and (B) when mast cells were treated with UDCA histamine secretion decreased. Pretreatment with inhibitors to ASBT (SC-435) or FXRβ (guggulsterone) restored histamine secretion to normal levels. Data are expressed as mean ± SEM of at least 12 experiments for EIA. *p<0.05 versus basal; #p<0.05 versus UDCA treatment.
We found that UDCA decreased histamine secretion and the expression of c-Kit, tryptase and chymase (Figure 9A and 9B). In contrast, treatment with TC, but not TLC increased the expression of mast cell markers (Supplemental Figure 4A).
Figure 9.
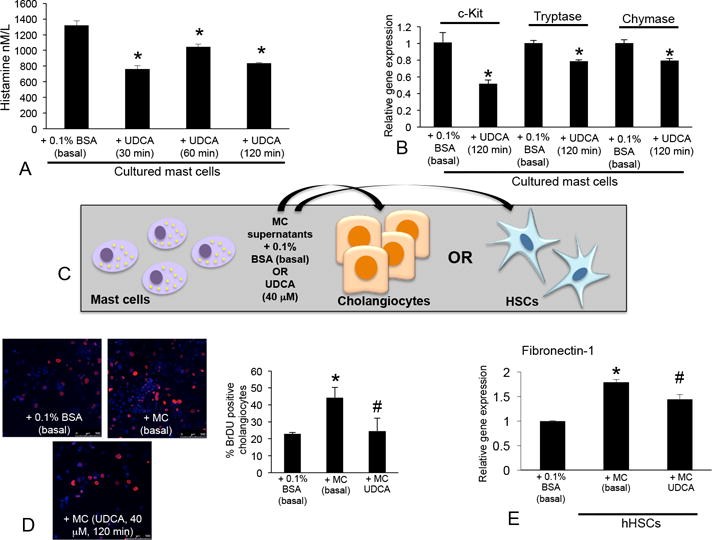
(A) Cultured mast cells treated with UDCA (40 μM) for 30 – 120 minutes had decreased histamine secretion compared to basal treatments. (B) The expression of c-Kit, chymase and tryptase decreased in mast cells treated with UDCA (40 μM, 120 min) shown by real-time PCR. (C) Mast cells were treated with 0.1% BSA (basal) or UDCA (40 μM, 120 min) and conditioned medium was collected. Cholangiocytes and HSCs were treated with conditioned medium and biliary proliferation and activation were measured. (D) In cholangiocytes treated with mast cell conditioned medium (basal) there was an increase in cholangiocyte proliferation shown by BrDU staining, whereas cholangiocyte proliferation decreased following treatment with conditioned medium from mast cells treated with UDCA. (E) HSCs stimulated with conditioned medium from basal-treated mast cells had increased expression of fibronectin-1, which was decreased in HSCs treated with conditioned medium from mast cells treated with UDCA. Data are expressed as mean ± SEM of at least 9 experiments for real-time PCR, 12 experiments for EIA and 10 experiments for BrDU labeling. *p<0.05 versus 0.1% BSA (basal); #p<0.05 + MC (basal) treatment. Images are 20× magnification.
Stimulation with basal-treated mast cells induced biliary proliferation whereas, when cholangiocytes were treated with supernatant collected from mast cells pretreated with UDCA (Figure 9C), biliary proliferation decreased (Figure 9D). Similar to cholangiocytes, fibronectin-1 decreased in HSCs stimulated with UDCA-treated mast cell supernatants compared to mast cell basal treatments (Figure 6C and 6E). Further, in vitro, biliary inflammatory markers TNF-α, CCL-3 and IL-6 increased after stimulation with mast cell supernatants (basal-treated) and were reduced when cholangiocytes were stimulated with mast cell supernatants pre-treated with UDCA (Supplemental Figure 5).
To demonstrate that mast cells, cholangiocytes and HSCs work synergistically during PSC, cultured hHSCs stimulated with cholangiocyte supernatant from Mdr2−/− mice fed BAC had increased TGF-β1, collagen type-1a and fibronectin-1 expression compared to either basal or treatment with WT cholangiocyte supernatants (Figure 10A-D). When hHSCs were stimulated with supernatants from Mdr2−/− mice fed UDCA, t significantly decreased (Figure 10A-D). Finally, in vitro UDCA decreased mast cell expression of MMP-2, -3, and -9 and TNF-α compared to basal treatment (Supplemental Figure 3B and 3C), whereas TC or TLC induced the expression of MMP-2, but not MMP-3 or MMP-9 (Supplemental Figure 4B).
Figure 10.
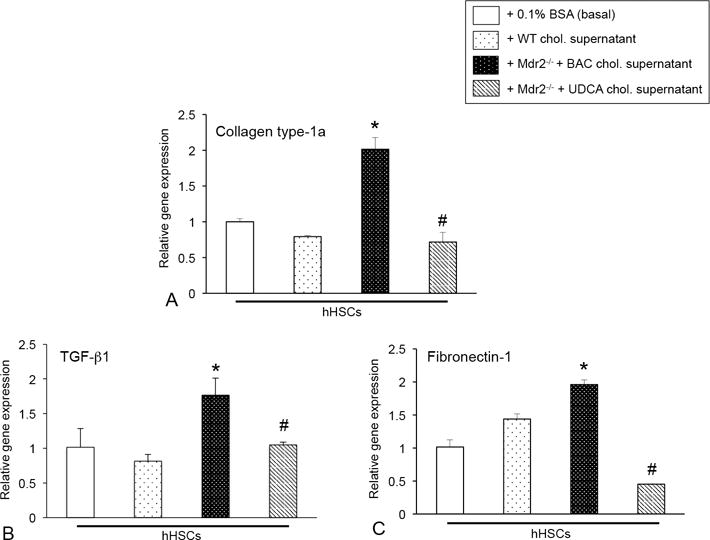
The expression of (A) collagen type-1a, (B) TGF-β1 and (C) fibronectin-1 were increased in hHSCs treated with cholangiocyte supernatant from Mdr2−/− mice fed BAC compared to basal and WT supernatant treatments; however, expression of these fibrotic markers were decreased when hHSCs were stimulated with cholangiocyte supernatants from Mdr2−/− mice fed UDCA. Data are expressed as mean ± SEM of at least 6 experiments for real-time PCR. *p<0.05 versus WT mice; #p<0.05 versus Mdr2−/− mice fed BAC.
Discussion
Mast cells infiltrate Mdr2−/− mice and human PSC; and, treatment with UDCA decreases mast cell activation coupled with reduced biliary damage, proliferation, inflammation and hepatic fibrosis. Further, we found that UDCA reduces histamine, TGF-β1 and inflammatory cytokine release from mast cells thus reducing PSC-associated liver injury. In vitro, we found that mast cells express specific bile acid transporters and nuclear receptors and inhibition of these components increases mast cell activity and subsequent histamine release. Further, cholangiocytes induce a response in HSC activity that can also be regulated by UDCA, in vitro.
We have previously reported that Mdr2−/− mice and late stage PSC patients have increased mast cell numbers compared to controls5 and studies supporting our work show increased mast cell number and activation in cholangiocarcinoma, hepatocellular carcinoma, fatty liver disease and in hepatitis24–26. UDCA also decreases inflammatory mast cell number within gallbladders of patients with cholesterol-induced gallstones27. Further, we found that, in normal rats, TC and TLC increase mast cell number and in support of our findings, a study found that TC activates ileal secretion in WT mice via degranulation of mast cells28.
Alpini et al. reported that, in BDL rats, UDCA feeding decreased biliary mass, bile secretion, and cholangiocyte proliferation by activation of PKC-α21. This was further investigated in BDL-vagotomized rats demonstrating that both UDCA and its taurine conjugate, TUDCA induced protective effects on the biliary tree via calcium-induced signaling29. While these studies support the concept that UDCA may reverse liver damage, Fickertt et al. described that UDCA feeding exacerbates hepatic damage in Mdr2−/− mice16; however, these studies were performed in different aged mice (4 weeks of age) and there was no evaluation of biliary damage. It’s important to note that we utilized 12 week old Mdr2−/− mice that display a robust PSC phenotype when compared to earlier time points16.
Further, we found that UDCA decreases HSC activation, TGF-β1 and TNF-α expression coupled with inhibition of hepatic fibrosis. Our previous5,10 and current findings describe a system whereby mast cells are recruited to the damaged liver, interact with proliferating cholangiocytes inducing activation of HSCs, thus promoting hepatic fibrosis. In support of this, in rats with CCl4-induced liver fibrosis, treatment with UDCA improved histopathological scores, decreased tissue hydroxyproline and inhibited MMP activation with overall amelioration of hepatic fibrosis30. Further, in nonalcoholic steatohepatitis, UDCA was found to be beneficial at repressing hepatic fibrosis and HSC activation by counteracting intestinal barrier dysfunction31. While the usage of UDCA for reducing fibrosis in PSC has been controversial, UDCA is useful in PBC management by decreasing inflammation and fibrosis12. Further, the derivative of UDCA, nor-UDCA, shows promising results in both animals and humans to reduce and ameliorate fibrosis in PSC and PBC1,2.
Mast cells release numerous inflammatory mediators including histamine, TGF-β1 and TNF-α, all of which were reduced in Mdr2−/− mice fed UDCA. During ulcerative colitis there is an increase in inflammatory cytokines, that are mostly ablated in mast cell-deficient rats32. Further, TNF-α increases in lung tissues following autologous liver transplantation; however, when animals were treated with the mast cell stabilizers, cromolyn sodium or ketotifen prior to transplantation, inflammatory mediators significantly reduced33. Additionally, BDL rats treated with UDCA displayed a significant decrease in TGF-β1 expression compared to control rats34 and He et al. found that the addition of retinoic acid to UDCA treatment decreased TGF-β1 and collagen deposition in BDL rats35. The link between UDCA and inflammation has also been demonstrated in fatty liver disease. Pathil et al. found that treatment with a conjugate of UDCA improved liver histology, steatosis and decreased proinflammatory cytokines in mice fed a high fat diet36. In our study, we found that UDCA decreased MMP expression. Similar to this, it has been previously demonstrated that UDCA induced beneficial effects on liver ALT levels and inhibited MMPs leading to the destruction of extracellular matrix in the damaged liver14.
Cholangiocytes express FXRβ and ASBT37. Similarly, we found that mast cells express these components (along with others, data not shown) and may use these to allow UDCA (or other bile acids) to induce effects on mast cell degranulation. Whereas, UDCA has been demonstrated to be a weak ligand for FXR in some studies38, in our work, we found that blocking FXRβ restored mast cell-histamine release (inhibited by UDCA treatment) suggesting that, in mast cells, the UDCA/FXR interaction is important. Further, Mueller et al. recently reported that UDCA exerts FXR antagonistic effects on patients with NAFLD39. ASBT is a critical regulator of conjugated bile acids especially in cholangiocyte regulation40,41 and we demonstrated that inhibition of ASBT or FXR returns histamine levels back to normal following UDCA treatment. In support of our studies, it has been previously demonstrated that bile acids influence mast cell degranulation42 and we found that UDCA decreases mast cell histamine release, mast cell marker expression, biliary proliferation and HSC activation, in vitro. Interestingly, a recent study has shown that the ASBT inhibitor itself may be a promising tool for reducing PSC progression and clinical trials are underway 43. In this work the authors find that treatment with SC-435 decreases inflammation, damage and fibrosis in the Mdr2−/− mouse model, which are interesting since we found that blocking ASBT returns histamine levels back to normal following UDCA treatment, in vitro. Considering that the authors used in vivo models and our studies on the ASBT inhibitor were in vitro, more experimental analysis should be performed to fully understand if ASBT alters mast cells during disease progression.
In conclusion, our studies are the first to demonstrate that UDCA decreases mast cell number and histamine release, thereby inhibiting PSC-induced inflammation. Our novel data suggest an alternative strategy for UDCA action that also includes regulation of mast cell function (Figure 11). Further studies are warranted to fully understand the implications of bile acid regulation on mast cell activation including determining the effects of norUDCA, which has been shown to be a promising therapy for PSC patients 44.
Figure 11.
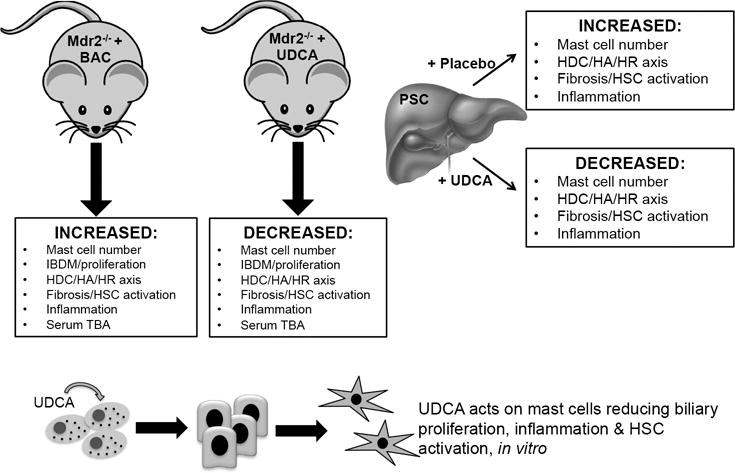
Working model depicting a summary of the findings. Mdr2−/− mice fed BAC have upregulated mast cell number, HDC/HA/HR axis, biliary hyperplasia, HSC activation, fibrosis, inflammation and serum TBAs. These parameters are all reduced in Mdr2−/− mice fed UDCA. Further, patients treated with UDCA have decreased mast cell number, inhibited HA/HR axis, HSC activation and fibrosis and inflammation compared to placebo-treated patients. Finally, in vitro, UDCA acts on mast cells to decrease biliary proliferation and HSC activation.
Supplementary Material
Supplemental Figure 1 (A) The gene expression of c-Kit, chymase and tryptase are significantly increased in Mdr2−/− mice + BAC compared to WT, whereas in Mdr2−/− mice fed UDCA, these markers are decreased as shown by real-time PCR. Data are expressed as mean ± SEM of at least 6 experiments for real-time PCR. *p<0.05 versus WT mice; #p<0.05 versus Mdr2−/− mice fed BAC diet. (B) The gene expression of c-Kit, tryptase and FCεR1, increased in samples from advanced and late stage PSC when compared to normal, non-diseased tissues and these values were reduced in PSC patients treated with UDCA. Data are expressed as mean ± SEM of at least 12 experiments for real-time PCR. *p<0.05 versus control.
Supplemental Figure 2 Mast cell (marked by red arrows) numbers increase following bile duct ligation (BDL) or feeding TC or TLC. UDCA feeding decreased BDL-induced mast cell infiltration as shown by toluidine blue staining. Mast cell numbers were semi-quantified using a light microscope. Images are 20× magnification.
Supplemental Figure 3 (A) MMP-2, -3 and -9 expression increased in Mdr2−/− mice fed BAC compared to WT and in mice fed UDCA, the expression significantly decreased compared to Mdr2−/− mice + BAC. (B) In mast cells treated with UDCA, MMP-2, -3 and -9 expression decreased compared to basal-treated mast cells. (C) TNF-α expression decreased in mast cells treated with UDCA. Data are expressed as mean ± SEM of at least 12 experiments for real-time PCR. *p<0.05 versus WT mice or basal; #p<0.05 versus Mdr2−/− mice fed BAC.
Supplemental Figure 4 (A) The expression of c-Kit, chymase and tryptase increased in mast cells treated with TC or TLC shown by real-time PCR. (B) In mast cells treated with TC or TLC, MMP-2 and -3 expression increased, whereas MMP-9 was unchanged compared to basal-treated mast cells. Data are expressed as mean ± SEM of at least 6 experiments for real-time PCR. *p<0.05 versus basal.
Supplemental Figure 5 Mast cells were treated with 0.1% BSA (basal) or UDCA (40 μM, 120 min) and conditioned medium was collected. Cholangiocytes were treated with conditioned medium and biliary inflammation was measured. In cholangiocytes treated with mast cell conditioned medium (basal) there was an increased biliary expression of TNF-α, CCL-3 and IL-6, which was reduced when cholangiocytes were treated with conditioned medium from mast cells treated with UDCA. Data are expressed as mean ± SEM of at least 9 experiments for real-time PCR. *p<0.05 versus 0.1% BSA (basal); #p<0.05 + MC (basal) treatment.
Acknowledgments
Financial support: Portions of this work were supported by (i) a VA Merit Awards (1I01BX003031, HF; 4I01BX000574, GA; 1I01BX001724, FM and 1I01BX002638, SD) from the United States Department of Veteran’s affairs, Biomedical Laboratory Research and Development Service and R01 grants from NIH NIDDK (DK108959, HF and DK082435, SD); (ii) funds from the PSC Partners Seeking a Cure (HF & SD); (iii) a Baylor Scott and White Research Mentor Award (HF); and (iv) the Dr. Nicholas C. Hightower Centennial Chair of Gastroenterology from Baylor Scott & White Health (GA). This material is the result of work supported with resources and the use of facilities at the Central Texas Veterans Health Care System, Temple, Texas. The content is the responsibility of the author(s) alone and does not necessarily reflect the views or policies of the Department of Veterans Affairs or the United States Government.
Footnotes
Conflict of interest: None of the authors have any conflicts to disclose.
Author contribution: FM: concept, writing & data analysis; LK: editing, data analysis, immunofluorescence, mast cell staining, real-time PCR; LH: cell culture, real-time PCR, EIA, immunohistochemistry; JD: animal studies, tissue collection & preparation; immunohistochemistry, staining; HJ: clinical expansion, writing & editing; TM: real-time PCR, staining; AK: immunofluorescence, real-time PCR; KC: immunohistochemistry, quantification; GA: concept design, editing of final version; AS: pathological mouse and human tissue analysis; PI: human sample collection, study design, writing/editing final manuscript; FB: human EIA, editing final manuscript; SD: bile acid transport studies; HF: concept & experimental design, data analysis, writing & final editing of manuscript, figure preparation
References
- 1.Williamson KD, Chapman RW. New Therapeutic Strategies for Primary Sclerosing Cholangitis. Semin Liver Dis. 2016;36(1):5–14. doi: 10.1055/s-0035-1571274. [DOI] [PubMed] [Google Scholar]
- 2.Halilbasic E, Fuchs C, Hofer H, et al. Therapy of Primary Sclerosing Cholangitis–Today and Tomorrow. Dig Dis. 2015;33(Suppl 2):149–63. doi: 10.1159/000440827. [DOI] [PubMed] [Google Scholar]
- 3.Popov Y, Patsenker E, Fickert P, et al. Mdr2 (Abcb4)−/− mice spontaneously develop severe biliary fibrosis via massive dysregulation of pro- and antifibrogenic genes. J Hepatol. 2005;43(6):1045–54. doi: 10.1016/j.jhep.2005.06.025. [DOI] [PubMed] [Google Scholar]
- 4.Trauner M, Fickert P, Wagner M. MDR3 (ABCB4) defects: a paradigm for the genetics of adult cholestatic syndromes. Semin Liver Dis. 2007;27(1):77–98. doi: 10.1055/s-2006-960172. [DOI] [PubMed] [Google Scholar]
- 5.Jones H, Hargrove L, Kennedy L, et al. Inhibition of mast cell-secreted histamine decreases biliary proliferation and fibrosis in primary sclerosing cholangitis Mdr2−/− mice. Hepatology. 2016 doi: 10.1002/hep.28704. [DOI] [PMC free article] [PubMed] [Google Scholar]
- 6.Bachelet I, Levi-Schaffer F, Mekori YA. Mast cells: not only in allergy. Immunol Allergy Clin North Am. 2006;26(3):407–25. doi: 10.1016/j.iac.2006.05.007. doi: S0889-8561(06)00054-3 [pii] [published Online First: 2006/08/26] [DOI] [PubMed] [Google Scholar]
- 7.Beaven MA. Our perception of the mast cell from Paul Ehrlich to now. Eur J Immunol. 2009;39:11–25. doi: 10.1002/eji.200838899. [DOI] [PMC free article] [PubMed] [Google Scholar]
- 8.Boyce JA. Mast cells: beyond IgE. J Allergy Clin Immunol. 2003;111(1):24–32. doi: 10.1067/mai.2003.60. [published Online First: 2003/01/18] [DOI] [PubMed] [Google Scholar]
- 9.Kennedy LL, Hargrove LA, Graf AB, et al. Inhibition of mast cell-derived histamine secretion by cromolyn sodium treatment decreases biliary hyperplasia in cholestatic rodents. Lab Invest. 2014;94(12):1406–18. doi: 10.1038/labinvest.2014.129. [DOI] [PubMed] [Google Scholar]
- 10.Hargrove L, Kennedy L, Demieville J, et al. BDL-induced biliary hyperplasia, hepatic injury and fibrosis are reduced in mast cell deficient Kitw-sh mice. Hepatology. 2017 doi: 10.1002/hep.29079. [DOI] [PMC free article] [PubMed] [Google Scholar]
- 11.Beuers U, Trauner M, Jansen P, et al. New paradigms in the treatment of hepatic cholestasis: from UDCA to FXR, PXR and beyond. J Hepatol. 2015;62(1 Suppl):S25–37. doi: 10.1016/j.jhep.2015.02.023. [DOI] [PubMed] [Google Scholar]
- 12.de Vries E, Beuers U. Management of cholestatic disease in 2017. Liver Int. 2017;37(Suppl 1):123–29. doi: 10.1111/liv.13306. [DOI] [PubMed] [Google Scholar]
- 13.Penz-Osterreicher M, Osterreicher CH, Trauner M. Fibrosis in autoimmune and cholestatic liver disease. Best Pract Res Clin Gastroenterol. 2011;25(2):245–58. doi: 10.1016/j.bpg.2011.02.001. [DOI] [PMC free article] [PubMed] [Google Scholar]
- 14.Buryova H, Chalupsky K, Zbodakova O, et al. Liver protective effect of ursodeoxycholic acid includes regulation of ADAM17 activity. BMC Gastroenterol. 2013;13:155. doi: 10.1186/1471-230X-13-155. [DOI] [PMC free article] [PubMed] [Google Scholar]
- 15.European Association for the Study of the L. EASL Clinical Practice Guidelines: management of cholestatic liver diseases. J Hepatol. 2009;51(2):237–67. doi: 10.1016/j.jhep.2009.04.009. [DOI] [PubMed] [Google Scholar]
- 16.Fickert P, Zollner G, Fuchsbichler A, et al. Ursodeoxycholic acid aggravates bile infarcts in bile duct-ligated and Mdr2 knockout mice via disruption of cholangioles. Gastroenterology. 2002;123(4):1238–51. doi: 10.1053/gast.2002.35948. [DOI] [PubMed] [Google Scholar]
- 17.Graf A, Meng F, Hargrove L, et al. Knockout of histidine decarboxylase decreases bile duct ligation-induced biliary hyperplasia via downregulation of the histidine decarboxylase/VEGF axis through PKA-ERK1/2 signaling. Am J Physiol Gastrointest Liver Physiol. 2014;307(8):G813–23. doi: 10.1152/ajpgi.00188.2014. [DOI] [PubMed] [Google Scholar]
- 18.Halova I, Draberova L, Draber P. Mast cell chemotaxis - chemoattractants and signaling pathways. Frontiers in immunology. 2012;3:119. doi: 10.3389/fimmu.2012.00119. [DOI] [PMC free article] [PubMed] [Google Scholar]
- 19.Alpini G, Glaser SS, Ueno Y, et al. Bile acid feeding induces cholangiocyte proliferation and secretion: evidence for bile acid-regulated ductal secretion. Gastroenterology. 1999;116(1):179–86. doi: 10.1016/s0016-5085(99)70242-8. [DOI] [PubMed] [Google Scholar]
- 20.Alpini G, Ueno Y, Glaser SS, et al. Bile acid feeding increased proliferative activity and apical bile acid transporter expression in both small and large rat cholangiocytes. Hepatology. 2001;34(5):868–76. doi: 10.1053/jhep.2001.28884. [DOI] [PubMed] [Google Scholar]
- 21.Alpini G, Baiocchi L, Glaser S, et al. Ursodeoxycholate and tauroursodeoxycholate inhibit cholangiocyte growth and secretion of BDL rats through activation of PKC alpha. Hepatology. 2002;35(5):1041–52. doi: 10.1053/jhep.2002.32712. [DOI] [PubMed] [Google Scholar]
- 22.Carpino G, Franchitto A, Morini S, et al. Activated hepatic stellate cells in liver cirrhosis. A morphologic and morphometrical study. Ital J Anat Embryol. 2004;109(4):225–38. [PubMed] [Google Scholar]
- 23.Carpino G, Morini S, Ginanni Corradini S, et al. Alpha-SMA expression in hepatic stellate cells and quantitative analysis of hepatic fibrosis in cirrhosis and in recurrent chronic hepatitis after liver transplantation. Dig Liver Dis. 2005;37(5):349–56. doi: 10.1016/j.dld.2004.11.009. [DOI] [PubMed] [Google Scholar]
- 24.Farrell DJ, Hines JE, Walls AF, et al. Intrahepatic mast cells in chronic liver diseases. Hepatology. 1995;22(4 Pt 1):1175–81. doi: 10.1016/0270-9139(95)90627-4. [DOI] [PubMed] [Google Scholar]
- 25.Francis H, Meininger CJ. A review of mast cells and liver disease: What have we learned? Dig Liver Dis. 2010;42(8):529–36. doi: 10.1016/j.dld.2010.02.016. [DOI] [PubMed] [Google Scholar]
- 26.Hodges K, Kennedy L, Meng F, et al. Mast cells, disease and gastrointestinal cancer: A comprehensive review of recent findings. Transl Gastrointest Cancer. 2012;1(2):138–50. [PMC free article] [PubMed] [Google Scholar]
- 27.Carotti S, Guarino MP, Cicala M, et al. Effect of ursodeoxycholic acid on inflammatory infiltrate in gallbladder muscle of cholesterol gallstone patients. Neurogastroenterol Motil. 2010;22(8):866–73, e232. doi: 10.1111/j.1365-2982.2010.01510.x. [DOI] [PubMed] [Google Scholar]
- 28.Hardcastle J, Hardcastle PT, Chapman J, et al. Taurocholic acid-induced secretion in normal and cystic fibrosis mouse ileum. J Pharm Pharmacol. 2001;53(5):711–9. doi: 10.1211/0022357011775839. [DOI] [PubMed] [Google Scholar]
- 29.Marzioni M, Francis H, Benedetti A, et al. Ca2+-dependent cytoprotective effects of ursodeoxycholic and tauroursodeoxycholic acid on the biliary epithelium in a rat model of cholestasis and loss of bile ducts. Am J Pathol. 2006;168(2):398–409. doi: 10.2353/ajpath.2006.050126. [DOI] [PMC free article] [PubMed] [Google Scholar]
- 30.Tasci I, Mas MR, Vural SA, et al. Rat liver fibrosis regresses better with pegylated interferon alpha2b and ursodeoxycholic acid treatments than spontaneous recovery. Liver Int. 2006;26(2):261–8. doi: 10.1111/j.1478-3231.2005.01210.x. [DOI] [PubMed] [Google Scholar]
- 31.Namisaki T, Noguchi R, Moriya K, et al. Beneficial effects of combined ursodeoxycholic acid and angiotensin-II type 1 receptor blocker on hepatic fibrogenesis in a rat model of nonalcoholic steatohepatitis. J Gastroenterol. 2016;51(2):162–72. doi: 10.1007/s00535-015-1104-x. [DOI] [PubMed] [Google Scholar]
- 32.Chu HQ, Li J, Huang HP, et al. Protective effects of tranilast on oxazolone-induced rat colitis through a mast cell-dependent pathway. Dig Liver Dis. 2016;48(2):162–71. doi: 10.1016/j.dld.2015.09.002. [DOI] [PubMed] [Google Scholar]
- 33.Zhang A, Chi X, Luo G, et al. Mast cell stabilization alleviates acute lung injury after orthotopic autologous liver transplantation in rats by downregulating inflammation. PLoS One. 2013;8(10):e75262. doi: 10.1371/journal.pone.0075262. [DOI] [PMC free article] [PubMed] [Google Scholar]
- 34.Yang YY, Huang YT, Lee KC, et al. Chronic administration of ursodeoxycholic acid decreases portal pressure in rats with biliary cirrhosis. Clin Sci (Lond) 2009;116(1):71–9. doi: 10.1042/CS20080075. [DOI] [PubMed] [Google Scholar]
- 35.He H, Mennone A, Boyer JL, et al. Combination of retinoic acid and ursodeoxycholic acid attenuates liver injury in bile duct-ligated rats and human hepatic cells. Hepatology. 2011;53(2):548–57. doi: 10.1002/hep.24047. [DOI] [PMC free article] [PubMed] [Google Scholar]
- 36.Pathil A, Mueller J, Warth A, et al. Ursodeoxycholyl lysophosphatidylethanolamide improves steatosis and inflammation in murine models of nonalcoholic fatty liver disease. Hepatology. 2012;55(5):1369–78. doi: 10.1002/hep.25531. [DOI] [PubMed] [Google Scholar]
- 37.Halilbasic E, Claudel T, Trauner M. Bile acid transporters and regulatory nuclear receptors in the liver and beyond. J Hepatol. 2013;58(1):155–68. doi: 10.1016/j.jhep.2012.08.002. [DOI] [PMC free article] [PubMed] [Google Scholar]
- 38.Makishima M, Okamoto AY, Repa JJ, et al. Identification of a nuclear receptor for bile acids. Science. 1999;284(5418):1362–5. doi: 10.1126/science.284.5418.1362. [DOI] [PubMed] [Google Scholar]
- 39.Mueller M, Thorell A, Claudel T, et al. Ursodeoxycholic acid exerts farnesoid X receptor-antagonistic effects on bile acid and lipid metabolism in morbid obesity. J Hepatol. 2015;62(6):1398–404. doi: 10.1016/j.jhep.2014.12.034. [DOI] [PMC free article] [PubMed] [Google Scholar]
- 40.Alpini G, Glaser S, Baiocchi L, et al. Secretin activation of the apical Na+-dependent bile acid transporter is associated with cholehepatic shunting in rats. Hepatology. 2005;41(5):1037–45. doi: 10.1002/hep.20653. [DOI] [PubMed] [Google Scholar]
- 41.Fava G, Marzioni M, Francis H, et al. Novel interaction of bile acid and neural signaling in the regulation of cholangiocyte function. Hepatol Res. 2007;37(Suppl 3):S420–9. doi: 10.1111/j.1872-034X.2007.00228.x. [DOI] [PubMed] [Google Scholar]
- 42.Quist RG, Ton-Nu HT, Lillienau J, et al. Activation of mast cells by bile acids. Gastroenterology. 1991;101(2):446–56. doi: 10.1016/0016-5085(91)90024-f. [DOI] [PubMed] [Google Scholar]
- 43.Miethke AG, Zhang W, Simmons J, et al. Pharmacological inhibition of apical sodium-dependent bile acid transporter changes bile composition and blocks progression of sclerosing cholangitis in multidrug resistance 2 knockout mice. Hepatology. 2016;63(2):512–23. doi: 10.1002/hep.27973. [DOI] [PMC free article] [PubMed] [Google Scholar]
- 44.Fickert P, Hirschfield GM, Denk G, et al. norUrsodeoxycholic Acid Improves Cholestasis in Primary Sclerosing Cholangitis. J Hepatol. 2017 doi: 10.1016/j.jhep.2017.05.009. [DOI] [PubMed] [Google Scholar]
Associated Data
This section collects any data citations, data availability statements, or supplementary materials included in this article.
Supplementary Materials
Supplemental Figure 1 (A) The gene expression of c-Kit, chymase and tryptase are significantly increased in Mdr2−/− mice + BAC compared to WT, whereas in Mdr2−/− mice fed UDCA, these markers are decreased as shown by real-time PCR. Data are expressed as mean ± SEM of at least 6 experiments for real-time PCR. *p<0.05 versus WT mice; #p<0.05 versus Mdr2−/− mice fed BAC diet. (B) The gene expression of c-Kit, tryptase and FCεR1, increased in samples from advanced and late stage PSC when compared to normal, non-diseased tissues and these values were reduced in PSC patients treated with UDCA. Data are expressed as mean ± SEM of at least 12 experiments for real-time PCR. *p<0.05 versus control.
Supplemental Figure 2 Mast cell (marked by red arrows) numbers increase following bile duct ligation (BDL) or feeding TC or TLC. UDCA feeding decreased BDL-induced mast cell infiltration as shown by toluidine blue staining. Mast cell numbers were semi-quantified using a light microscope. Images are 20× magnification.
Supplemental Figure 3 (A) MMP-2, -3 and -9 expression increased in Mdr2−/− mice fed BAC compared to WT and in mice fed UDCA, the expression significantly decreased compared to Mdr2−/− mice + BAC. (B) In mast cells treated with UDCA, MMP-2, -3 and -9 expression decreased compared to basal-treated mast cells. (C) TNF-α expression decreased in mast cells treated with UDCA. Data are expressed as mean ± SEM of at least 12 experiments for real-time PCR. *p<0.05 versus WT mice or basal; #p<0.05 versus Mdr2−/− mice fed BAC.
Supplemental Figure 4 (A) The expression of c-Kit, chymase and tryptase increased in mast cells treated with TC or TLC shown by real-time PCR. (B) In mast cells treated with TC or TLC, MMP-2 and -3 expression increased, whereas MMP-9 was unchanged compared to basal-treated mast cells. Data are expressed as mean ± SEM of at least 6 experiments for real-time PCR. *p<0.05 versus basal.
Supplemental Figure 5 Mast cells were treated with 0.1% BSA (basal) or UDCA (40 μM, 120 min) and conditioned medium was collected. Cholangiocytes were treated with conditioned medium and biliary inflammation was measured. In cholangiocytes treated with mast cell conditioned medium (basal) there was an increased biliary expression of TNF-α, CCL-3 and IL-6, which was reduced when cholangiocytes were treated with conditioned medium from mast cells treated with UDCA. Data are expressed as mean ± SEM of at least 9 experiments for real-time PCR. *p<0.05 versus 0.1% BSA (basal); #p<0.05 + MC (basal) treatment.


