

Abstract
Purpose:
PD-1/L1 axis-directed therapies produce clinical responses in a subset of patients, therefore, biomarkers of response are needed. We hypothesized quantifying key immunosuppression mechanisms within the tumor microenvironment by multiparameter algorithms would identify strong predictors of anti-PD1 response.
Methods:
Pre-treatment tumor biopsies from 166 patients treated with anti-PD-1 across 10 academic cancer centers were fluorescently stained with multiple markers in discovery (n = 24) and validation (n = 142) cohorts. Biomarker positive cells and their co-localization were spatially profiled in pathologist-selected tumor regions using novel Automated Quantitative Analysis (AQUA) algorithms. Selected biomarker signatures, PD-1/PD-L1 interaction score and IDO-1/HLA-DR co-expression were evaluated for anti-PD-1 treatment outcomes.
Results:
In the discovery cohort, PD-1/PD-L1 interaction score and/or IDO-1/HLA-DR co-expression was strongly associated with anti-PD-1 response (P = .0005). In contrast, individual biomarkers (PD-1, PD-L1, IDO-1, HLA-DR) were not associated with response or survival. This finding was replicated in an independent validation cohort: patients with high PD-1/PD-L1 and/or IDO-1/HLA-DR were more likely to respond (P = .0096). These patients also experienced significantly improved progression free survival (PFS; hazard ratio [HR] = 0.36; P = .0004) and overall survival (OS; HR = 0.39; P = .0011). In the combined cohort, 80% of patients exhibiting higher levels of PD-1/PD-L1 interaction scores and IDO-1/HLA-DR responded to PD-1 blockers (P = .000004). In contrast, PD-L1 expression was not predictive of survival.
Conclusion:
Quantitative spatial profiling of key tumor-immune suppression pathways by novel digital pathology algorithms could help more reliably select melanoma patients for PD-1 monotherapy.
Introduction
PD-1/L1 axis-directed therapies produce profound clinical responses, but only in a subset of patients (1). While PD-L1 immunohistochemistry tests are currently utilized to select patients for anti-PD-1 therapy, multiple studies have demonstrated imperfect correlation with clinical response (2). Therefore, novel biomarker signatures encompassing the biologic complexity of functional anti-tumor immune responses are being pursued using next generation technologies (3,4). In this study, we quantified two complementary immunosuppression signatures hypothesized to correlate with anti-PD-1 response using novel digital pathology algorithms, i) density of PD-1 positive cells in close proximity to PD-L1 positive cells, namely, PD-1/PD-L1 interaction score as a measure of adaptive immune resistance, in contrast to PD-L1 alone (5); ii) co-localization of HLA-DR and IDO1 which are known to be upregulated by IFNγ in immune cell rich tumors (6,7). Our principal hypothesis was that adaptive immune resistance exists in a continuum, characterized by infiltration of immune cells into the tumor microenvironment and their early activation indicated by PD-1 expression and IFNγ secretion, followed by rapid upregulation of immune suppression molecules, such as PD-L1 and IDO1 by IFNγ-sensitive tumor cells (7). We also explored the complementary role of major histocompatibility complex-II (HLA-DR) as its expression on tumor cells correlated with anti-PD-1 response in our previous study of patients with melanoma (8). Herein, we have verified this hypothesis in a discovery cohort of patients with metastatic melanoma using quantitative immunofluorescence (QIF) and image analyses by AQUA technology (9) on pre-treatment tumor biopsies from patients treated with approved PD-1 blockers. Two novel signatures, namely, PD-1/PD-L1 interaction and/or IDO-1/HLA-DR co-expression, correlated best with anti-PD-1 response in the discovery cohort. These signatures were then found to strongly correlate with survival in a large independent validation cohort of patients who received PD-1 blockers at multiple academic cancer centers. Furthermore, survival of melanoma patients who did not receive anti-PD-1 therapies was not correlated with PD-1/PD-L1 interaction and/or IDO-1/HLA-DR co-expression, confirming the selective association of these biomarker signatures with PD-1 blockers. This 2-slide test could help determine the treatment regimen of melanoma patients with single-agent PD-1 blockers, and may additionally guide enrichment of patients into combination anti-PD-1 immunotherapy trials incorporating IDO-1 blockers.
Materials and Methods
Patient Specimens and Study Design
This study was conducted in accordance with U.S. Common Rule where the studies were performed after approval by each local Institutional Review Board with appropriate written consent from the subjects (wherever necessary) prior to specimen testing.
Discovery Cohort.
We used tumor samples from patients with metastatic melanoma (n = 24) treated with single agent anti-PD-1 therapy (pembrolizumab or nivolumab) at Vanderbilt University Medical Center between 2009 and 2015. All retrospective specimens were obtained from formalin-fixed, paraffin embedded (FFPE) biopsy or resection tissue within the 12 months prior to the start of anti-PD-1 therapy. Response status was determined using RECIST criteria.
Independent Validation Cohort.
We used tumor samples from patients with metastatic melanoma (n = 142) treated with single agent anti-PD-1 (pembrolizumab or nivolumab) at ten different cancer centers: Yale-New Haven Health system, Moffitt Cancer Center, University of Alabama Birmingham, Mayo Clinic Jacksonville, Mayo Clinic Phoenix, University of California San Francisco, University of Virginia, Medical University of South Carolina, Cleveland Clinic and Washington University in St. Louis, between 2010 and 2016. All retrospective specimens were obtained from FFPE tissue collected prior to the start of anti-PD-1 therapy, with the vast majority within the 12 months prior to therapy initiation. Response status was determined by each institution using RECIST v1.1 criteria; when not available, irRECIST or immune-related response criteria (irRC) were permitted (10–12). For the purpose of this study, “responders” were defined as patients experiencing complete response (CR), partial response (PR), or stable disease (SD) greater than 6 months, and “non-responders” as patients with progressive disease (PD) as best response, or SD for less than 6 months (13). Clinical outcomes were blinded to the operators performing specimen testing and image analyses in both the discovery and validation cohorts. Clinicopathological characteristics for the entire cohort are listed in Table 1.
Table 1.
Patient baseline characteristics from discovery and validation studies
| Characteristic | Discovery (n = 24) | Validation (n = 142) | P* |
|---|---|---|---|
| Age, years | |||
| Mean (SD) | 57.3 (13.9) | 63.4(14.3) | .06 |
| Sex, No. (%) | |||
| Female | 9 (38) | 54 (38) | .99 |
| Male | 15 (62) | 88 (62) | |
| BRAF mutation status, No. (%) | |||
| Mutant | 9 (38) | 47 (33) | .82 |
| WT | 15 (62) | 63 (44) | |
| Unknown | 0 | 32 (23) | |
| M staging of metastasis, No. (%) | |||
| M1a/M1b/3C | 5 (21) | 44 (31) | .34 |
| M1c | 19 (79) | 91 (64) | |
| Unknown | 0 | 7 (5) | |
| Location, No. (%) | |||
| Lymph node | 3 (12) | 20 (14) | .23 |
| Skin | 5 (21) | 42 (30) | |
| Other ** | 16 (67) | 66 (46) | |
| Unknown | 0 | 14 (10) | |
| Anti-PD-1 therapy, No. (%) | |||
| Nivolumab | 5 (21) | 26 (18) | .78 |
| Pembrolizumab | 19 (79) | 116 (82) | |
| Previous ipilimumab, No. (%) | |||
| No | 11 (46) | 65 (46) | .99 |
| Yes | 13 (54) | 77 (54) | |
| Previous systemic therapies, No. (%) | |||
| 0 | 3 (12) | 53 (37) | .001 |
| 1 | 10 (42) | 49 (35) | |
| 2 | 10 (42) | 17 (12) | |
| ≥3 | 1 (4) | 23 (16) | |
| LDH level, No. (%) | |||
| Normal | 14 (58) | 89 (63) | .14 |
| Elevated | 10 (42) | 31 (22) | |
| Unknown | 0 | 22 (15) | |
| Anti-PD-1 response, No. (%) | |||
| No | 11 (46) | 64 (45) | .99 |
| Yes | 13 (54) | 78 (55) | |
From t-test for comparison of means, and chi-square test for comparison of counts, across the discovery and validation samples.
Other includes Adrenal, Bone, Brain, Breast, Colon, Esophagus, Intestine, Liver, Lung, Palate, Pancreas, Parotid, Sinus, Spleen, Trachea, Viscera, Vulva.
Control (Standard of Care) Cohort.
We obtained tumor samples from patients with metastatic melanoma (n = 44) who received standard of care treatments prior to approval of single agent anti-PD-1 (pembrolizumab or nivolumab) or were not eligible for anti-PD-1 therapies at University of Alabama, Birmingham and Vanderbilt University Medical Center between July 2006 and March 2014. All retrospective specimens were obtained from formalin-fixed, paraffin embedded (FFPE) biopsy. Clinicopathological characteristics were collected from medical record review and are listed in Supplemental Table 1.
Quantitative Immunofluorescence (QIF) Staining, Imaging and Analysis.
Immunofluorescence staining.
FFPE tissue or cell line samples were dewaxed, rehydrated through a series of xylene to alcohol washes to distilled water. Heat-induced antigen retrieval was then performed using the NxGen Decloaking Chamber (Biocare, Pacheco, CA) in Diva buffer (Biocare) and transferred to Tris-buffered saline. All subsequent staining steps were performed at room temperature (RT). Endogenous peroxidase was blocked using Peroxidazed 1 (Biocare) followed by incubation with a protein-blocking solution (Background Sniper, Biocare) to reduce nonspecific antibody staining. Slides were stained 1:200 for 1 hour with mouse anti-PD-1 (NAT105, Biocare), incubated with neat EnVision+ HRP Mouse (Agilent, Santa Clara, CA) for 30 minutes, and PD-1 staining was detected using 1:200 dilution of TSA+ Cy3.5 (Perkin Elmer) for 10 minutes. Any residual HRP was then quenched using 2×10 minute washes of fresh 100 mM benzhydrazide with 50 mM hydrogen peroxide before staining with 3.6 μg/mL rabbit anti-PD-L1 (E1L3N, Cell Signaling Technology), incubated with a cocktail of neat EnVision+ HRP Rabbit (Agilent) plus a 1:50 dilution of mouse anti-S100 directly labeled with 488 dye (custom, Biocare) and 4’,6-diamidino-2-phenylindole (DAPI), and PD-L1 was detected using 1:50 dilution of TSA-Cy5 (Perkin Elmer) for 10 minutes. Slides were cover-slipped with Prolong Gold (Thermo Fisher Scientific, Waltham, MA) mounting media and allowed to dry overnight. Similar methods were used for staining with IDO1, HLA-DR, and CD11b or S100 where slides were stained first with 1:500 rabbit anti-IDO-1 (SP 260, Spring BioScience), incubated with neat EnVision+ HRP Rabbit, and IDO-1 was detected using a 1:50 dilution TSA+ Cy5. Any residual HRP was then quenched and the slides were stained with 1:500 dilution of mouse anti-HLA-DR (TAL.1B5, DAKO), incubated with neat EnVision+ HRP Mouse or EnVision+ anti-S100 directly labeled with 488 dye, and HLA-DR staining was detected with 1:50 TSA-Cy3 (Perkin Elmer). IDO1/HLA-DR/CD11b only: primary and secondary antibody reagents were then removed via the PELCO BiowavePro microwave (Ted Pella, Redding, CA) containing a PELCO ColdSpot® Pro to maintain constant wattage and temperature before staining with 1:500 rabbit anti-CD11b (EP1345Y, AbCam), incubated with a cocktail of neat EnVision+ HRP Rabbit plus DAPI, and CD11b was detected with 1:200 dilution of Opal™520 (Perkin Elmer).
Antibody Validation.
The specificity of the PD-L1 (E1L3N) antibody was verified on cell lines with known levels of PD-L1 expression, namely the positively expressing Karpas 299 and PD-L1 negative Ramos (RA 1) cell lines (Supplemental Figure 1A-B). In addition, this PD-L1 clone has been validated previously (14) and been shown to have high concordance with PD-L1 antibody clones, 22C3 and 28–8 (15,16) which are approved as companion or complementary diagnostics with PD-1 targeted therapies associated with this study cohort. PD-1 (NAT105) antibody specificity was verified using CHO-K1 parental (PD-1 negative) and CHO-K1 cells transfected to express PD-1 (Supplemental Figure 1C-D). HEK293 cells were negative for both IDO-1 (Supplemental Figure 1E) and HLA-DR expression (Supplemental Figure 1G). SKOV3 cells were previously identified as IDO-1 positive (Supplemental Figure 1F), and A375 cells were identified as HLA-DR positive (Supplemental Figure 1H). Expression of all proteins was observed in the expected cellular localization, membranous for PD-L1, PD-1, and HLA-DR, and cytoplasmic for IDO-1. Quantitation of PD-1% and PD-L1% positive cellular expression by AQUA analysis in the CHO-K1/CHO-K1/PD-1 and Karpas 299/Ramos cell mixtures was compared to results obtained by flow cytometry and demonstrated very tight correlations with a Spearman’s rho 1.0 and 0.98 for PD-1 and PD-L1 respectively (Supplemental Figure 1I-J).
Sample Imaging.
Fluorescence images were acquired on the Vectra 2 Intelligent Slide Analysis System (Perkin Elmer, Waltham, MA).(17) First, slides were imaged at 4x magnification based on DAPI and an automated inForm® software algorithm (v. 2.0) was used to identify tissue areas of the slides. The tissue areas were then imaged at 4x magnification for channels associated with DAPI (blue), FITC (green), and Cy5 (red) for the PD-1/PD-L1 stained slides or DAPI (blue), Cy3 (green), and Cy5 (red) for the IDO-1/HLA-DR stained slides to create RGB images. These images were processed by automated inForm software enrichment algorithm to identify possible 20x high-power fields (HPF) of view according to the highest Cy5 expression (PD-1/PD-L1) or Cy3 and Cy5 expression (IDO-1/HLA-DR). The top 40 fields of view were imaged at 20x magnification across DAPI, FITC, Texas Red, and Cy5 wavelengths (PD-1/PD-L1) or DAPI, FITC, Cy3, and Cy5 wavelengths (IDO-1/HLA-DR). All computer pre-selected images were reviewed by a board-certified pathologist for acceptability; images lacking tumor cells, containing mainly necrotic cells, or abnormal fluorescence signals not expected with antibody localization or biology were rejected. Accepted images were processed using AQUAduct (Perkin Elmer), wherein each fluorophore was spectrally unmixed into individual channels and saved as a separate file for analysis.
Image Analyses by AQUA Technology.
This technology has been widely validated in clinical settings for objective quantitation of biomarkers in tissues (9,18–22). Briefly, the pathologist accepted image files were subjected to AQUAnalysis™ (v. 3.1.2.4) via a fully automated process. DAPI signal within each accepted image was used to identify cell nuclei and then dilated to the approximate size of an entire cell. Melanoma tumor marker S100 (Figure 1A) detected with 488 dye was used to create a binary mask of all tumor area within that image (Figure 1B). Overlap between this mask and the mask of all cells created a new mask for all tumor cells. Similarly, absence of the tumor cell marker in combination with the mask of all nuclei created a new mask for all non-tumor cells. Each Cy5 image (Figure 1C) was used to create a binary mask of all PD-L1+ cells (Figure 1D) and overlapped with the mask of all cells. Each Cy3.5 image (Figure 1E) was used to create a binary mask for PD-1+ cells and overlapped with the mask of all non-tumor cells to create a binary mask of all non-tumor cells that are PD-1+ (Figure 1F). The binary mask of all PD-L1+ cells was dilated to create an interaction mask encompassing the nearest neighbor cells (e.g., cells with PD-1). This interaction mask was combined with the binary mask of all PD-1+ non-tumor cells to create an interaction compartment of the PD-1+ cells in close proximity to the PD-L1+ cells such that PD-1 is likely interacting with PD-L1 (Figure 1G-H). The interaction algorithm was verified in PD-1+ and PD-L1+ cell line mixtures, wherein, the total area from all accepted fields for the interaction compartment and the total area of the non-tumor cells was calculated and multiplied by a factor of 10,000 to create a whole number representing an interaction score for each specimen, this score increased with increasing proportions of PD-1+ cells (Supplemental Figure 2). In accordance with the paradigm proposed by Bronte et al (23) and based on the immunosuppressive function of IDO-1 in tumor and myeloid cells (24–26), the CD11b+/ HLA-DR-/IDO-1+ signature was used to designate myeloid-derived suppressor cells (MDSC, Figure 1I-J); CD11b+/HLA-DR+/IDO-1+ cells were described as tumor associated macrophages (TAM, Figure 1K-L); and HLA-DR+/IDO-1+ or S100+/HLA-DR+/IDO-1+ cells were identified as non-myeloid suppressive cells (Figure 1O-P). Reproducibility of the AQUA quantitation for PD-1 and PD-L1 was evaluated on multiple staining runs performed on independent days using the YTMA322 control array. Quantitation for both markers was found to be highly reproducible using linear regression with r2 = 0.97 and 0.98 respectively (Supplemental Figure 3A-B). Reproducibility of the AQUA quantitation for HLA-DR and IDO-1 was evaluated using the MDSC-TMA containing cores from cell lines, SKOV3, HEK293, A375 treated with 0.1 μg/mL IFN, A375 treated with 0.05 μg/mL IFN, and three MDS patient samples. Both markers were highly reproducible using linear regression with r2 = 0.98 and 0.97 respectively (Supplemental Figure 3C-D).
Figure 1.
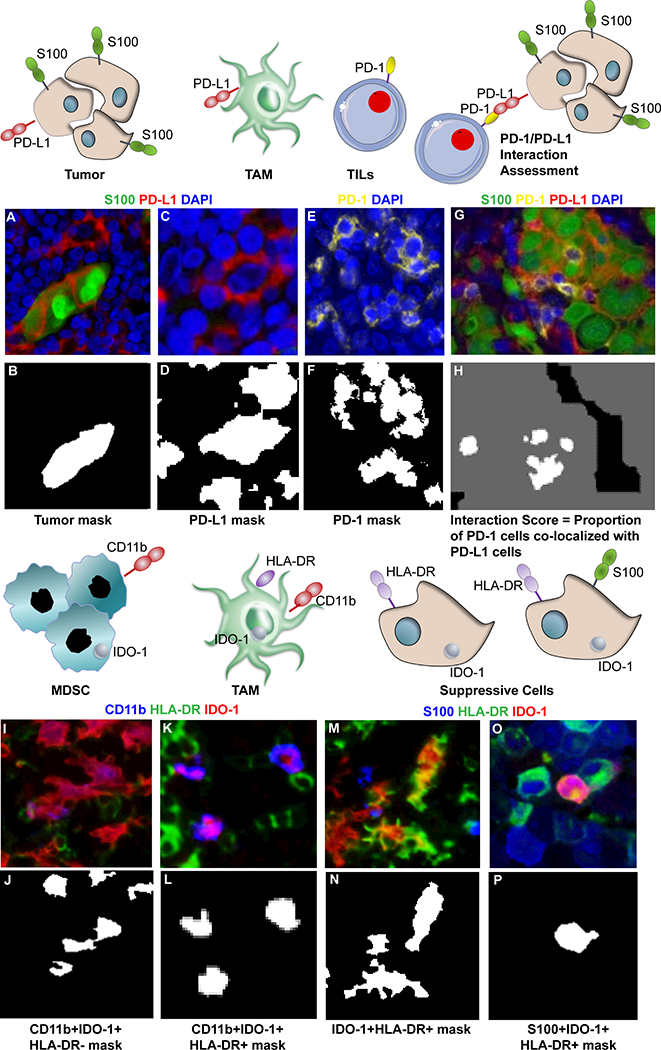
Image analysis by AQUA Technology. Representative pseudo-colored images are shown for S100 (A), PD-L1 (C), PD-1 (E), IDO-1 (I), CD11b (K-M), and HLA-DR (K-M). Binary masks for each cell phenotype of interest were generated in AQUA analysis as shown for tumor cells (B), PD-L1 (D), and PD-1 (E). To identify the proportion of PD-1 cells (E & F) in close proximity to PD-L1 expression, an interaction mask was generated by expanding the PD-L1 mask (H). An example for phenotyping MDSC is represented by CD11b+IDO-1+HLA-DR- cells (J), TAMs by CD11b+IDO-1+HLA-DR+ cells (L), and suppressive cells by IDO-1+HLA-DR+ (N) or S100+IDO-1+HLA-DR+ (P). Image resolution 1 pixel = 0.5μM.
Cell Lines.
Karpas299, Ramos (RA 1), HEK293, SKOV3, and A375 cell lines were purchased from ATCC® and maintained according to manufacturer’s instructions. The CHO-K1/PD1 stable and parental CHO-K1 cell lines were purchased from GenScript® and maintained according to manufacturer’s instructions. CHO-K1/PD1 and CHO-K1 cells or Karpas299 and Ramos cells were then mixed across a range of positive/negative ratios to generate cell mixes with approximately 1%, 5%, 10%, 15%, 25%, 50%, or 100% of cells expressing PD-1 or PD-L1. Prior to mixing, dead cells were removed via centrifugation through Ficoll. Approximately 1 million cells were set aside for flow cytometry analysis with either the anti-human PD1 BV421 antibody (MIH4 clone, BD Biosciences) or anti-human PD-L1 APC antibody (MIH1 clone, BD Biosciences). The remaining cells, approximately 30 million per mixture, were then fixed in 10% neutral buffered formalin (NBF) for a minimum of 6 hours then transferred to 70% ethanol and pelleted into 1.5 mL microcentrifuge tubes. All remaining ethanol was removed and the cells were resuspended in 2% low melt agarose. The cell pellet was then processed through a series of ethanol gradients to xylene before embedding into paraffin for multiplexed fluorescence immunohistochemistry analysis. FFPE samples of Karpas/Ramos cell mixtures, normal tonsil, and placenta were also used to construct a 42-spot tissue microarray (YTMA322), used as a control for the PD-1/PD-L1 assay.
Statistical Analysis
Youden’s index was used to identify optimal cut points for the PD-1/PD-L1 interaction score and IDO-1/HLA-DR tests from the discovery cohort. In particular, cutoff values for the PD-1/PD-L1 interaction score ranging from 900 to 1400, and cutoff values of IDO-1+HLA-DR+ ranging from 2% to 8% were investigated. Values of 900 and 5%, respectively, maximized Youden’s index, so these cutoff values were used to define individuals with positive and negative combined tests: positives have PD-1/PD-L1 ≥ 900 or IDO-1+HLA-DR+ ≥ 5%; negative results have PD-1/PD-L1 < 900 and IDO-1+HLA-DR+ < 5%. The ability of the dual biomarker signatures to predict response and survival was then evaluated in the discovery and validation samples. The primary analytic framework used logistic regression, the Kaplan-Meier method, and Cox proportional hazards models of time to events. Specifically, logistic regression was used to evaluate the potential association between the dual test and response to treatment. Progression free survival (PFS) and overall survival (OS) following therapy was assessed using Kaplan-Meier curves for the different dual test groups. The hazard ratio (HR) of PFS or OS was determined using Cox proportional hazards regression, contrasting patients with a high versus low dual test score (i.e., using the above a dichotomized cutoff). For the logistic Cox and regression models, the potential confounding by metastatic strage, LDH, age at receiving immunotherapy and previous therapies was evaluated. The ability of individual markers (e.g., PD-L1) to predict survival was also evaluated. All analyses were performed using R (https://www.r-project.org/).
Results
Identification of candidate biomarkers to predict response to anti-PD-1 therapy.
Based on the hypothesis that both PD-1 and PD-L1 would need to be expressed in close proximity and in sufficient quantity for patients to demonstrate a response to anti-PD-1 axis therapies, we first evaluated the ability of our PD-1/PD-L1 interaction score assessment to differentiate patients who responded versus those who did not in a discovery cohort of 24 patients. In support of this hypothesis, the PD-1/PD-L1 interaction score was able to significantly differentiate between responders and non-responders (Figure 2A) with a sensitivity of 0.69 and specificity of 0.82 (Table 2), whereas PD-1 or PD-L1 alone did not in this cohort (Figure 2B-C). We also tested the FDA-approved PD-L1 22C3 chromogenic immunohistochemistry assay on this same cohort (performed by an independent laboratory), and this assay was also unable to distinguish responders from non-responders (Figure 2D).
Figure 2.
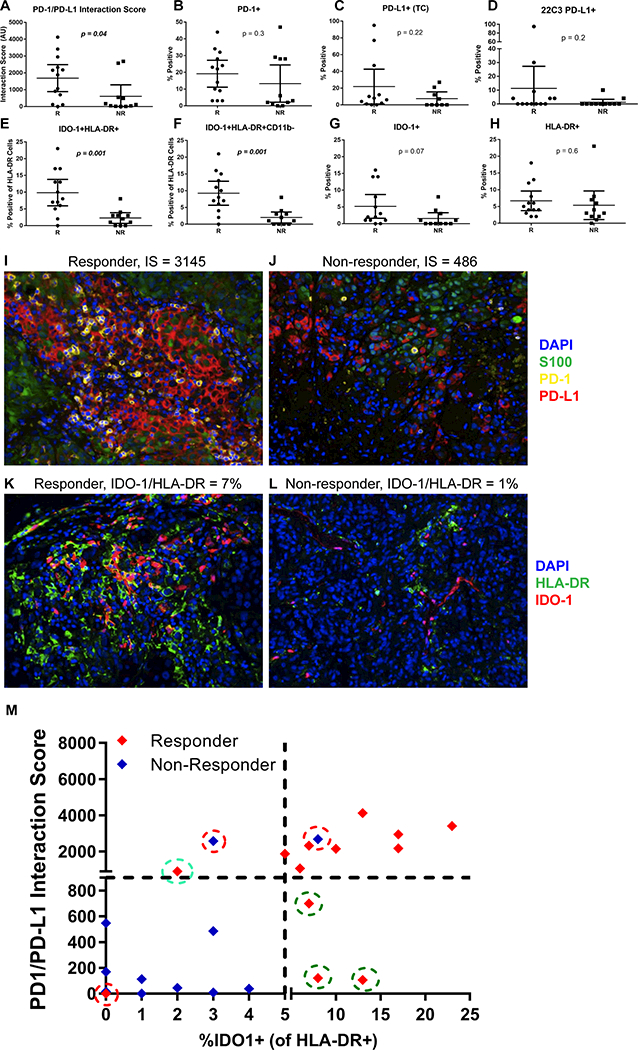
T-test analysis of candidate biomarker signatures between responders (R) and non-responders (NR) in the discovery cohort (n = 24). Responder n = 13 and non-responder n = 11 except (C) PD-L1 tumor cell (TC) where n = 12 and n = 9 respectively. A) PD-1/PD-L1 interaction score, B) %PD-1+, C) %PD-L1+ (TC) quantified with the FIHC assay, D) %PD-L1 22C3 chromogenic assay (TC), E) %IDO-1+HLA-DR+ of total HLA-DR, F) %IDO-1+HLA-DR+CD11b- of total HLA-DR, G) %IDO-1+, H) %HLA-DR+. Error bars represent mean with 95% confidence interval. Representative images show a I) high PD-1/PD-L1 interaction score in a responder; J) low PD-1/PD-L1 interaction score in a non-responder; K) high IDO-1/HLA-DR in a responder; and L) low IDO-1/HLA-DR in a non-responder. M) Comparison of IDO-1/HLA-DR+ and PD-1/PD-L1 test status with response status identified three responders (green circles) with low interaction scores were rescued by IDO-1/HLA-DR test (5% cut point). One responder (cyan circle) with low IDO-1/HLA-DR was rescued by PD1/PD-L1 test (900 cut point). Two non-responders and one responder (red circles) were incorrectly classified. Scale; 1 pixel = 0.5 μM of images acquired at 200x and each fluorescence channel was pseudo-colored for visualization.
Table 2:
Correlation of novel biomarker signatures identified by quantitative digital pathology algorithms with anti PD-1 response
| Discovery (n = 24) | ||||||
|---|---|---|---|---|---|---|
| Responder | ||||||
| Measure | Y | N | P* | Sensitivity | Specificity | AUC |
| PD-L1 (TC)** | ||||||
| ≥ 5% | 7 | 4 | .67 | 0.58 | 0.56 | 0.57 |
| < 5% | 5 | 5 | ||||
| PD-1/PD-L1 interaction score | ||||||
| ≥ 900 | 9 | 2 | .02 | 0.69 | 0.82 | 0.76 |
| < 900 | 4 | 9 | ||||
| IDO-1/HLA-DR | ||||||
| ≥ 5% | 11 | 1 | .0006 | 0.85 | 0.91 | 0.88 |
| < 5% | 2 | 10 | ||||
| Biomarker signature | ||||||
| Single or dual positive*** | 12 | 2 | .0005 | 0.92 | 0.82 | 0.87 |
| Negative | 1 | 9 | ||||
| Validation (n = 142) | ||||||
| PD-L1 (TC)** | ||||||
| ≥ 5% | 27 | 13 | .06 | 0.35 | 0.80 | 0.57 |
| < 5% | 50 | 51 | ||||
| PD-1/PD-L1 interaction score | ||||||
| ≥ 900 | 40 | 22 | .06 | 0.51 | 0.66 | 0.58 |
| < 900 | 38 | 42 | ||||
| IDO-1/HLA-DR | ||||||
| ≥ 5% | 47 | 18 | .0002 | 0.60 | 0.72 | 0.66 |
| < 5% | 31 | 46 | ||||
| Biomarker signature | ||||||
| Single or dual positive | 55 | 31 | .0096 | 0.71 | 0.51 | 0.61 |
| Negative | 23 | 33 | ||||
| Combined (n = 166) | ||||||
| Biomarker signature | ||||||
| Dual positive | 40 | 10 | .000004 | 0.63 | 0.81 | 0.72 |
| Single positive | 27 | 23 | .06 | 0.53 | 0.65 | 0.59 |
| Negative | 24 | 42 | ||||
From chi-square test, comparing biomarker signature- positive with negative groups.
PD-L1 expression could not be assessed on a total of four patients (discovery cohort = 3 and validation cohort = 1) due to absence of tumor specific (S100) staining.
Single positivity is defined by presence of either PD-1/PD-L1 Interaction score or IDO-1/HLA-DR co-expression and dual positivity is by presence of both biomarker signatures above cut point levels in the tumor sample.
We previously observed a correlation between major histocompatibility complex-II (HLA-DR) expression on tumor cells and anti-PD-1 response in patients with melanoma (8). However, HLA-DR is also robustly expressed by tumor infiltrating myeloid cells (CD11b+), which are not known to contribute to this association. HLA-DR can be either constitutively expressed by melanoma and other tumor cells, or can be induced by IFNγ (8). Therefore, in the discovery cohort we assessed additional combinations of HLA-DR, IDO1 (an additional IFNγ-responsive marker), and CD11b expression (to evaluate the myeloid compartment) to test the ability of these markers to predict patient response to PD-1 blockers. We observed significantly higher levels of IDO1+HLA-DR+ cells in patients who responded to anti-PD-1 therapy (Figure 2E) that was independent of myeloid (CD11b) expression (Figure 2F) with a sensitivity of 0.85 and specificity of 0.91 (Table 2), whereas individual biomarkers (Figure 2G-H) or additional combinations were unable to differentiate responders from non-responders (Supplemental Table 2). Representative images from responder and non-responder patients for the PD-1/PD-L1 and IDO-1/HLA-DR tests are shown in Figure 2 panels I-L.
To further verify the role of an IDO-1+HLA-DR+ cellular phenotype in predicting response to anti-PD-1 therapy, we performed ex vivo culture of previously established patient-derived xenograft (PDX) tissue sections from a patient with melanoma with a profound clinical response and another patient with disease progression despite anti-PD-1 therapy (8). When these tumor samples were treated with IFNγ, we observed a significant induction and co-expression of HLA-DR and IDO-1 in the patient who had responded to anti-PD-1 therapy but not in the patient with progressive disease, demonstrating heightened sensitivity of the IDO-1/HLA-DR pathway to IFNγ in tumor tissue from the extraordinary responder (Supplemental Figure 4A-D). In contrast, there was an absence of robust change in PD-L1 expression in either PDX model. These findings are largely replicative of immunoblotting data previously described by our group (8). These translational studies suggest IDO-1 and HLA-DR may more accurately reflect pre-existing anti-tumor immunity and inflammation, hence, more accurately reflect effective anti-PD-1 responses (P = .0006) than PD-L1 expression alone (P > .05).
From these two promising biomarker signatures, the maximized Youden’s index of 0.74 determined from the discovery cohort identified the optimal cut point for the PD-1/PD-L1 interaction score as ≥ 900 and IDO-1/HLA-DR ≥ 5% positivity (Figure 2M). We then evaluated whether these two biomarker signatures were redundant or complementary. As summarized in Table 2, we observed the highest response rates in the group of patients whose tumors expressed either PD-1/PD-L1 interaction score and/or IDO-1/HLA-DR levels above their respective cut points; likewise, the lowest response rates were observed in the biomarker signature-negative population (P = .0006). The combination of high PD-1/PD-L1 interaction score and/or IDO-1/HLA-DR positivity demonstrated the highest sensitivity (0.92) and specificity (0.82) for response in the discovery cohort. Patients expressing either or both biomarker signatures had the highest likelihood of benefitting from anti-PD-1 therapies, compared to those expressing neither signature (Figure 2M).
Independent Validation of Novel Biomarker Signatures Predicting anti-PD-1 Response.
The ability of a PD-1/PD-L1 interaction score and IDO-1/HLA-DR status to predict the clinical outcome of anti-PD-1 therapies was evaluated in an independent cohort of 142 patients across ten different academic cancer centers. Utilizing the predetermined cut points, we observed higher response rates among patients with high PD1/L1 interaction scores (p=0.06) or IDO-1/HLA-DR signatures (p=0.0002) (Table 2 and Supplemental Figure 5). We captured the highest proportion of responders (70.5%) by including patients that had either positive PD1/L1 or IDO-1/HLA-DR scores. Smaller proportions of responders were identified if patients were stratified by a single signature: PD-1/PD-L1 interaction alone (51.3%) or IDO-1/HLA-DR (60.3%) alone (Table 2). More importantly, patients with PD-1/PD-L1 and/or IDO-1/HLA-DR above the pre-specified cut point also experienced a significant improvement in PFS (HR = 0.36; P = .0004) and OS (HR = 0.39; P = .0011) as shown in Figure 3A-B, while, survival based on presence of individual biomarker signatures was less profound (Supplemental Figure 6). Furthermore, in multivariate analyses, survival predictions were not confounded by metastatic stage or LDH levels (see Supplemental Table 3). In contrast, tumor PD-L1 expression alone could not meaningfully (P > 0.1) segregate patients with improved PFS or OS regardless of the cut point chosen, analyzed at 5% (Figure 3C-D), 1%, and 25% (Supplemental Figure 7). Likewise, total PD-L1 expression within tumor and immune cells produced survival curves nearly identical to tumor PD-L1 expression alone (data not shown, identical to PD-L1 TC). Additionally, when viewed across all patients in discovery and validation cohorts (combined, n = 166), we found that patients whose tumors exhibited both PD1/L1 interaction scores and IDO-1/HLA-DR biomarker signatures above cut point levels have the highest likelihood of response (80%, P = .000004) and superior OS (P = .0018) (Figure 4A), which is further illustrated by the highest sensitivity and specificity associated with the dual biomarker test positive group (Table 2).
Figure 3.
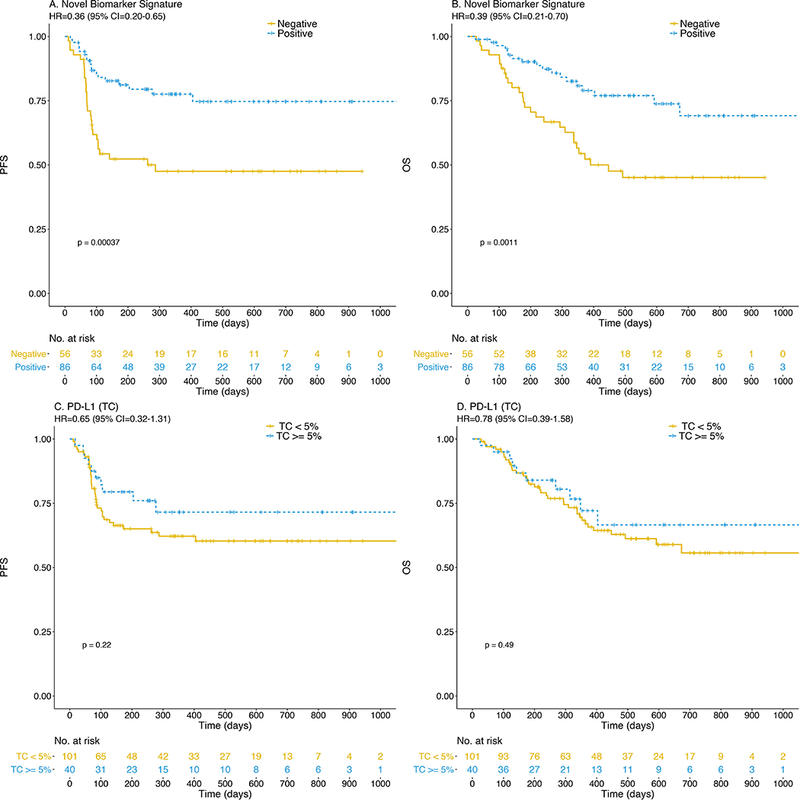
Anti-PD-1 treated patients expressing novel biomarker signatures (PD-1/PD-L1 interaction and/or IDO-1/HLA-DR co-expression) experience significantly improved PFS (A) and OS (B) in contrast to PD-L1 alone in TC (panels C, D) at 5% cut point.
Figure 4.
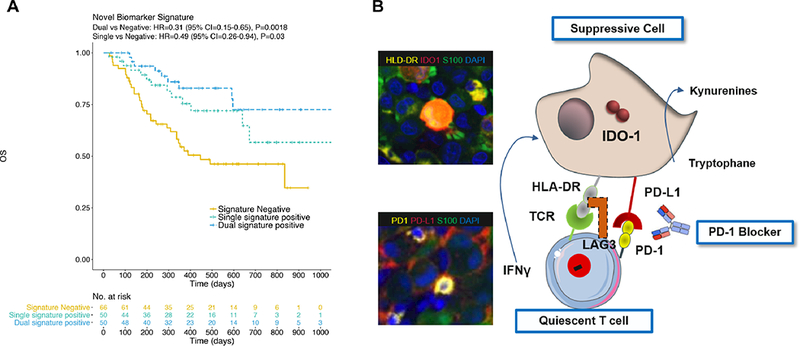
Patients exhibiting both adaptive resistance mechanisms, namely, the presence of PD-1/PD-L1 interaction and IDO-1/HLA-DR co-expression (dual) experience further improvement in OS compared with presence of either mechanism alone (A). Adaptive resistance mechanisms observed in this study population are depicted with supportive imagery of a patient tumor (B).
We then assessed whether this signature was associated with a treatment-specific effect related to anti-PD-1 clinical benefit compared with a more generally positive prognosis. Thus, we evaluated survival relationships of these same biomarker signatures in a control cohort of patients with American Joint Committee on Cancer (AJCC) stage III-IV melanoma (n = 44), who had not received anti-PD-1 therapies (Supplemental Table 1). No statistically significant difference in survival was observed amongst biomarker signature positive and negative populations (see Supplemental Figure 8).
Discussion
We described identification of immune biomarker signatures that correlate strongly with clinical outcomes to PD-1 blockade. The clinical utility of these predictive signatures was carefully validated in one of the largest cohorts of patients with metastatic melanoma treated at ten different institutions. More importantly, these assays apply minimal exclusion criteria and only require limited tumor specimens (2 unstained slides). The higher predictive value of these assays is likely due to the unique operating principles underlying the digital pathology approach, which involves use of spatial information and signal enrichment of rare cellular phenotypes within the tumor microenvironment and their conversion into actionable clinical signatures (9,17,19,21,22). This is exemplified by the precise determination of PD-1 and PD-L1 spatial interactions and accurate quantitation of their colocalization density, thus directly addressing the hypothesis that the therapeutic mechanism of PD-1 blockers requires both PD-1 and PD-L1 expression in sufficient quantity and spatial proximity within tumor tissue (5). This study along with multiple independent studies further reinforces the imperfect correlation between PD-L1 expression alone and clinical outcomes (1,2).
The desire to explore alternate predictive pathways became imperative when we observed patients who progressed on anti PD-1 therapy despite high PD-L1 expression. We have previously discovered a link between HLA-DR expression and response to anti-PD-1 (8) and thus hypothesized that this IFNγ responsive MHC class II molecule could augment the signature’s predictive capacity, and identify other populations of immunogenic cells. HLA-DR has been reported in wide range of cancers, including breast cancer (27,28), colon cancer (29), and Hodgkin lymphoma (30). Notably, MHC-II was shown to correlate with response to anti-PD-1 in complementary fashion to PD-L1 expression in Hodgkin lymphoma (30). IDO-1 is also upregulated by IFNγ on tumor and other infiltrating cells in the tumor microenvironment (7,25), and elevated gene expression correlated with anti-PD-1 response (4); thus incorporation of these two potentially overlapping IFNγ−responsive markers can enhance sensitivity. Accordingly, we observed a cellular phenotype co-expressing HLA-DR and IDO-1, but not the myeloid marker CD11b, which showed exceptionally strong correlation with clinical response. Importantly, 3/13 responders in the discovery cohort with low PD-1/PD-L1 interaction scores exhibited high levels of HLA-DR and IDO-1 (Figure 2M), suggesting an alternate mechanism of immunosuppression, potentially mediated by engagement of HLA-DR on tumor cells with cognate ligands on tumor infiltrating lymphocytes e.g., T cell receptor (31) or LAG3 (32,33). Interestingly, analyses of both pretreatment patient tumors and PDX models suggest that IDO-1/HLA-DR co-expression showed a better correlation with anti-PD-1 clinical outcomes than PD-L1. We are currently exploring the mechanisms of this finding and evaluating the predictive utility of these signatures in additional tumor indications for which PD-1 blockers were approved. Based on observations that PD-L1, HLA-DR and IDO-1 are expressed along the adaptive immune resistance continuum mediated by IFNγ (5,6,34), we speculate that tumors may have evolved to express two complementary mechanisms of immunosuppression, one mediated by PD-1/PD-L1 interaction and a second via HLA-DR-cognate T-cell receptor or LAG3 engagement as modeled in Figure 4B.
Developing biomarkers to accurately predict response to anti-PD-1/PD-L1 therapy is a critical and unmet need. Other candidate markers involving similar immunosuppressive pathways have been identified by alternate methodologies (3,4,35–37). We believe that the biomarker signatures described herein compares quite favorably with previous studies from the standpoint of predictive capacity (80% response rate in double-positive patients), logistical feasibility (2 FFPE slides), objective quantitation (automated scoring system) and visual verification. Intriguingly, excellent clinical outcomes have also been reported with agents inhibiting PD-1, IDO-1 and PD-1/LAG-3 (a cognate ligand of HLA-DR), suggesting that these biomarker signatures may be relevant for enriching patients into promising next-generation combination immunotherapy trials (6,24).
In conclusion, we report here discovery of a highly predictive, non-subjective tool for administering anti-PD-1 monotherapies, whose clinical performance was verified in patients with melanoma treated across ten different cancer centers akin to a real world setting. This approach utilizes minimal number of tumor sections and provides spatial information, serving as a powerful potential diagnostic tool that could fit well into a routine pathologist’s workflow and easily interpretable by the clinical community.
Supplementary Material
Translational Relevance.
PD-1 and PD-L1 inhibitors are currently transforming the treatment landscape of many solid tumors. However, reliable biomarkers to predict response have remained elusive. The digital pathology approach described here identified unique biomarker signatures strongly associated with anti-PD1 outcomes in a real world cohort of 166 melanoma patients from 10 different cancer centers. Patients positive for biomarker signatures (PD-1/PD-L1 and HLA-DR/IDO) had a high likelihood of response (80%) and a three-fold improvement in overall survival (hazard ratio 0.31). This digital pathology approach provides a biologically relevant profile of the tumor microenvironment, and may be clinically useful for selecting patients for anti-PD-1 therapies. The unique advantages of this approach include its objective, quantitative nature, minimal tissue requirements (2 unstained slides), and high predictive capacity. Further, we speculate that this test could be used for promising novel combinations, including inhibitors of IDO-1 and LAG-3 (a cognate ligand of HLA-DR).
Acknowledgments
Support
Supported by Navigate BioPharma Services, Inc., a Novartis Subsidiary. DBJ is funded by NCI/NIH K23 CA204726.
Footnotes
Disclosure of Potential Conflicts of Interest
D.B. Johnson reports receiving commercial research grants from Incyte and is a consultant/advisory board member for Array Biopharma, Bristol Myers Squibb, Merck, Novartis, Genoptix, Incyte.
D.L. Rimm reports receiving commercial research grants from Gilead Sciences, Cepheid, OncoPlex Diagnostics, Perkin Elmer, Pierre Fabre, and AstraZeneca; receiving honoraria from Amgen, Astra Zeneca, Bristol Myers Squibb, Genentech, Cell Signaling Technology; patents and royalties from Rarecyte CTCs and AQUA; and is a consultant/advisory board member for Biocept, Cernostics, Perkin Elmer, Bethyl Laboratories, Genoptix, Bristol Myers Squibb, Astra Zeneca, Five Prime Therapeutics, Optra SCAN, Agendia, Clearsight, and Ultivue,
R.W. Joseph reports receiving commercial research grants from Merck, Bristol Myers Squibb, Roche/Genentech, X4P, and Amgen and is a consultant/advisory board member for Bristol Myers Squibb, Nektar, Genoptix, Eisai, Novartis, Merck, and Exelixis.
A.I. Daud reports receiving commercial research grants from Pfizer, Merck, GlaxoSmithKline, OncoSec, Bristol Myers Squibb, and Novartis and is a consultant/advisory board member for Pfizer, OncoSec, Merck, Novartis and Bristol Myers Squibb.
R.M. Conry reports speaking for Novartis, Bristol Myers Squibb, and Merck.
E.M. Gaughan reports receiving commercial research grants from Merck and Bristol Myers Squibb.
L.F. Hernandez-Aya reports receiving commercial research grants from Regeneron, Merck, Corvus Pharmaceuticals, Immunoscore, Bristol Myers Squibb, Genentech, Polynoma, Astra Zeneca and is a consultant/advisory board member for Massive Bio.
J.S. Witte is a consultant/advisory board member for Navigate BioPharma Services, a Novartis Subsidiary and Genoptix and has provided expert testimony for Pfizer.
J.M. Wrangle is a consultant/advisory board member for Precision Genetics.
J. Markowitz reports receiving commercial research grants from Reata Pharmaceuticals, Macrogenetics, Morphogenesis and Genoptix and is a consultant/advisory board member for Idera and Newlink Genetics
J.M. Balko reports receiving commercial research grants from Incyte.
J. Bordeaux, J. Kim, C. Vaupel, S. Tangri, J. Lameh and N. Dakappagari report employment with Navigate BioPharma Services, Inc., a Novartis subsidiary.
B. Dabbas reports employment with Genoptix, Navigate BioPharma Services, Inc., a Novartis subsidiary, and siParadigm Diagnostic Informatics.
J. Hall reports employment with Genoptix.
No potential conflicts of interest were disclosed by A.T. Dimou, P. Funchain, T.H. Ho, S.B. McKee, J.S. Ko and J.W. Smithy.
Prior Presentation
Presented in part at the American Society of Clinical Oncology (ASCO); Chicago, IL, June 2–6, 2017, and the American Association for Cancer Research (AACR); New Orleans, LA April 16–20, 2016.
References:
- 1.Sunshine J, Taube JM. PD-1/PD-L1 inhibitors. Curr Opin Pharmacol 2015;23:32–8 doi 10.1016/j.coph.2015.05.011. [DOI] [PMC free article] [PubMed] [Google Scholar]
- 2.Gandini S, Massi D, Mandala M. PD-L1 expression in cancer patients receiving anti PD-1/PD-L1 antibodies: A systematic review and meta-analysis. Crit Rev Oncol Hematol 2016;100:88–98 doi 10.1016/j.critrevonc.2016.02.001. [DOI] [PubMed] [Google Scholar]
- 3.Johnson DB, Frampton GM, Rioth MJ, Yusko E, Xu Y, Guo X, et al. Targeted Next Generation Sequencing Identifies Markers of Response to PD-1 Blockade. Cancer Immunol Res 2016;4(11):959–67 doi 10.1158/2326-6066.CIR-16-0143. [DOI] [PMC free article] [PubMed] [Google Scholar]
- 4.Ayers M, Lunceford J, Nebozhyn M, Murphy E, Loboda A, Kaufman DR, et al. IFN-gamma-related mRNA profile predicts clinical response to PD-1 blockade. J Clin Invest 2017;127(8):2930–40 doi 10.1172/JCI91190. [DOI] [PMC free article] [PubMed] [Google Scholar]
- 5.Ribas A, Tumeh PC. The future of cancer therapy: selecting patients likely to respond to PD1/L1 blockade. Clinical cancer research : an official journal of the American Association for Cancer Research 2014;20(19):4982–4 doi 10.1158/1078-0432.CCR-14-0933. [DOI] [PMC free article] [PubMed] [Google Scholar]
- 6.Sharma P, Hu-Lieskovan S, Wargo JA, Ribas A. Primary, Adaptive, and Acquired Resistance to Cancer Immunotherapy. Cell 2017;168(4):707–23 doi 10.1016/j.cell.2017.01.017. [DOI] [PMC free article] [PubMed] [Google Scholar]
- 7.Spranger S, Spaapen RM, Zha Y, Williams J, Meng Y, Ha TT, et al. Up-regulation of PD-L1, IDO, and T(regs) in the melanoma tumor microenvironment is driven by CD8(+) T cells. Sci Transl Med 2013;5(200):200ra116 doi 10.1126/scitranslmed.3006504. [DOI] [PMC free article] [PubMed] [Google Scholar]
- 8.Johnson DB, Estrada MV, Salgado R, Sanchez V, Doxie DB, Opalenik SR, et al. Melanoma-specific MHC-II expression represents a tumour-autonomous phenotype and predicts response to anti-PD-1/PD-L1 therapy. Nat Commun 2016;7:10582 doi 10.1038/ncomms10582. [DOI] [PMC free article] [PubMed] [Google Scholar]
- 9.Dolled-Filhart M, Gustavson M, Camp RL, Rimm DL, Tonkinson JL, Christiansen J. Automated analysis of tissue microarrays. Methods in molecular biology 2010;664:151–62 doi 10.1007/978-1-60761-806-5_15. [DOI] [PubMed] [Google Scholar]
- 10.Eisenhauer EA, Therasse P, Bogaerts J, Schwartz LH, Sargent D, Ford R, et al. New response evaluation criteria in solid tumours: revised RECIST guideline (version 1.1). Eur J Cancer 2009;45(2):228–47 doi 10.1016/j.ejca.2008.10.026. [DOI] [PubMed] [Google Scholar]
- 11.Wolchok JD, Hoos A, O’Day S, Weber JS, Hamid O, Lebbe C, et al. Guidelines for the evaluation of immune therapy activity in solid tumors: immune-related response criteria. Clinical cancer research : an official journal of the American Association for Cancer Research 2009;15(23):7412–20 doi 10.1158/1078-0432.CCR-09-1624. [DOI] [PubMed] [Google Scholar]
- 12.Hodi FS, Hwu WJ, Kefford R, Weber JS, Daud A, Hamid O, et al. Evaluation of Immune-Related Response Criteria and RECIST v1.1 in Patients With Advanced Melanoma Treated With Pembrolizumab. Journal of clinical oncology : official journal of the American Society of Clinical Oncology 2016;34(13):1510–7 doi 10.1200/JCO.2015.64.0391. [DOI] [PMC free article] [PubMed] [Google Scholar]
- 13.McGranahan N, Furness AJ, Rosenthal R, Ramskov S, Lyngaa R, Saini SK, et al. Clonal neoantigens elicit T cell immunoreactivity and sensitivity to immune checkpoint blockade. Science 2016;351(6280):1463–9 doi 10.1126/science.aaf1490. [DOI] [PMC free article] [PubMed] [Google Scholar]
- 14.Velcheti V, Schalper KA, Carvajal DE, Anagnostou VK, Syrigos KN, Sznol M, et al. Programmed death ligand-1 expression in non-small cell lung cancer. Laboratory investigation; a journal of technical methods and pathology 2014;94(1):107–16 doi 10.1038/labinvest.2013.130. [DOI] [PMC free article] [PubMed] [Google Scholar]
- 15.Gaule P, Smithy JW, Toki M, Rehman J, Patell-Socha F, Cougot D, et al. A Quantitative Comparison of Antibodies to Programmed Cell Death 1 Ligand 1. JAMA oncology 2016. doi 10.1001/jamaoncol.2016.3015. [DOI] [PMC free article] [PubMed] [Google Scholar]
- 16.Rimm DL, Han G, Taube JM, Yi ES, Bridge JA, Flieder DB, et al. A Prospective, Multi-institutional, Pathologist-Based Assessment of 4 Immunohistochemistry Assays for PD-L1 Expression in Non-Small Cell Lung Cancer. JAMA oncology 2017;3(8):1051–8 doi 10.1001/jamaoncol.2017.0013. [DOI] [PMC free article] [PubMed] [Google Scholar]
- 17.Stack EC, Wang C, Roman KA, Hoyt CC. Multiplexed immunohistochemistry, imaging, and quantitation: a review, with an assessment of Tyramide signal amplification, multispectral imaging and multiplex analysis. Methods 2014;70(1):46–58 doi 10.1016/j.ymeth.2014.08.016. [DOI] [PubMed] [Google Scholar]
- 18.Schalper KA, Brown J, Carvajal-Hausdorf D, McLaughlin J, Velcheti V, Syrigos KN, et al. Objective measurement and clinical significance of TILs in non-small cell lung cancer. Journal of the National Cancer Institute 2015;107(3) doi 10.1093/jnci/dju435. [DOI] [PMC free article] [PubMed] [Google Scholar]
- 19.Schalper KA, Carvajal-Hausdorf D, McLaughlin J, Altan M, Velcheti V, Gaule P, et al. Differential expression and significance of PD-L1, IDO-1 and B7-H4 in human lung cancer. Clinical cancer research : an official journal of the American Association for Cancer Research 2016. doi 10.1158/1078-0432.CCR-16-0150. [DOI] [PMC free article] [PubMed] [Google Scholar]
- 20.Kluger HM, Zito CR, Barr ML, Baine MK, Chiang VL, Sznol M, et al. Characterization of PD-L1 Expression and Associated T-cell Infiltrates in Metastatic Melanoma Samples from Variable Anatomic Sites. Clinical cancer research : an official journal of the American Association for Cancer Research 2015. doi 10.1158/1078-0432.CCR-14-3073. [DOI] [PMC free article] [PubMed] [Google Scholar]
- 21.Wimberly H, Brown JR, Schalper K, Haack H, Silver MR, Nixon C, et al. PD-L1 Expression Correlates with Tumor-Infiltrating Lymphocytes and Response to Neoadjuvant Chemotherapy in Breast Cancer. Cancer Immunol Res 2015;3(4):326–32 doi 10.1158/2326-6066.CIR-14-0133. [DOI] [PMC free article] [PubMed] [Google Scholar]
- 22.Siska PJ, Johnpulle RAN, Zhou A, Bordeaux J, Kim JY, Dabbas B, et al. Deep exploration of the immune infiltrate and outcome prediction in testicular cancer by quantitative multiplexed immunohistochemistry and gene expression profiling. Oncoimmunology 2017;6(4):e1305535 doi 10.1080/2162402X.2017.1305535. [DOI] [PMC free article] [PubMed] [Google Scholar]
- 23.Bronte V, Brandau S, Chen SH, Colombo MP, Frey AB, Greten TF, et al. Recommendations for myeloid-derived suppressor cell nomenclature and characterization standards. Nat Commun 2016;7:12150 doi 10.1038/ncomms12150. [DOI] [PMC free article] [PubMed] [Google Scholar]
- 24.Brochez L, Chevolet I, Kruse V. The rationale of indoleamine 2,3-dioxygenase inhibition for cancer therapy. Eur J Cancer 2017;76:167–82 doi 10.1016/j.ejca.2017.01.011. [DOI] [PubMed] [Google Scholar]
- 25.Katz JB, Muller AJ, Prendergast GC. Indoleamine 2,3-dioxygenase in T-cell tolerance and tumoral immune escape. Immunol Rev 2008;222:206–21 doi 10.1111/j.1600-065X.2008.00610.x. [DOI] [PubMed] [Google Scholar]
- 26.Holmgaard RB, Zamarin D, Li Y, Gasmi B, Munn DH, Allison JP, et al. Tumor-Expressed IDO Recruits and Activates MDSCs in a Treg-Dependent Manner. Cell Rep 2015;13(2):412–24 doi 10.1016/j.celrep.2015.08.077. [DOI] [PMC free article] [PubMed] [Google Scholar]
- 27.Loi S, Dushyanthen S, Beavis PA, Salgado R, Denkert C, Savas P, et al. RAS/MAPK Activation Is Associated with Reduced Tumor-Infiltrating Lymphocytes in Triple-Negative Breast Cancer: Therapeutic Cooperation Between MEK and PD-1/PD-L1 Immune Checkpoint Inhibitors. Clinical cancer research : an official journal of the American Association for Cancer Research 2016;22(6):1499–509 doi 10.1158/1078-0432.CCR-15-1125. [DOI] [PMC free article] [PubMed] [Google Scholar]
- 28.Forero A, Li Y, Chen D, Grizzle WE, Updike KL, Merz ND, et al. Expression of the MHC Class II Pathway in Triple-Negative Breast Cancer Tumor Cells Is Associated with a Good Prognosis and Infiltrating Lymphocytes. Cancer Immunol Res 2016;4(5):390–9 doi 10.1158/2326-6066.CIR-15-0243. [DOI] [PMC free article] [PubMed] [Google Scholar]
- 29.Durrant LG, Ballantyne KC, Armitage NC, Robins RA, Marksman R, Hardcastle JD, et al. Quantitation of MHC antigen expression on colorectal tumours and its association with tumour progression. British journal of cancer 1987;56(4):425–32. [DOI] [PMC free article] [PubMed] [Google Scholar]
- 30.Roemer MGM, Redd RA, Cader FZ, Pak CJ, Abdelrahman S, Ouyang J, et al. Major Histocompatibility Complex Class II and Programmed Death Ligand 1 Expression Predict Outcome After Programmed Death 1 Blockade in Classic Hodgkin Lymphoma. Journal of clinical oncology : official journal of the American Society of Clinical Oncology 2018;36(10):942–50 doi 10.1200/JCO.2017.77.3994. [DOI] [PMC free article] [PubMed] [Google Scholar]
- 31.Ebert LM, MacRaild SE, Zanker D, Davis ID, Cebon J, Chen W. A cancer vaccine induces expansion of NY-ESO-1-specific regulatory T cells in patients with advanced melanoma. PloS one 2012;7(10):e48424 doi 10.1371/journal.pone.0048424. [DOI] [PMC free article] [PubMed] [Google Scholar]
- 32.Baixeras E, Huard B, Miossec C, Jitsukawa S, Martin M, Hercend T, et al. Characterization of the lymphocyte activation gene 3-encoded protein. A new ligand for human leukocyte antigen class II antigens. J Exp Med 1992;176(2):327–37. [DOI] [PMC free article] [PubMed] [Google Scholar]
- 33.Andrews LP, Marciscano AE, Drake CG, Vignali DA. LAG3 (CD223) as a cancer immunotherapy target. Immunol Rev 2017;276(1):80–96 doi 10.1111/imr.12519. [DOI] [PMC free article] [PubMed] [Google Scholar]
- 34.Gajewski TF, Schreiber H, Fu YX. Innate and adaptive immune cells in the tumor microenvironment. Nat Immunol 2013;14(10):1014–22 doi 10.1038/ni.2703. [DOI] [PMC free article] [PubMed] [Google Scholar]
- 35.Daud AI, Loo K, Pauli ML, Sanchez-Rodriguez R, Sandoval PM, Taravati K, et al. Tumor immune profiling predicts response to anti-PD-1 therapy in human melanoma. J Clin Invest 2016;126(9):3447–52 doi 10.1172/JCI87324. [DOI] [PMC free article] [PubMed] [Google Scholar]
- 36.Tumeh PC, Harview CL, Yearley JH, Shintaku IP, Taylor EJ, Robert L, et al. PD-1 blockade induces responses by inhibiting adaptive immune resistance. Nature 2014;515(7528):568–71 doi 10.1038/nature13954. [DOI] [PMC free article] [PubMed] [Google Scholar]
- 37.Hugo W, Zaretsky JM, Sun L, Song C, Moreno BH, Hu-Lieskovan S, et al. Genomic and Transcriptomic Features of Response to Anti-PD-1 Therapy in Metastatic Melanoma. Cell 2016;165(1):35–44 doi 10.1016/j.cell.2016.02.065. [DOI] [PMC free article] [PubMed] [Google Scholar]
Associated Data
This section collects any data citations, data availability statements, or supplementary materials included in this article.